Are K–12 Students Keeping Pace in English?

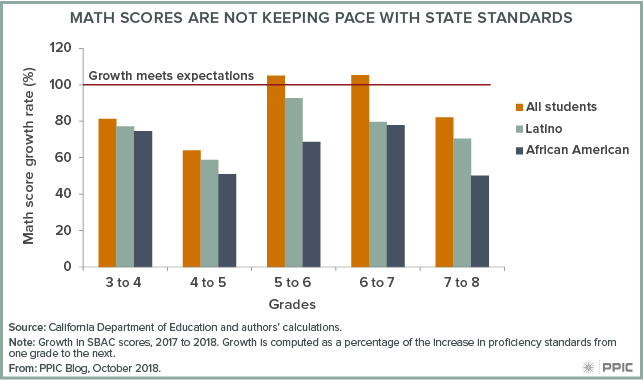
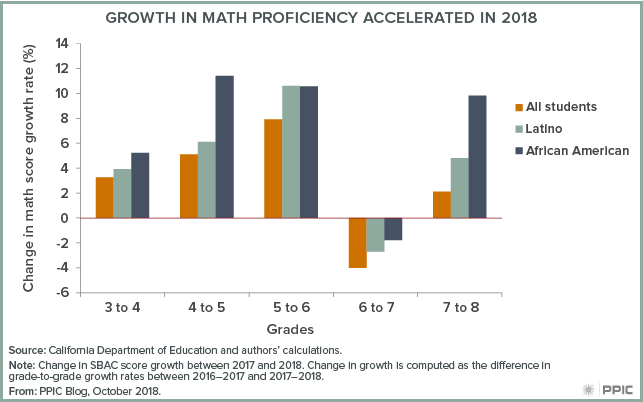
Last month, we wrote about how newly released 2018 SBAC test score data show that student growth in math has been insufficient to keep pace with grade-level proficiency standards. And though student growth in math proficiency is accelerating, racial disparities are widening as students progress through school.

The picture is somewhat more promising for English. Growth in English test scores generally outpaced the state standards—meaning more students were gaining mastery of English than in prior years. Moreover, the growth in 2018 English scores was much higher than in 2017.

The figure below shows the growth in English test scores from grade to grade—how last year’s third graders performed in fourth grade, and so on—relative to the growth in the score required for proficiency in each grade. A growth rate of greater than 100% indicates that average student progress is outpacing what is expected by the standards, while growth of less than 100% suggests progress is not keeping pace with standards.

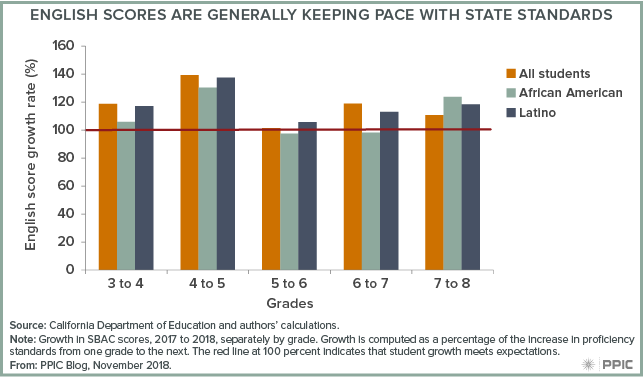
Across all grades, growth in average student test scores outpaced growth in grade-level proficiency standards. This year’s 5th graders showed particular improvement, with average growth outpacing the standards by 40%. In other words, many more 5th graders are meeting standards in English than they were last year in 4th grade (49.4% vs 45.1% to be exact).

But in most grades, racial disparities in English achievement are still growing with each grade progression: the scores of African American and Latino students grew less than the average student’s scores. However, the pattern is reversed in between grades 7 and 8, where African American and Latino scores grew more than average, reducing these disparities somewhat. In addition, the disparities in English score growth are notably smaller than the disparities in math.

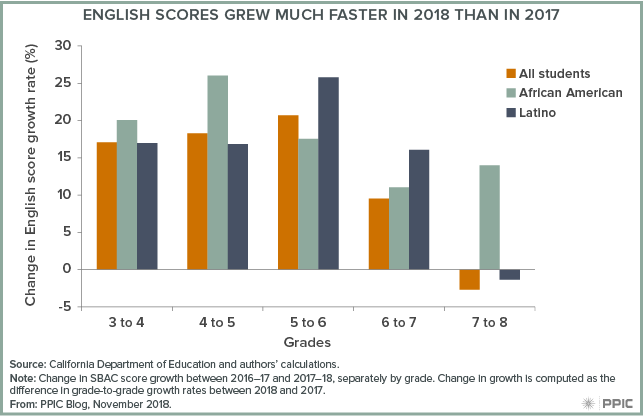
We also see improvements when we compare growth rates between 2017 and 2018. Growth in grades 4 to 7 accelerated considerably in 2018—for example, among Latino sixth graders, English test scores improved a little over 25% more than the scores of their counterparts in 2017—though growth in grade 8 was slightly slower compared to 2017. African American student progress was especially noteworthy, with growth improving more than the average student across four of five grades. While the previous figure shows that achievement gaps still grow slightly as students progress through school, these gaps in growth are small and shrinking.

Looking at the grade-to-grade growth of the same cohorts of students provides a lens to examine whether students are keeping up with grade-level expectations, and whether achievement gaps are shrinking or growing as students advance through school. These findings generate hope that recent reforms are bearing fruit, but there is yet more work to be done. Despite progress in 2018, just under half of our students in grades 3–8 and 11 are proficient at their grade level in English, and less than 40% are in math. Sustaining and improving on this growth will be key to addressing these shortcomings in student achievement.

Are K–12 Students Keeping Pace in Math?

The California Department of Education recently released 2018 SBAC test scores that showed very modest improvement. Since last year, the percent of students meeting or exceeding state standards grew 1.1 percentage points in math. But focusing only on these year-to-year comparisons means that we miss the longer-term picture. That is, we don’t see how the same group of students are progressing over time. When we look at SBAC math scores in this manner, we have some cause for concern—but there are bright spots, too.

In the figure below, we show the growth in math test scores from grade to grade—that is, we can see how last year’s third graders performed in fourth grade, and so on.  If growth is less than 100 percent, students aren’t keeping up with grade-level standards. If it is greater than 100 percent, student growth is outpacing what is expected by the standards. For instance, fourth grade students gained roughly 80 percent of the increase needed to keep pace with the proficiency standards.

Across all grades student scores grew, but only in grades 6 and 7 did the average student growth keep pace with the growth in standards. In all other grades students fell behind, with fewer keeping pace with the growth in grade-level standards. Perhaps more discouraging, the math scores of African American and Latino students grew less than the average student across all grades, meaning that racial and ethnic disparities are growing as students progress through school. These results suggest that growth among low-income students also lags the standards, since African American and Latino students account for more than 75 percent of economically disadvantaged students.

There is a silver lining in the 2018 growth numbers. Across most grades, growth in math was higher in 2018 than it was in 2017, meaning that fewer students are falling behind as they progress through school. This can be seen in the figure below, which shows how math score growth has changed between 2017 and 2018. Growth did slow for seventh graders, yet as the previous figure shows they still managed enough growth to outpace state standards, despite the slowdown.

Also encouraging: racial disparities in growth rates are smaller in 2018 than they were in 2017, as African American and Latino student improvement in math was greater than average student improvement across every grade. For instance, among African American fifth graders math scores improved about 11 percent more in 2018 than their counterparts’ improved in 2017. Thus, while achievement gaps still grow as students advance, gaps in growth are shrinking, and these disparities are growing more slowly than in years prior.

Standardized Testing and College Eligibility

In California and across the nation, there has been a growing focus on increasing college access by improving college readiness for high school students and encouraging more eligible students to attend college. To this end, many states and educational institutions have changed how they use college entrance exams like the SAT and ACT.

One approach has been to have more students take the SAT or ACT in hopes of identifying those who are eligible for college but might not have taken a college entrance exam on their own. As of 2016–17, 25 states use the SAT or ACT as their standardized test for 11th graders.

Assemblymember O’Donnell (D-Long Beach) has proposed AB 1951, which would give districts the option to use the SAT or ACT in place of California’s 11th-grade standardized test. Though Governor Brown vetoed the bill at the end of the 2017–18 legislative session, O’Donnell promised to bring it back in the next session, when California has a new governor.

But even as many states are administering the SAT or ACT to all students, a growing number of colleges and universities are dropping these tests as an entrance requirement. Citing concerns about biases in the exams, as well as the extra financial or time constraints for students, liberal arts colleges like Mills College in California and prominent universities such as the University of Chicago have made submitting test scores optional. Currently, California State University (CSU) does not require students to submit an SAT score (though most still do) if they meet the high school GPA threshold of 3.0 or higher. Despite this trend, most four-year colleges continue to use college entrance exams in their admissions decisions and a growing share of high school graduates take either the SAT or ACT.

In his veto message, the governor suggested another possible way to expand eligibility. California universities could consider using the state’s standardized test (SBAC) as an eligibility measure. All California 11th graders in public schools take the SBAC, which is aligned with the Common Core State Standards and is already used as an early diagnostic of college readiness at CSU and many community colleges. New evidence suggests that the SBAC does as well as the SAT in predicting first-year performance at California’s public universities.

Any of these strategies could increase the number of students eligible for California’s universities—but not all of them would work well together. For example, the University of California and CSU are further scrutinizing the role of the SAT in the admissions process. If the systems decide to drop the SAT requirement, then AB 1951 might have less of an impact. Looking forward, as state policymakers and districts continue to craft policies to improve college access, they should first consider how California’s universities are using—or not using—standardized tests.