A Bottom-Up Approach to Groundwater Sustainability

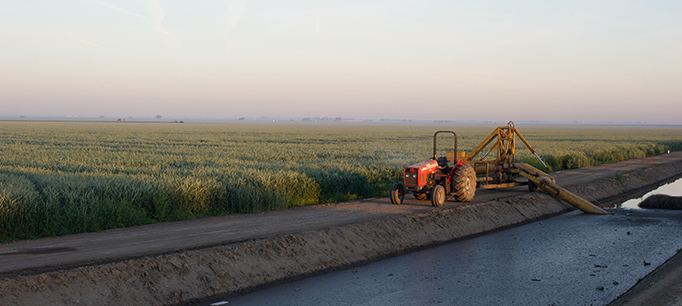
California’s Sustainable Groundwater Management Act (SGMA) requires communities with ongoing groundwater deficits to bring their aquifers into balance in the coming years. This will be a difficult and complex process, but it’s also an opportunity to devise workable solutions at the community level. We talked to Eric Averett of the Rosedale–Rio Bravo Water Storage District about groundwater management innovations being tried in his Kern County district and lessons learned that might have wider application.

PPIC: What are the priority areas for addressing groundwater sustainability in your district?

Eric Averett: The most challenging area is managing and mitigating impacts associated with demand reduction. Rather than mandating that individual landowners reduce demand, our district has pursued a path that we think gives individuals greater flexibility. The idea is that every acre will be assigned a water budget based on what the district can provide or considers sustainable. If a landowner uses more than that amount, it triggers a water charge. The district will use those funds to develop water supply programs or purchase land from willing sellers to retire it from production. Either way, this system doesn’t take anything away from landowners’ ability to manage their own water, it just gives them more options.

Another important area we’re looking at is water trading within our district’s boundaries. We’ve implemented a pilot study that empowers landowners to act as buyers or sellers in managing their water resources. We think water trading will be an essential tool to getting aquifers into balance and maximizing the value of the resource. For example, during a drought, a small grower with row crops may find greater value in fallowing a field and selling the water. At the same time, a grower who may be short of water and facing the loss of a permanent crop may enter the market as a buyer. If we don’t find a way to create these buy/sell opportunities, we strand the asset.

A third area we’re working on is creating individual groundwater bank accounts for landowners. We have a number of landowners who’ve committed to make their land available for recharge in exchange for a portion of the recharged water being credited to their account. Alternatively, some landowners have acquired a source of water and asked the district to use it for recharge on their behalf. Both types of programs were tested successfully in 2017, and we look forward to expanding the concept.   Ultimately, we’re looking at ways the district can assist landowners in becoming sustainable and mitigating SGMA impacts.

PPIC: How are you handling the issue of dry wells?

EA:  During the most recent drought, we experienced a number of wells that went dry. Kern County’s groundwater levels can be very dynamic, in part because of the groundwater banking projects within the region. These projects pump out large volumes of water during droughts, causing the water table to drop a lot and fairly quickly. We’ve developed a unique mitigation program in partnership with the banking projects. We utilize a groundwater model to evaluate the well in question. If it’s determined that the well’s failure was due to water level impacts from the banking projects, we mitigate the impacts. Within 24 hours of the well going dry they’re connected into a temporary water supply. To date, we’ve spent more than $1 million replacing and repairing wells, or connecting people with dry wells to local service providers. The proof of success is that not one landowner has pursued legal remedies, and all have been satisfied with the results. We think it’s a good template for others to try and may be a model going into the groundwater sustainability planning process.

PPIC: What’s the big lesson from your district’s efforts?

EA In all of these areas, our goal is to have the district be a resource for sustainability, not a regulator. Each landowner is unique: some have thousands of acres, and the impacts on them may not be as great as for someone with a small parcel. A lot of smaller landowners may be unable to manage the fixed costs that will arise from implementing SGMA. We wanted to address the diversity in our district and not disadvantage any one user.

We’re emphasizing approaches that let growers decide what’s best for them—whether it’s helping them put unused water into a market or compensating them for using their land for recharge. Everyone in the district will have to live with the water budget we come up with, but we want to provide as many tools and options to get to sustainability as we can.

California Needs More Math and Science Teachers

Recent reforms in educational standards—including the Common Core math standards and the Next Generation Science Standards—have altered the expectations placed on California’s teachers. Other changes, such as requiring college prep courses for high school graduation, will further increase the demand for math and science teachers. The state’s teacher workforce has already changed significantly in the past 15 years, but it will need to further evolve to meet the demands of the future.

These are a few of the challenges ahead:

  • Although the number of math and science teachers has increased in the state, there are fewer of them than in other core subjects. As a result, the average class size in math and science at all levels is larger in California than in other states. For instance, the average class size for high school science in California is 27, well above the national average (22). Similarly, average enrollment in high school math is 25, which is again higher than the national average (21).
  • The teacher workforce in math and science is aging rapidly. In 2016, the median age of the state’s math and science teachers was 44, three years older than the national average. In the next five years, California will need to replace at least 11% of these teachers due to retirement. About 12% of districts will need to replace at least 20% of their teachers.
  • The composition of the teacher workforce in math and science has changed in recent years, yet it still does not reflect the diversity of California students. In the 2000–01 school year, only 10% of math and science teachers were Latino; today, 17% of them are (while 54% of the student body is Latino). The share of Asian teachers has increased slightly, while the share of African American teachers remains unchanged. Research shows that teachers of color play a critical role in helping students of color succeed.

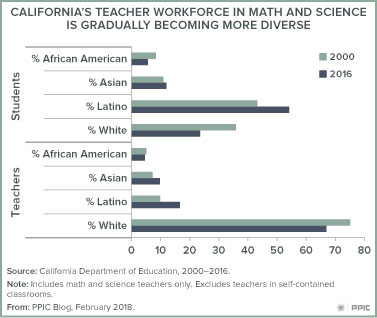
As California’s schools continue to implement new math and science standards, the challenge of developing a larger and more diverse teacher workforce will loom large. There are examples of efforts both in California and in other states designed to address some of these challenges. For example, Call Me MISTER in South Carolina aims to recruit college students to increase the incoming teacher pool, while other programs—like Boston Public Schools’ High School to Teacher Program—reach out to students in high schools. In addition, some programs focus on recruiting members of the local community (e.g., Teach Tomorrow in Oakland, the San Francisco Teacher Residency program, and the Grow Your Own programs in Illinois).

These initiatives represent potential models, but they would need to scale up quickly to address the challenges ahead. PPIC’s ongoing research into the implementation of the Next Generation Science Standards suggests that the high demand for quality science teachers is an emerging implementation concern.


Californians and DACA

In September, the Trump administration announced an end to the DACA (Deferred Action for Childhood Arrivals) program, which includes protections for some undocumented immigrants who were brought to the United States as children. Under DACA, those who qualify and pass a background check can receive protection from deportation and a work permit. California is home to about 223,000 DACA recipients—more than one-fourth of the national total.

The administration and Congress have been negotiating a potential compromise that would preserve DACA protections for qualifying individuals. In January, the PPIC Statewide Survey found that 85% of adults and 81% of likely voters in California favor the protections offered by DACA. Recent surveys by ABC/Washington Post and CNN have found similarly high levels of support for DACA among adults nationwide. In California, support has increased slightly since September, when three-quarters of adults and likely voters were in favor of DACA protections.

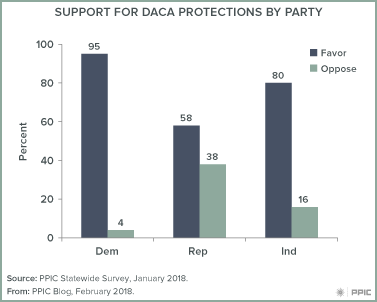
In today’s politically polarized environment, it is notable that majorities of California Democrats, Republicans, and independents support the DACA program. In PPIC’s January survey, we find that while Republicans are less likely than Democrats and independents to support DACA protections, a solid majority (58%) are in favor. Indeed, DACA has a high level of support across the state’s regions and demographic groups, with at least three in four adults in favor. Results were similar in September, when strong majorities across parties and at least seven in ten across demographic and regional groups expressed support.

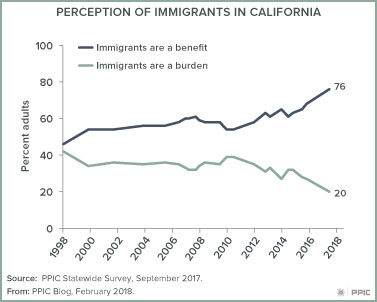
The high levels of support for DACA are perhaps unsurprising given Californians’ shifting attitudes toward immigrants. In PPIC’s September survey, three in four Californians (76%) said that immigrants are a benefit to the state because of their hard work and job skills—a high mark in PPIC surveys. Only 20% said immigrants are a burden because they use public services. Indeed, Californians are now far more likely to see immigrants as a benefit than they were in April 1998 when we first asked this question (46% benefit, 42% burden).

Interestingly, this shift in attitudes is not unique to California. In a June 2017 survey of adults nationwide, the Pew Research Center found that 65% of adults thought immigrants strengthened the country, while 26% felt immigrants burdened the country. This is a stark contrast to 1994, when only 31% of adults nationwide felt immigrants strengthened the country and 63% said they were a burden. As the debate on DACA and immigration policy continues, looking at changes in public attitudes on this issue can highlight areas of potential compromise for policymakers.


Why We Need Working Floodplains

Floodplains are hard-working landscapes when they’re allowed to “act naturally.” But their flood-taming, habitat-feeding abilities are compromised when they’re paved over or constricted by levees. We talked with Josh Viers, a watershed scientist at UC Merced and a member of the PPIC Water Policy Center research network, about restoring floodplains.

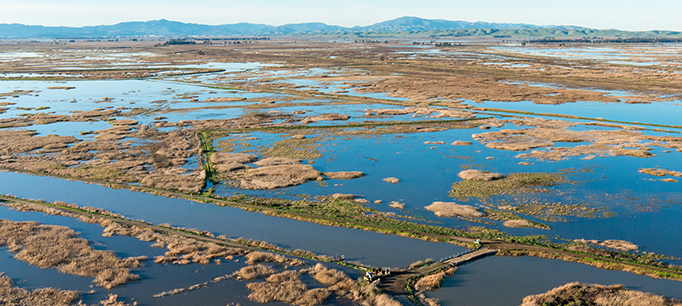
PPIC: What happens when rivers are given more room to flood?

Josh Viers: River systems are highly dynamic—they’re always changing in time and space. As they rush from their headwaters, they break down mountains and transport a lot of sediment. By the time they reach the lowlands, they’ve started to deposit that sediment. It’s that dynamic between water and land that creates floodplains. Humans like to inhabit floodplains because of their rich soil and flat land. So we’ve engineered ways to protect people from floodwaters. But ecosystems evolved to have functions and processes that depend on floods. For example, flood flows are slower and warmer on floodplains. That creates good conditions for a lot of creatures―bugs, fishes, and birds, for example. When we cut off rivers from their floodplain, we’re cutting off these essential habitat functions.

We now recognize that giving rivers room to flood can have many beneficial outcomes. Dynamic river systems that are allowed to flood result in more complex habitats and more productive ecosystems. There’s a growing effort to reconnect floodplains to their rivers—for example, by setting back or breaching sections of levees. The most immediate benefit is a reduction in flood hazards downstream because you store some floodwater and some of the sediment that constricts channels on the floodplain. There are also ecosystem benefits. As more nutrient-rich sediments are deposited on the floodplain, they’re colonized by riparian plants, feeding whole communities of insects, birds, and other animals. Floodplains are also incubators for native fishes. Fishes on floodplains get much fatter than those that remain in the river, which can translate into better reproductive success. Floodwaters in floodplains can also recharge local groundwater supply, and they facilitate the long-term sequestration of carbon by burying plant matter with sediments deposited on the floodplain.

PPIC: Where is floodplain restoration underway?

JV: I’ve been part of a team of scientists looking at floodplain restoration on the Lower Cosumnes River near Sacramento. This river has no major dam on it so it has a relatively natural flow regime, including relatively frequent floods. We’ve studied how its floodplain responds to reconnection with flood waters after its levees were set back. And we’ve documented that setting back levees and allowing rivers to flood have multiple benefits for habitat and groundwater recharge while maintaining flood protection. The lessons from the Cosumnes are informing similar efforts in other locations—the Sacramento, San Joaquin, and Feather rivers are having some levees set back in strategic locations.

One of the more remarkable recent floodplain restoration projects is located at the confluence of the San Joaquin and Tuolumne rivers. Federal and state agencies have worked with landowners and conservation organizations to integrate flood protection and habitat creation through levee enhancements and the acquisition of key floodplain lands. The results have not only benefitted fish and bird populations, but also provided room for the rivers to behave more naturally in a location that has historically had large river meanders and complex features such as oxbows and sloughs―habitats that are now rare in the San Joaquin Valley.

PPIC: What’s slowing floodplain restoration in California?

JV: There are a number of obstacles. A big goal for these projects is to maintain or improve flood hazard reduction. So permitting processes can require fairly sophisticated studies that take time and money. They also have to undergo the same environmental review as any other construction project. And financing is a big hurdle. A few decades ago, floodplain restoration projects were fairly simple. Today, projects are bigger and more sophisticated, so costs have gone up. Also, projects can be hampered by urbanization, unwilling landowners, or poor conditions on the ground. That said, there are thousands of miles of levees and hundreds of miles of rivers, and many more places where we could do floodplain restoration.

Learn more
Read Floods in California (PPIC fact sheet)
Read “The High Cost of Fixing Levees” (PPIC Blog)
Visit the PPIC Water Policy Center flood resources page


Occupational Shifts Favor California’s High-Skill Workers

[vc_row][vc_column][vc_column_text]The recession and recovery have reshaped California’s workforce. Between 2008, when employment peaked, and 2010, when it bottomed out, the state lost three quarters of a million jobs. Since then, the state has experienced sustained job growth; according to US Census Bureau data, by 2016 there were 1 million more workers in California than there had been in 2008. This job growth has not been evenly distributed. Some occupations experienced large losses during the recession and have not fully recovered, while others experienced small losses and now have much higher employment levels than they did at their pre-recession peak. While there are some high-growth occupations that do not require high levels of education, workers with at least a bachelor’s degree have prospered the most over the past several years.

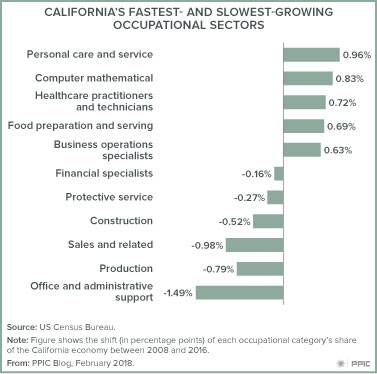
Overall, California’s workforce is becoming more educated: the share of the full-time year-round workforce with at least a bachelor’s degree grew from 31% in 2008 to 35% in 2016. Highly educated workers got more than half of the jobs created in the five fastest-growing occupational categories (based on increases in the share of total full-time year-round workers) between 2008 and 2016:

  1. Personal care and service
  2. Computer and mathematical
  3. Healthcare practitioners and technicians
  4. Food preparation and serving
  5. Business operations specialists

All of these occupations experienced small declines during the recession and strong growth during the recovery. The number of full-time year-round workers increased 28%—from 2.5 million in 2008 to 3.2 million in 2016. Workers in some of these occupations, such as food preparation and serving, earn relatively low wages and tend to have low levels of educational attainment, while workers in other areas, such as computer and mathematical, collect high wages and tend to be college graduates. Altogether, workers with at least a bachelor’s degree made up 433,000 (56%) of the 770,000 jobs gained between 2008 and 2016 by the top five categories.

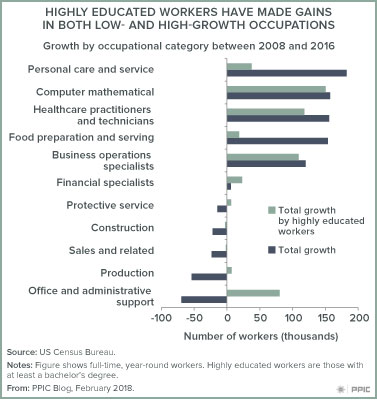
Workers with at least a bachelor’s degree also made gains in the five slowest-growing occupational categories:

  1. Protective service
  2. Construction
  3. Production
  4. Sales and related
  5. Office and administrative support

These occupations experienced sharp losses during the recession and have not returned to their pre-recession peaks. The number of full-time year-round workers in these occupations declined from 5.3 million in 2008 to 5.1 million in 2016. On average, educational attainment levels are low in these occupations, but workers with at least a bachelor’s degree fared relatively well: the number with at least a bachelor’s degree grew by 89,000, even though these categories have experienced a net loss of 184,000 jobs.

In short, the recession and recovery have accelerated some long-term trends in California’s economy. High-skill occupations and highly educated workers have fared well, while less-educated workers in lower-skilled jobs have faced declining employment opportunities.

[/vc_column_text][/vc_column][/vc_row]

Pretrial Risk and Cash Bail

Most of California’s jail inmates are unsentenced defendants awaiting arraignment, trial, or sentencing—and this heavy reliance on pretrial detention has come under scrutiny in recent years. The goals of pretrial detention are to make sure that defendants appear at court hearings and to ensure public safety. But California’s high pretrial detention rates have not been associated with more defendants appearing in court or lower levels of rearrest. Reforming the current system by allowing more defendants to be released pending trial could allow the state to free up scarce jail beds and realize substantial cost savings—while maintaining public safety.

Last year, state lawmakers examined the issue of cash bail, the predominate means by which defendants can be released pretrial. Legislation to change the system is pending. Under cash bail, judges can order defendants to pay a certain amount—which varies based on the alleged offense—in order to secure release. In most cases, defendants contract with bail bond companies to deposit the full amount of the bond with the court in exchange for a service fee (usually 10% of the bond). If the defendant complies with all court orders during the release period, the bond company gets the deposit back and keeps the defendant’s premium as payment. The idea is that the threat of financial penalty helps prevent pretrial misconduct—for example, making offenders less likely to flee the jurisdiction and more likely to appear in court.

However, there are several flaws in the bail system. Bail is calculated by offense, making it more challenging for defendants cited for more serious offenses to obtain release. This may make intuitive sense, but it turns out offense category is not typically a strong predictor of future misconduct. For instance, PPIC research found that misdemeanor probationers were in fact more likely to be booked into jail at least two times after release (19.6%) than felony probationers (17.6%). Moreover, cash bail makes it more difficult for low-income defendants to obtain release, regardless of their risk to public safety, raising concerns about whether the system is treating wealthy and poor individuals equitably.

The primary alternative is a risk-based framework in which law enforcement employs tools called risk assessments to determine which offenders can safely be released pretrial. Risk assessments use demographic data and information pertaining to a defendant’s criminal history to predict a defendant’s probability of disobeying the terms of his or her release. Some of these models show great promise. For example, researchers found judges in New York could reduce the jail population by 42% without affecting crime rates by following their model’s release recommendations.

But these tools have limitations. California already uses a range of risk assessment tools at the state and county levels, but they vary in predictive power based on whether they have been validated. Validating a risk tool means testing it using local data from the community of offenders it will be assessing. Counties using unvalidated, out-of-the-box risk assessments could improve their tools’ predictive powers by following the example of counties like Riverside, where county agencies collaborated with academics to tailor a tool that had been originally developed in Virginia to Riverside’s unique characteristics—boosting the model’s accuracy.

Local validation studies consume a lot of time and resources. Riverside’s took two years and required data from over 500 offenders. However, if the state continues to emphasize risk-based reform and evidence-based practices to improve its corrections system, making these models work for California and its counties should be a priority.


Jay Lund Elected to National Academy of Engineering

Jay LundJay Lunddirector of the UC Davis Center for Watershed Sciences and adjunct fellow at the PPIC Water Policy Center―has been elected to the National Academy of Engineering (NAE).

Lund is one of ninety-nine new members in this year’s class. He was cited “for analysis of water and environmental policy issues leading to integrated water resources planning and management.”

Election to the academy is among the highest professional distinctions in engineering. It is one of four organizations that comprise the National Academies, established by Congress to advise the nation on a wide range of scientific and technical issues.

As a professor of civil and environmental engineering, Lund has led the development and application of large-scale modeling for California’s water supply, as well as modeling studies for managing floods, climate change adaptation, water marketing, water utility planning, and integrated water resources management.

“Jay has been an essential partner to the PPIC Water Policy Center. He is also one of the most important thinkers on California water issues today,” said Jeffrey Mount, a senior fellow at the center. “He thinks about problems from all angles—infrastructure, operations, economics, ecosystems, hazards—making him one of a kind. And he has guided numerous UC Davis graduate students who went on to become water leaders here in California and around the world.”

Lund said he’s thrilled at the honor. “I’d like to think this shows that my specialty of linking hydrologic and economic analysis for our big water challenges is valued—and also that the highest levels of the engineering profession value of engineers working with others, such as PPIC, to inform and aid with policy problems. That’s really gratifying,” said Lund.

The NAE is a nonprofit that provides engineering leadership in service to the nation. Its more than 2,000 peer-elected members and foreign associates are among the world’s most accomplished engineers. The new class of engineers will be formally inducted during a ceremony in Washington, DC, in September.

Congratulations to Jay Lund on this well-deserved honor.

Learn more

Read “Storing Water for Dry Days,” an interview with Jay Lund (PPIC Blog)

Lund has been involved in many of PPIC’s most important water reports. Here is a complete list of his PPIC water publications.


Retraining Workers for the Future Economy

As the economy continues to shift toward computers and digital technology—and braces for a potential future with more robots—workers have been called upon to adapt and learn new skills. New industries and new kinds of jobs may lead to economic growth, but whether these gains are shared by all of California’s workers depends critically on their retraining. And that retraining, in turn, depends on the ability of educational institutions to also adapt to new labor market needs.

While workers can sometimes learn new skills on the job or on their own, other times retraining means obtaining a new credential and returning to the classroom. That’s especially true for people who work in technical industries that are being reshaped by forces like routinization, automation, and outsourcing.

California’s higher education system has an important role to play in delivering retraining options. The state’s community colleges are the primary provider, with hundreds of programs in skilled trades and applied sciences and technologies. Notably, community colleges offer retraining options at a much lower cost to students than do private for-profit two-year colleges, another major provider. In addition, many community college programs show substantial economic returns for students—especially in health professions.

Effective retraining through the state’s colleges would help ensure that all Californians are productive and self-sufficient, which would benefit not just families but also employers and the state economy. However, the current model of higher education was largely built for 18-year-old, first-time freshmen and does not necessarily work for older, returning students, who are almost certainly balancing training with career, family, and other demands.

Flexible course scheduling—for example, through online courses or “distance” education—is one way to better reach workers. California’s community colleges are the clear leader in offering online options. PPIC research has highlighted some limitations to online training and outlined ways to improve student outcomes. Online courses for technical programs may require additional innovation, especially those that require hands-on training. Governor Brown’s proposed budget for fiscal year 2018–19 includes funding for a fully online community college that has the potential to bring innovation to how retraining opportunities (and educational opportunities, broadly speaking) are offered to Californians.

For individuals or training programs not amenable to online options, expanding course offerings near job centers is key. Cal State Los Angeles’s satellite campus in downtown LA aims to do exactly this. Information about the job market is also crucial—and California’s community colleges have taken a big step in the right direction by providing easily accessible information on the labor market outcomes of different colleges and programs across the state.

Retrained workers may pursue all kinds of new skills, but career technical programs, most of which are in community colleges, are particularly important because they offer short-term credentials in industry-relevant fields. Efforts to make career technical programs more flexible—through, for example, online courses, convenient locations, and partnerships with employers—are critical to filling student, employer, and state needs in a rapidly changing workplace.

Learn more
Visit the PPIC Higher Education Center


Testimony: Safety Net Plays Key Role in Reducing Poverty

Sarah Bohn, research fellow at the Public Policy Institute of California, testified today, February 14, 2018, before the Senate Budget and Fiscal Review Committee, Informational Hearing on Human Services. The topic of today’s hearing: poverty and social safety net programs. Here are her prepared remarks.

Poverty is high in California, and it has not improved as much as the economy has in recent years. In fact, California’s poverty rate is highest in country, according to our estimates. Throughout this presentation, I will rely on the California Poverty Measure research (a joint effort between PPIC and Stanford) that accounts not only for earnings but also for benefits from major safety net programs and the cost of housing to give a comprehensive, accurate, and state-specific account of the resources families have on hand to meet their basic needs.

We find that 19.5% of Californians were poor as of 2015—that means 7.5 million people living below a basic needs threshold (less than $30,000 in total resources for a family of four). The poverty rate is slightly higher for children at 21.6%. In addition, 5.5% of Californians are in deep poverty—which means they have less than half of what it takes to meet basic needs, or about $15,000 annually for a family of four. Overall, the share of Californians in poverty remains higher than it was before the last recession started and is relatively high by historical standards.

To understand why, providing a long-term picture of how all Californians have fared is helpful. For the bottom half of California families, income has been quite stagnant for at least the past three decades. The bottom 10% are earning less than they were in 1980 (about $20,000) and the bottom 20% are earning just 4% more.  Compare that to the top 10%, which are earning 54% more than they did in 1980.  Much of this is driven by how economic opportunities (especially in the labor market) have changed and polarized – generating both high rates of poverty and high income inequality.

How does this relate to the safety net? With stagnant earnings since 1980, safety net resources become an even more important factor in making ends meet as cost of living increases. Our estimates show that major safety net program benefits play a critical role in mitigating poverty. The California poverty rate would be 8 points higher were it not for these programs—that means an additional 3.1 million Californians would be in poverty. The deep poverty rate would more than double were it not for the safety net.

Looking specifically at CalFresh, CalWORKs, and SSI—the programs we’re focusing on today—we estimate that a large number of Californians are moved out of deep poverty or poverty because of the program benefits they or their family members receive.

Specifically, CalFresh moves 400,000 people out of deep poverty; 800,000 are moved out of poverty.  The numbers are a bit smaller for CalWORKs families (150,000 from deep poverty and 400,000 from poverty), in part because the program reaches fewer families. And finally, SSI moves about 400,000 out of deep poverty and about the same number out of poverty. Keep in mind that families on these programs may be far from the poverty line, so even if they are not technically moved out of poverty, program resources can still be an important way for them to meet basic needs. Families may also benefit from multiple programs in combination.

The safety net plays a critical role in helping make ends meet but income from work is still the biggest component of family resources, even for families in poverty. And as we saw over the long term, the trend in income alone is not positive for families in the bottom half of the income distribution. So in addition to helping families manage in the short term, ideally social safety net programs could contribute to mobility over the long term, counteracting the trend in income inequality. However, one factor limiting the potential impact of safety net resources is the high cost of living in California, driven mostly by housing but also other living expenses like child care and medical costs.

After we consider these other expenses, we end up with poverty rates that are high compared to other states and high within and across California as well.  This is what the poverty looks like across a number of demographic characteristics.

You’ll notice that the incidence of poverty varies the most across education levels (and here we’re only looking at adults age 25–64 who’ve had enough time to acquire education). Men and women are about equally likely to be in poverty. Latinos in California are twice as likely to be poor as white residents (27% vs. 13%), and black and Asian residents fall in between.

Across the state, poverty varies considerably. The highest rate is in Los Angeles, at 25% (with Santa Cruz and Santa Barbara close behind). The lowest is in Placer County at 13% (nearby Sierra counties of Alpine, Mariposa, and others have similar rates).

As we all see day to day, poverty is concentrated much more narrowly than at the county level—sometimes it varies neighborhood to neighborhood. In fact, we find that the highest and lowest rates of child poverty in the state are in neighborhoods of Los Angeles that are just 20 to 30 miles apart. Similar differences can be seen in neighborhoods across the Silicon Valley. The concentration of poverty raises concerns that there are other factors about places—beyond just income level—that diminish the chances for residents to get ahead.

This map is surprising because it does not track one-for-one with unemployment or other economic indicators. Access to good-paying jobs is the number one factor in preventing poverty. But it is not sufficient because the cost of living (housing, child care) looms large—and those expenses tend to be higher in exactly the places where unemployment is lower and wages higher, making it hard to make ends meet even with a full-time job. High living expenses coupled with the long-term stagnation in low to middle incomes yields the high rates of poverty we see today even with very low unemployment rates.

In this context it is critically important to be aware of the role social safety net programs play in helping Californians make ends meet—as I mentioned the poverty rate would be 40% higher were it not for major means tested programs in California.  Nonetheless, California has the highest poverty rate in the country—even with a booming economy—so it is exactly the right time to discuss where the safety net falls short and what needs to be done.

Video: Countdown to the Primary

Less than four months before the June primary, Democrats Gavin Newsom and Antonio Villaraigosa are in a virtual tie among likely voters in the gubernatorial race. But a quarter of likely voters are undecided—as many as support either of the front-runners in the top-two contest. In the US Senate race, Dianne Feinstein continues to lead fellow Democrat Kevin de León by double digits, with a third of likely voters undecided.

These are among the key findings in the January PPIC Statewide Survey, presented by researcher Lunna Lopes at a Sacramento briefing last week.

Among other highlights of the survey:

  • Likely voters are divided on two ideas that may be on the fall ballot: repeal of the recently passed increase in the state gasoline tax and a change in the strict limits on commercial property taxes imposed by Proposition 13. Under the property tax proposal, commercial properties would be taxed according to their fair market value but limits on residential property taxes would remain in place.
  • Most Californians favor the governor’s proposed budget and believe the governor and legislature will be able to work together and accomplish a lot. However, expectations of cooperation are low for the president and Congress.
  • Many Californians closely following news about sexual misconduct in the state legislature, and they are divided about how Democratic leaders are handling this issue so far.
  • Californians are most likely to name immigration as the top issue facing the state today, and majorities across parties favor the DACA protections.

Learn moreRead the January PPIC Statewide Survey: Californians and Their Government
Find out more about the PPIC Statewide Survey