Feeding Children When Schools Are Closed for COVID-19

By state law, all public schools in California must provide at least one nutritionally adequate meal to students—however, many students eat more than one meal a day at school. Nearly four million students received meals from California’s public schools in the 2018–19 school year: close to 300 million breakfasts and well over 500 million lunches. With schools closed to reduce exposure to the new coronavirus, many students now lack ready access to these meals.

By federal law, low-income students (about $48,000 for a family of four in 2020) are eligible for free or low-cost school meals. Higher income students paid on average $0.98 for breakfast and $2.11 for lunch in 2017–18, according to the California Department of Education.

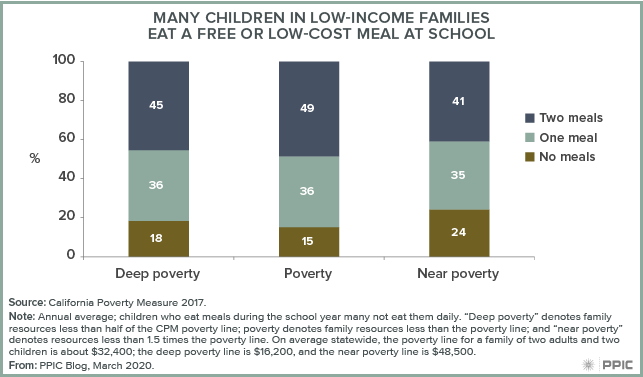
The vast majority of low-income students eat some or all breakfasts, lunches, or both at school. Free and reduced-price meals lower food insecurity, and according to the California Poverty Measure (CPM), meaningfully reduce poverty among families with public school students. Without school meals, the share of students living in deep poverty would be 17% higher; increases for students in less severe poverty would be 2% to 8%.

figure - Many Children in Low-Income Families Eat a Free or Low-Cost Meal at School

With school closures in place for several weeks, school districts have already designated sites where families can pick up meals for children. In higher poverty areas, all children can access meals regardless of enrollment in the local school or eligibility for meal programs because authorities have temporarily relaxed federal regulations.

During closures, Governor Newsom assured that schools will continue to receive state funds to operate and requested efforts focus on certain areas, including providing school meals. However, access remains a concern. For example, Los Angeles Unified School District lists 64 “grab-and-go” sites for its roughly 1,000 schools. San Diego Unified School District has 13 sites for 181 schools, as of March 16. Elk Grove, with 67 schools, has 34 sites for drive-through and grab-and-go meal services along with a mobile service for families with limited transportation.

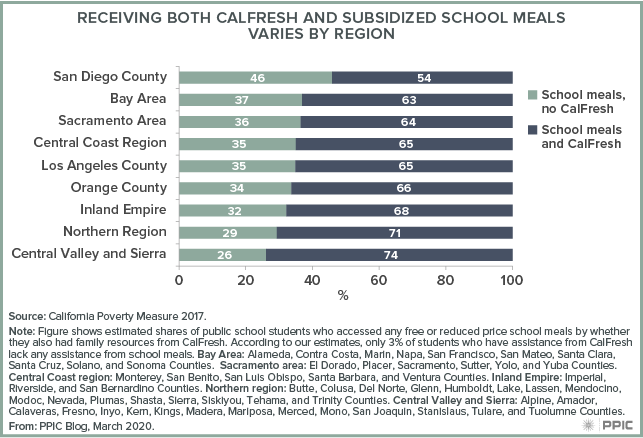
With pandemic EBT (P-EBT), ATM-like cards pre-loaded with funds for groceries, the federal government is also helping low-income students replace missed school meals. The cards will cover the expected number of days that schools will be closed. For students whose families already receive monthly CalFresh benefits on EBT cards, funds can readily be added. For low-income students who do not already receive CalFresh (34% statewide), families must complete some paperwork—mainly electronically—to obtain an EBT card.

Because the reach of CalFresh varies across the state, barriers to getting P-EBT funds to students will also vary. Fortunately, the state already matches student data with their CalFresh, CalWORKs, and Medi-Cal data to automatically determine students eligible for free and reduced-price school meals. If the state can use all existing sources of family income to provide P-EBT to students, they will reach more low-income students.

figure - Receiving Both CalFresh and Subsidized School Meals Varies by Region

Ready access to meals influences student health, learning, and economic wellbeing. Robust access to free and reduced-price meals can decrease the stress low-income families are facing as efforts to limit the spread of COVID-19 dampen economic activity.

For Many Californians, Poverty Is One Minor Expense Away

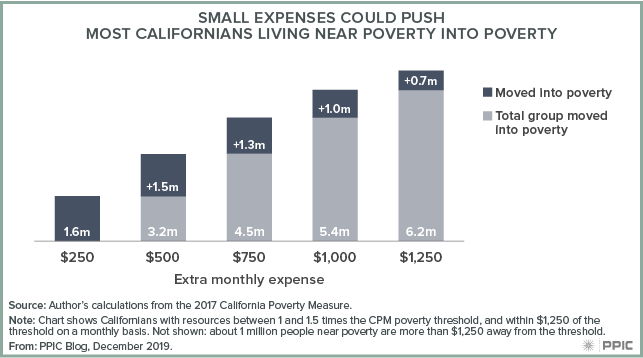
Add one extra expense and families living just above the poverty line could fall into poverty. Data from the California Poverty Measure (CPM) show that 7.2 million Californians live near poverty, that is, with just enough resources to meet their basic needs. All told, in 2017 as many Californians lived just above the poverty line as below it, or about 18% in each case. Even a small change, a monthly expense of $250 or less, could push 1.6 million people under the line.

We define “near poverty” to mean having resources worth 1 to 1.5 times the poverty threshold after taxes and necessary expenses. Since the CPM accounts for California’s varied living costs, the range for near poverty differs across regions. In Fresno County, a family of four who rents their home and has $25,900 to $38,900 in resources is near poverty, while in Santa Clara County, the same is true of a family of four with $40,000 to $60,000.

Because the poverty line is a blunt standard, “near poverty” includes families earning just a few dollars above the poverty threshold—even though a few dollars are unlikely to make it easier to make ends meet. This makes it especially important to understand how many Californians are near poverty, and how close those near poverty are to falling into it.

Californians can be pushed into poverty by the smallest expenses. Overall, people near poverty are more likely to be pushed into poverty by a small expense than a large expense. As expenses grow, the total number of people threatened climbs. Three out of four people near poverty, or 5.4 million, are pushed into poverty by an extra $1,000.

figure - Small Expenses Could Push Most Californians Living Near Poverty into Poverty

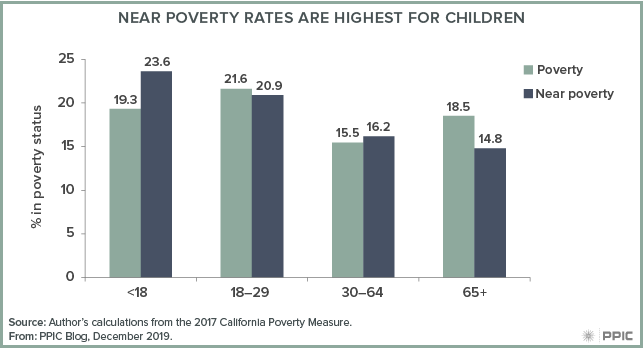
Near poverty affects young people more than it does older Californians, and children under 18 are more likely to be near poverty (23.6%) than in poverty (19.3%). Young adults and seniors, however, are more likely to be in poverty. Regional differences in living costs, opportunity levels, and the impact of existing policies and programs are key factors driving this variation.

figure - Near Poverty Rates Are Highest for Children

Without safety net programs, more people, and in particular, more families with children, would face poverty instead of near poverty: resources from programs including CalFresh and the federal and state Earned Income Tax Credits (EITCs) keep 7.1% of Californians out of poverty. Yet almost all people (93%) who move out of poverty via the safety net move into near poverty. This fact has implications for policymakers’ ongoing efforts to help ensure all Californians can meet their basic needs. As the state works to reduce poverty, strategies that promote economic mobility complement investments in programs like the CalEITC and the new Young Child Tax Credit.

Food Assistance Linked to Student Success in College

Student hunger on college campuses is a serious concern, potentially affecting students’ health and academic achievement. At the University of California (UC), as many as 42% of students faced some degree of food insecurity in 2016, with one in five reporting reduced food intake due to limited resources. With funding provided by the UC system, individual campuses have undertaken a range of strategies to address the problem—including food pantries, free food cafes, and efforts to increase enrollment in CalFresh, the state’s food assistance program for low-income residents.

Increasing CalFresh enrollment among college students has also been the focus of recent state legislation, which has eased work requirements and removed barriers to enrollment. For example, low-income or first-generation students who qualify for California’s Educational Opportunity Program (EOP) are now automatically eligible for CalFresh. In 2016, just 2% of UC students were enrolled in CalFresh, but we don’t yet know how recent changes to eligibility have affected enrollment.

In addition to providing food assistance, enrolling in CalFresh appears to be a promising strategy to promote student success, according to our research at the University of California, Santa Cruz (UCSC). Our study of students who participated in the campus’s Slug Support program—a basic-needs program that provides food, housing, financial, and crisis assistance for students—shows that CalFresh enrollment is associated with improved retention in students’ first two years.

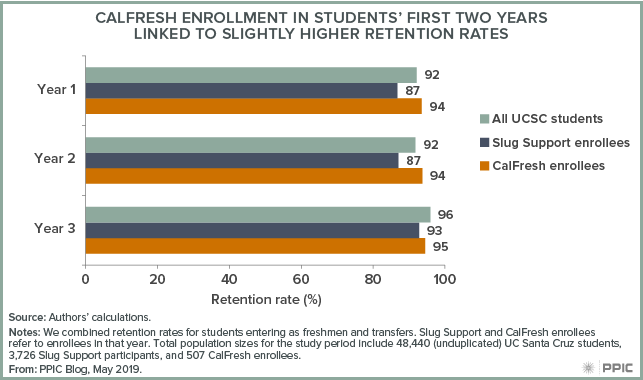
The first-year retention rate for Slug Support students (87%) is substantially lower than the overall retention rate at UCSC (92%), but CalFresh enrollees experienced a slightly higher-than-average first-year retention rate (94%). These results are especially encouraging as students who are eligible for CalFresh are socioeconomically disadvantaged and more likely to come from under-resourced high schools—characteristics typically associated with lower retention. This pattern persists for those enrolling in CalFresh their second year but wanes after that: students who wait to enroll in CalFresh until their third year have slightly lower retention rates than third-year UCSC students overall.

figure - CalFresh Enrollment in Students' First Two Years Linked to Slight Higher Retention Rates

Compared to Slug Support students who used other services but did not enroll in CalFresh, CalFresh enrollees were consistently more likely to return to campus the following fall. About a third (34%) of UCSC students are EOP-eligible—and therefore now eligible for CalFresh—suggesting that recent legislative changes have the potential to greatly improve food security and student outcomes.

Governor Newsom’s revised budget for 2019–20 allocates $18.5 million to address hunger and housing in the UC system. To build upon recent efforts, policymakers and higher education leaders should consider additional mechanisms to support access to CalFresh—such as tracking CalFresh enrollment among eligible students, confirming students are aware of their eligibility, and streamlining the enrollment process. These steps could help further ensure that California students have access to the resources that will help them complete their degrees.

Brandon Balzer Carr is a doctoral candidate in psychology at UC Santa Cruz. Rebecca London is an adjunct fellow at PPIC and an assistant professor in sociology at UC Santa Cruz.

Interactive: A Look at Child Poverty across California

[vc_row][vc_column][vc_column_text]Governor Newsom’s first budget proposal included notable efforts to address poverty—especially child poverty—by increasing CalWORKs cash assistance grants, expanding assistance to low-income parents pursuing higher education, and further expanding the state’s Earned Income Tax Credit (CalEITC, which he proposed renaming the Working Families Tax Credit).

California has a troublingly high child poverty rate of 21.3%, or about 1.9 million children, according to our latest estimates from the California Poverty Measure (CPM). The CPM is a joint research effort between PPIC and the Stanford Center on Poverty and Inequality that, unlike official poverty metrics, takes into account the cost of living and benefits from social safety net programs.

While poverty rates in the state are also high, child poverty rates tend to be even higher, particularly in the most populous counties. For example, in Los Angeles County, 24.3% of all residents—but 27.8% of children—live in poverty. Altogether, 17 counties, 29 congressional districts, 21 senate districts, and 42 assembly districts have child poverty rates of more than about 20%.

State and federal policies play an important role in lowering child poverty. Our estimates indicate that over a third (35.3%) of children would be in poverty, were it not for programs like CalFresh food assistance, the federal and state Earned Income Tax Credits, and CalWORKs cash assistance. PPIC research also shows that new policies could reduce child poverty even further, although effects vary across the state. We will continue to track and analyze poverty and child poverty to provide this critical information to policymakers and stakeholders.[/vc_column_text][/vc_column][/vc_row][vc_row][vc_column][vc_raw_html]JTNDZGl2JTIwY2xhc3MlM0QlMjd0YWJsZWF1UGxhY2Vob2xkZXIlMjclMjBpZCUzRCUyN3ZpejE1NDc4MjcxODU1NTglMjclMjBzdHlsZSUzRCUyN3Bvc2l0aW9uJTNBJTIwcmVsYXRpdmUlMjclM0UlM0Nub3NjcmlwdCUzRSUzQ2ElMjBocmVmJTNEJTI3JTIzJTI3JTNFJTNDaW1nJTIwYWx0JTNEJTI3JTIwJTI3JTIwc3JjJTNEJTI3aHR0cHMlM0ElMjYlMjM0NyUzQiUyNiUyMzQ3JTNCcHVibGljLnRhYmxlYXUuY29tJTI2JTIzNDclM0JzdGF0aWMlMjYlMjM0NyUzQmltYWdlcyUyNiUyMzQ3JTNCQ2glMjYlMjM0NyUzQkNoaWxkUG92ZXJ0eWJ5Q2FsaWZvcm5pYUNvdW50eWFuZExlZ2lzbGF0aXZlRGlzdHJpY3RfMCUyNiUyMzQ3JTNCQ291bnRpZXMlMjYlMjM0NyUzQjFfcnNzLnBuZyUyNyUyMHN0eWxlJTNEJTI3Ym9yZGVyJTNBJTIwbm9uZSUyNyUyMCUyRiUzRSUzQyUyRmElM0UlM0MlMkZub3NjcmlwdCUzRSUzQ29iamVjdCUyMGNsYXNzJTNEJTI3dGFibGVhdVZpeiUyNyUyMCUyMHN0eWxlJTNEJTI3ZGlzcGxheSUzQW5vbmUlM0IlMjclM0UlM0NwYXJhbSUyMG5hbWUlM0QlMjdob3N0X3VybCUyNyUyMHZhbHVlJTNEJTI3aHR0cHMlMjUzQSUyNTJGJTI1MkZwdWJsaWMudGFibGVhdS5jb20lMjUyRiUyNyUyMCUyRiUzRSUyMCUzQ3BhcmFtJTIwbmFtZSUzRCUyN2VtYmVkX2NvZGVfdmVyc2lvbiUyNyUyMHZhbHVlJTNEJTI3MyUyNyUyMCUyRiUzRSUyMCUzQ3BhcmFtJTIwbmFtZSUzRCUyN3NpdGVfcm9vdCUyNyUyMHZhbHVlJTNEJTI3JTI3JTIwJTJGJTNFJTNDcGFyYW0lMjBuYW1lJTNEJTI3bmFtZSUyNyUyMHZhbHVlJTNEJTI3Q2hpbGRQb3ZlcnR5YnlDYWxpZm9ybmlhQ291bnR5YW5kTGVnaXNsYXRpdmVEaXN0cmljdF8wJTI2JTIzNDclM0JDb3VudGllcyUyNyUyMCUyRiUzRSUzQ3BhcmFtJTIwbmFtZSUzRCUyN3RhYnMlMjclMjB2YWx1ZSUzRCUyN3llcyUyNyUyMCUyRiUzRSUzQ3BhcmFtJTIwbmFtZSUzRCUyN3Rvb2xiYXIlMjclMjB2YWx1ZSUzRCUyN25vJTI3JTIwJTJGJTNFJTNDcGFyYW0lMjBuYW1lJTNEJTI3c3RhdGljX2ltYWdlJTI3JTIwdmFsdWUlM0QlMjdodHRwcyUzQSUyNiUyMzQ3JTNCJTI2JTIzNDclM0JwdWJsaWMudGFibGVhdS5jb20lMjYlMjM0NyUzQnN0YXRpYyUyNiUyMzQ3JTNCaW1hZ2VzJTI2JTIzNDclM0JDaCUyNiUyMzQ3JTNCQ2hpbGRQb3ZlcnR5YnlDYWxpZm9ybmlhQ291bnR5YW5kTGVnaXNsYXRpdmVEaXN0cmljdF8wJTI2JTIzNDclM0JDb3VudGllcyUyNiUyMzQ3JTNCMS5wbmclMjclMjAlMkYlM0UlMjAlM0NwYXJhbSUyMG5hbWUlM0QlMjdhbmltYXRlX3RyYW5zaXRpb24lMjclMjB2YWx1ZSUzRCUyN3llcyUyNyUyMCUyRiUzRSUzQ3BhcmFtJTIwbmFtZSUzRCUyN2Rpc3BsYXlfc3RhdGljX2ltYWdlJTI3JTIwdmFsdWUlM0QlMjd5ZXMlMjclMjAlMkYlM0UlM0NwYXJhbSUyMG5hbWUlM0QlMjdkaXNwbGF5X3NwaW5uZXIlMjclMjB2YWx1ZSUzRCUyN3llcyUyNyUyMCUyRiUzRSUzQ3BhcmFtJTIwbmFtZSUzRCUyN2Rpc3BsYXlfb3ZlcmxheSUyNyUyMHZhbHVlJTNEJTI3eWVzJTI3JTIwJTJGJTNFJTNDcGFyYW0lMjBuYW1lJTNEJTI3ZGlzcGxheV9jb3VudCUyNyUyMHZhbHVlJTNEJTI3eWVzJTI3JTIwJTJGJTNFJTNDJTJGb2JqZWN0JTNFJTNDJTJGZGl2JTNFJTIwJTIwJTIwJTIwJTIwJTIwJTIwJTIwJTIwJTIwJTIwJTIwJTIwJTIwJTIwJTIwJTNDc2NyaXB0JTIwdHlwZSUzRCUyN3RleHQlMkZqYXZhc2NyaXB0JTI3JTNFJTIwJTIwJTIwJTIwJTIwJTIwJTIwJTIwJTIwJTIwJTIwJTIwJTIwJTIwJTIwJTIwJTIwJTIwJTIwJTIwdmFyJTIwZGl2RWxlbWVudCUyMCUzRCUyMGRvY3VtZW50LmdldEVsZW1lbnRCeUlkJTI4JTI3dml6MTU0NzgyNzE4NTU1OCUyNyUyOSUzQiUyMCUyMCUyMCUyMCUyMCUyMCUyMCUyMCUyMCUyMCUyMCUyMCUyMCUyMCUyMCUyMCUyMCUyMCUyMCUyMHZhciUyMHZpekVsZW1lbnQlMjAlM0QlMjBkaXZFbGVtZW50LmdldEVsZW1lbnRzQnlUYWdOYW1lJTI4JTI3b2JqZWN0JTI3JTI5JTVCMCU1RCUzQiUyMCUyMCUyMCUyMCUyMCUyMCUyMCUyMCUyMCUyMCUyMCUyMCUyMCUyMCUyMCUyMCUyMCUyMCUyMCUyMGlmJTIwJTI4JTIwZGl2RWxlbWVudC5vZmZzZXRXaWR0aCUyMCUzRSUyMDgwMCUyMCUyOSUyMCU3QiUyMHZpekVsZW1lbnQuc3R5bGUud2lkdGglM0QlMjcxMDAlMjUlMjclM0J2aXpFbGVtZW50LnN0eWxlLmhlaWdodCUzRCUyOGRpdkVsZW1lbnQub2Zmc2V0V2lkdGglMkEwLjc1JTI5JTJCJTI3cHglMjclM0IlN0QlMjBlbHNlJTIwaWYlMjAlMjglMjBkaXZFbGVtZW50Lm9mZnNldFdpZHRoJTIwJTNFJTIwNTAwJTIwJTI5JTIwJTdCJTIwdml6RWxlbWVudC5zdHlsZS53aWR0aCUzRCUyNzEwMCUyNSUyNyUzQnZpekVsZW1lbnQuc3R5bGUuaGVpZ2h0JTNEJTI4ZGl2RWxlbWVudC5vZmZzZXRXaWR0aCUyQTEuNzclMjklMkIlMjdweCUyNyUzQiU3RCUyMGVsc2UlMjAlN0IlMjB2aXpFbGVtZW50LnN0eWxlLndpZHRoJTNEJTI3MTAwJTI1JTI3JTNCdml6RWxlbWVudC5zdHlsZS5taW5IZWlnaHQlM0QlMjc3NTBweCUyNyUzQnZpekVsZW1lbnQuc3R5bGUubWF4SGVpZ2h0JTNEJTI4ZGl2RWxlbWVudC5vZmZzZXRXaWR0aCUyQTEuNzclMjklMkIlMjdweCUyNyUzQiU3RCUyMCUyMCUyMCUyMCUyMCUyMCUyMCUyMCUyMCUyMCUyMCUyMCUyMCUyMCUyMCUyMCUyMCUyMCUyMCUyMCUyMHZhciUyMHNjcmlwdEVsZW1lbnQlMjAlM0QlMjBkb2N1bWVudC5jcmVhdGVFbGVtZW50JTI4JTI3c2NyaXB0JTI3JTI5JTNCJTIwJTIwJTIwJTIwJTIwJTIwJTIwJTIwJTIwJTIwJTIwJTIwJTIwJTIwJTIwJTIwJTIwJTIwJTIwJTIwc2NyaXB0RWxlbWVudC5zcmMlMjAlM0QlMjAlMjdodHRwcyUzQSUyRiUyRnB1YmxpYy50YWJsZWF1LmNvbSUyRmphdmFzY3JpcHRzJTJGYXBpJTJGdml6X3YxLmpzJTI3JTNCJTIwJTIwJTIwJTIwJTIwJTIwJTIwJTIwJTIwJTIwJTIwJTIwJTIwJTIwJTIwJTIwJTIwJTIwJTIwJTIwdml6RWxlbWVudC5wYXJlbnROb2RlLmluc2VydEJlZm9yZSUyOHNjcmlwdEVsZW1lbnQlMkMlMjB2aXpFbGVtZW50JTI5JTNCJTIwJTIwJTIwJTIwJTIwJTIwJTIwJTIwJTIwJTIwJTIwJTIwJTIwJTIwJTIwJTIwJTNDJTJGc2NyaXB0JTNF[/vc_raw_html][/vc_column][/vc_row]

Federal Immigration Proposal Could Have Widespread Impact

The Department of Homeland Security (DHS) has recently proposed changing how it decides whether a person is or will likely become dependent on government assistance. If implemented, this change would make it harder for immigrants to meet the government’s standard of self-sufficiency—and may deter them and others from using government services for which they are eligible. Through December 10, DHS is requesting public comments on the proposal, which could potentially have wide-ranging impacts on California and its large immigrant population.

The federal government can typically deny applications for green cards or entry into the United States to people who are or will likely become “public charges,” i.e., dependent on government assistance. Under current guidance, DHS considers an immigrant a public charge if they receive more than half of their income from cash assistance—which includes TANF (known as CalWORKs in California), General Assistance (GA), and Supplemental Security Income (SSI)—or are in government-funded, long-term institutional care (like a nursing home).

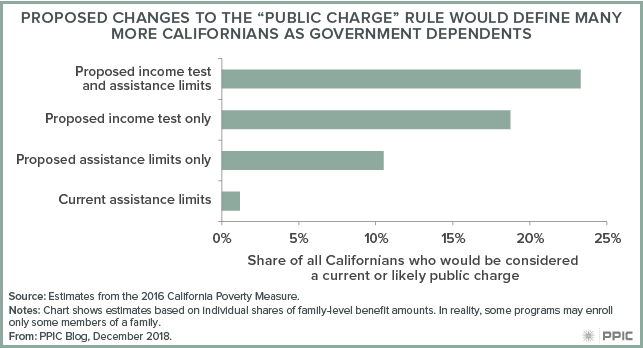
The proposed rule is much broader: it defines dependence as receiving more than about $1,800 (for 2018) in assistance from not only the current programs but also the food assistance program SNAP (CalFresh) and/or Section 8 housing vouchers and rental assistance. DHS also proposes that an income of less than 125% of the federal poverty level ($25,100 in 2018 for a family of four) would be a strong predictor of becoming a public charge and recommends length of enrollment in certain health programs as another factor to consider.

How big of a change is this? While data aren’t available to examine safety net participation among the noncitizens whose immigration cases would be affected by the rule, we estimate that even before including health programs, as many as 23% of all Californians would be considered public charges, or likely to become so—which gives a sense of how broad the proposed rule is. Some 18.7% of Californians would be considered likely to become public charges based on their income level alone. By contrast, at most 1.2% of all Californians receive more than half their income from CalWORKs, GA, and SSI, and would be considered public charges under the current rule. These calculations are based on the California Poverty Measure (CPM), a joint effort of PPIC and the Stanford Center on Poverty and Inequality.

California has more immigrants than any other state—and hence much at stake. For those on visas, the proposed rule would make it harder to qualify for a green card or extend their stay. But in practice, the largest impact would likely be on immigrants and their families who, purely out of caution, forego safety net benefits for which they are eligible. DHS cites this sort of disenrollment as a source of long-term savings—but notes that these savings are liable to be offset by worse public health outcomes and increased poverty rates. Based on studies of welfare reform in the 1990s, the UCLA Center for Health Policy Research estimates that if the rule change takes place, 15% to 35% of families with noncitizens might disenroll from safety net programs. At the high end, as many as 765,000 people could disenroll from CalFresh and Medi-Cal, leading to around $1 billion less in federal aid to California each year.

California’s attorney general and some local governments have already voiced their opposition to the proposed changes, which come at a time when the state has been expanding access to health and social safety net programs. Reduced participation in these programs, whether from reasonable or unnecessary caution, would directly counteract the state’s efforts to reduce poverty. Public comment for the proposal closes on December 10.

1 in 4 Child Care Workers in California Lives in Poverty

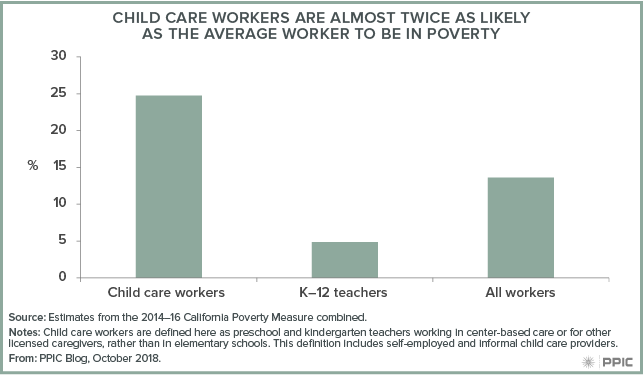
While preschools and child care providers in many parts of California are straining to fill a unmet need, the state’s child care workers are poorly paid and almost twice as likely to live in poverty than workers overall.

California’s child care workers earn significantly less than their school-based counterparts. Given that about 95% of child care workers not based in schools are women, and 53% are African American or Latina (compared with 43% of the overall workforce), women—particularly women of color—are most affected by low pay in the child care workforce.

UC Berkeley found that in 2017, the median hourly wage for child care workers in California was $12.29—just one-third the median wage for kindergarten teachers. Earnings among child care workers track more with low-wage workers across California (defined as those earning less than two-thirds of the median wage). These low wages translate to about a quarter of child care workers living in poverty as compared to 14% of all working adults (ages 18-64)—according to the California Poverty Measure, developed by PPIC and the Stanford Center on Poverty and Inequality.

Low wages are just one piece of the poverty puzzle. Relative to all working adults, child care workers are more likely to have only part-time work (more than a third, compared with less than a quarter of the overall workforce), which is associated with dramatically higher poverty rates than full-time employment. Many have completed some college credit or have an associate’s degree (44%), but just a fifth have a four-year degree, in a workforce where more than a third of working adults have four-year degrees. And while people working in child care are as likely to have children as the average working adult, those who do are more likely to be parenting alone (11%) than the average worker (6%).

The social safety net is an important part of helping child care workers make ends meet. Half of all child care workers benefit from at least one safety net program or tax credit, with the two largest being CalFresh (25%) and the federal Earned Income Tax Credit (37%). Without this assistance, poverty among child care workers would be even higher—2.5 points higher without the Earned Income Tax Credit, and 2.1 points without CalFresh. Minus all major safety net programs, one in three child care workers would live in poverty.

Recent policy changes could start to boost incomes for child care workers. Expanded eligibility for 18–24-year-olds for the state’s new Earned Income Tax Credit, starting in 2019, will specifically help the 20% of the workforce who are under 25. Steady increases in California’s minimum wage could improve earnings of child care workers employed by providers subject to minimum wage laws. Yet many workers are self-employed, providers often operate with limited incomes, and the cost of care itself is already high for low-income families. Minimum wage increases will likely result in a better-paid child care workforce only if they are accompanied by sector-wide changes aimed at making child care both affordable and accessible.

The needs of child care workers will affect efforts to improve and expand California’s complex child care system. While the state and federal governments have begun to increase access to child care with expanded programs and additional funding, improving living standards for child care workers will be a major challenge for California’s next governor.

The Federal Farm Bill Could Affect CalFresh

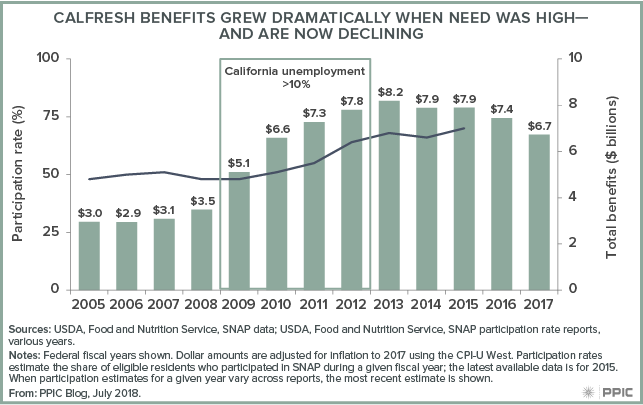
The federal Farm Bill is due for reauthorization in Congress, but its fate is still uncertain—Senate and House versions differ substantially. The largest share of spending in—and the most contentious aspect of—the bill is the Supplemental Nutrition Assistance Program (SNAP), known as CalFresh in California. CalFresh is the state’s main food assistance program, helping nearly 4 million Californians afford groceries each month. The Senate bill leaves net SNAP funding largely unchanged. The House bill would trim costs significantly, in part by revamping work requirements and limiting state flexibility in setting eligibility guidelines. These changes, which would reduce the number of program recipients, are being proposed at a time when the SNAP caseload is declining nationwide, after growing substantially during and after the Great Recession.

In California, policymakers have focused in recent years on getting more eligible Californians enrolled in CalFresh—the state had the lowest participation rate in the nation for a number of years. The share of those eligible who received benefits grew from about 50% to 70% between 2009 and 2015 (the most recent estimate)—but this improved participation rate is still near the bottom. Nonetheless, the California Poverty Measure estimates that CalFresh benefits kept more than 800,000 residents out of poverty in 2015.

Even as participation rates have been rising, decreases in demand are causing CalFresh benefit costs to fall—from $7.4 billion to $6.7 between 2016 and 2017 alone. Whether or not federal policies change, program costs are likely to continue to fall in the next year—unless the state enters a recession and the need for food assistance rises.

Federal Funds and California’s Budget

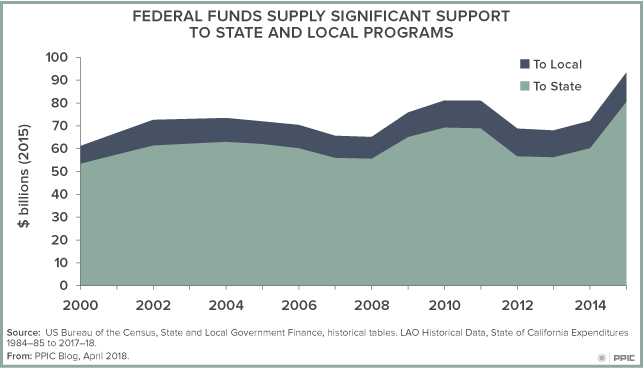
California receives a lot of direct funding—more than $100 billion—from the federal government. Should federal officials make changes to the programs that provide these funds, the state would feel the impact quickly, with the most vulnerable Californians bearing the brunt. As lawmakers begin to work on the state budget in earnest, there is less certainty surrounding the contribution of federal funds than in prior years.

Governor Brown’s current budget proposal estimates that federal support will contribute about $106 billion dollars to state and local programs (a large share of the funds “pass through” state departments and are distributed to counties, school districts, and other entities). That would represent a record amount.

In the past, federal revenue to California hovered between $70 and $80 billion. After implementation of the Affordable Care Act (also known as Obamacare), the total level of federal assistance to the state rose beyond the $100 billion mark—mainly because of the expansion of Medi-Cal.

Though it is the largest, Medi-Cal isn’t the only state program that relies on the federal government for a significant share of total revenue. From CalTrans to the California Department of Education, billions of federal dollars provide support for state and local efforts.

Today, relying on that federal revenue could be hazardous. The Trump administration and congressional Republicans have expressed an interest in making significant changes to key programs. For instance, food stamps—known by its federal moniker as Supplemental Nutrition Assistance Program (SNAP) and as CalFresh here in California—may look very different over time. Trump’s proposal limits the ability of recipients to choose which foods they can purchase, claiming that these limitations will save money. These purported savings underpin a proposed 30% overall cut to the program over the next decade.

Should funding for these programs be cut, California—as the nation’s largest state—would bear the greatest dollar reduction. And the state’s poorest would feel the greatest impact. PPIC research has found that the state’s social safety net programs often spell the difference between being in or out of poverty for hundreds of thousands of residents. For example, CalFresh moves 800,000 people out of poverty.  The impact of CalWORKs—the state’s welfare program—is smaller, but significant (400,000 moved from poverty). The effect of funding reductions today could be amplified in the next recession, when unemployment rises, incomes fall, and more people seek these benefits.

In the past, California, like other states, could look to the federal government as a reliable source of revenue for many of its programs, especially those making up the social safety net. In fact, the federal government has even served as a partial fiscal buffer during economic downturns, increasing spending when state generated revenues fell. The state, however, cannot take the level of federal support as a given and, for now, will have to navigate in an environment of fiscal uncertainty, particularly with regard to programs that serve the poor. In this budget building season, state leaders will need to consider how best to cope with the possibility of reduced federal assistance in the immediate future.

Testimony: Safety Net Plays Key Role in Reducing Poverty

Sarah Bohn, research fellow at the Public Policy Institute of California, testified today, February 14, 2018, before the Senate Budget and Fiscal Review Committee, Informational Hearing on Human Services. The topic of today’s hearing: poverty and social safety net programs. Here are her prepared remarks.

Poverty is high in California, and it has not improved as much as the economy has in recent years. In fact, California’s poverty rate is highest in country, according to our estimates. Throughout this presentation, I will rely on the California Poverty Measure research (a joint effort between PPIC and Stanford) that accounts not only for earnings but also for benefits from major safety net programs and the cost of housing to give a comprehensive, accurate, and state-specific account of the resources families have on hand to meet their basic needs.

We find that 19.5% of Californians were poor as of 2015—that means 7.5 million people living below a basic needs threshold (less than $30,000 in total resources for a family of four). The poverty rate is slightly higher for children at 21.6%. In addition, 5.5% of Californians are in deep poverty—which means they have less than half of what it takes to meet basic needs, or about $15,000 annually for a family of four. Overall, the share of Californians in poverty remains higher than it was before the last recession started and is relatively high by historical standards.
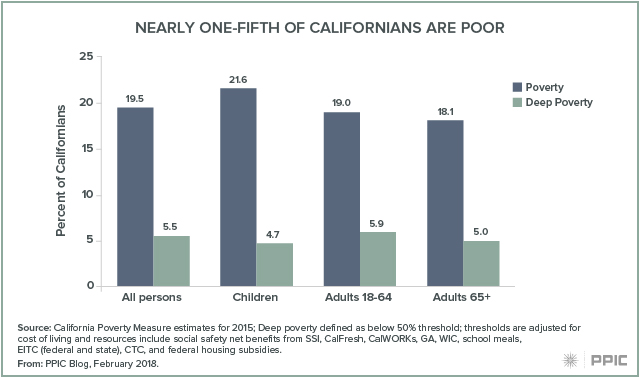
To understand why, providing a long-term picture of how all Californians have fared is helpful. For the bottom half of California families, income has been quite stagnant for at least the past three decades. The bottom 10% are earning less than they were in 1980 (about $20,000) and the bottom 20% are earning just 4% more.  Compare that to the top 10%, which are earning 54% more than they did in 1980.  Much of this is driven by how economic opportunities (especially in the labor market) have changed and polarized – generating both high rates of poverty and high income inequality.
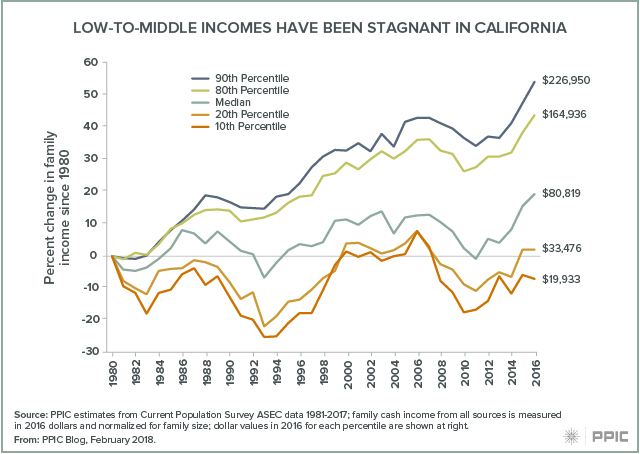
How does this relate to the safety net? With stagnant earnings since 1980, safety net resources become an even more important factor in making ends meet as cost of living increases. Our estimates show that major safety net program benefits play a critical role in mitigating poverty. The California poverty rate would be 8 points higher were it not for these programs—that means an additional 3.1 million Californians would be in poverty. The deep poverty rate would more than double were it not for the safety net.
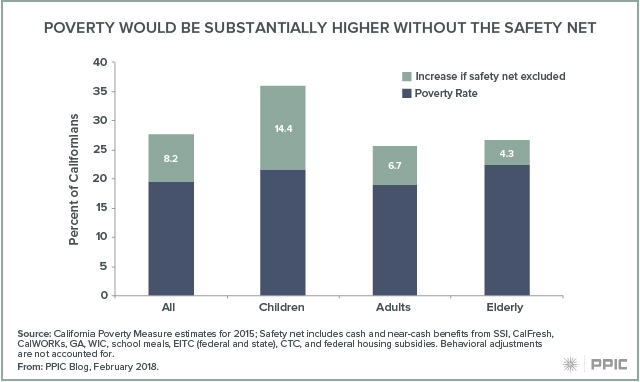
Looking specifically at CalFresh, CalWORKs, and SSI—the programs we’re focusing on today—we estimate that a large number of Californians are moved out of deep poverty or poverty because of the program benefits they or their family members receive.
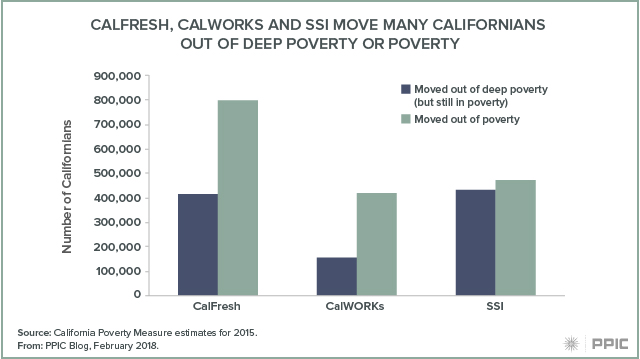
Specifically, CalFresh moves 400,000 people out of deep poverty; 800,000 are moved out of poverty.  The numbers are a bit smaller for CalWORKs families (150,000 from deep poverty and 400,000 from poverty), in part because the program reaches fewer families. And finally, SSI moves about 400,000 out of deep poverty and about the same number out of poverty. Keep in mind that families on these programs may be far from the poverty line, so even if they are not technically moved out of poverty, program resources can still be an important way for them to meet basic needs. Families may also benefit from multiple programs in combination.

The safety net plays a critical role in helping make ends meet but income from work is still the biggest component of family resources, even for families in poverty. And as we saw over the long term, the trend in income alone is not positive for families in the bottom half of the income distribution. So in addition to helping families manage in the short term, ideally social safety net programs could contribute to mobility over the long term, counteracting the trend in income inequality. However, one factor limiting the potential impact of safety net resources is the high cost of living in California, driven mostly by housing but also other living expenses like child care and medical costs.

After we consider these other expenses, we end up with poverty rates that are high compared to other states and high within and across California as well.  This is what the poverty looks like across a number of demographic characteristics.
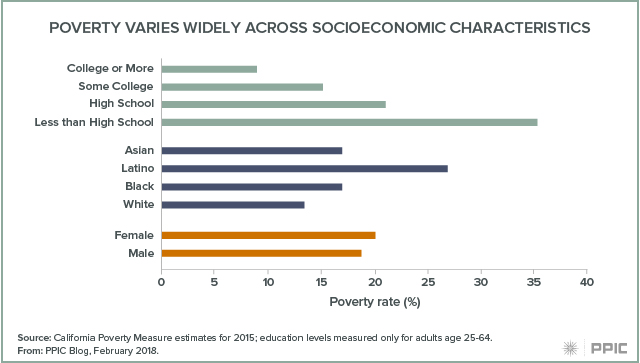
You’ll notice that the incidence of poverty varies the most across education levels (and here we’re only looking at adults age 25–64 who’ve had enough time to acquire education). Men and women are about equally likely to be in poverty. Latinos in California are twice as likely to be poor as white residents (27% vs. 13%), and black and Asian residents fall in between.

Across the state, poverty varies considerably. The highest rate is in Los Angeles, at 25% (with Santa Cruz and Santa Barbara close behind). The lowest is in Placer County at 13% (nearby Sierra counties of Alpine, Mariposa, and others have similar rates).
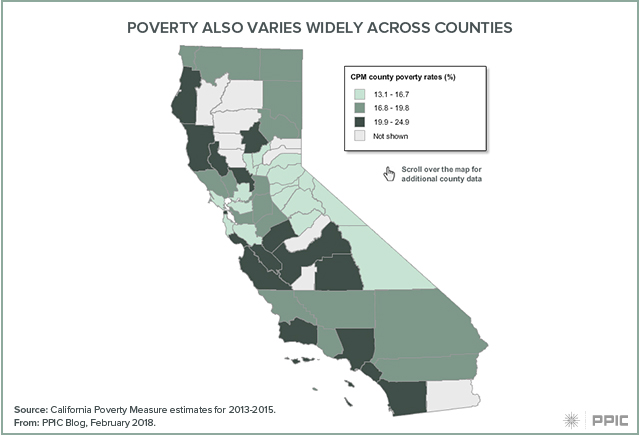
As we all see day to day, poverty is concentrated much more narrowly than at the county level—sometimes it varies neighborhood to neighborhood. In fact, we find that the highest and lowest rates of child poverty in the state are in neighborhoods of Los Angeles that are just 20 to 30 miles apart. Similar differences can be seen in neighborhoods across the Silicon Valley. The concentration of poverty raises concerns that there are other factors about places—beyond just income level—that diminish the chances for residents to get ahead.
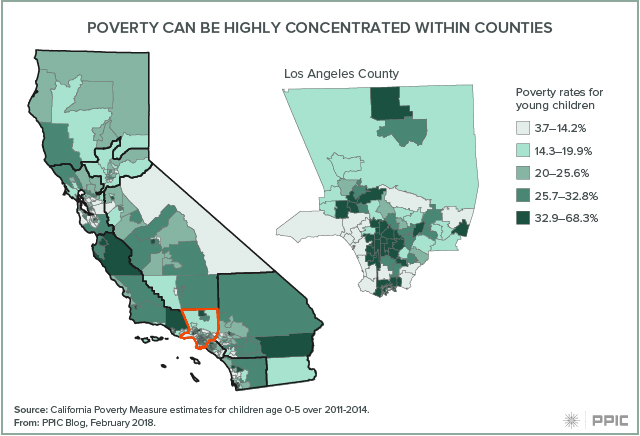
This map is surprising because it does not track one-for-one with unemployment or other economic indicators. Access to good-paying jobs is the number one factor in preventing poverty. But it is not sufficient because the cost of living (housing, child care) looms large—and those expenses tend to be higher in exactly the places where unemployment is lower and wages higher, making it hard to make ends meet even with a full-time job. High living expenses coupled with the long-term stagnation in low to middle incomes yields the high rates of poverty we see today even with very low unemployment rates.

In this context it is critically important to be aware of the role social safety net programs play in helping Californians make ends meet—as I mentioned the poverty rate would be 40% higher were it not for major means tested programs in California.  Nonetheless, California has the highest poverty rate in the country—even with a booming economy—so it is exactly the right time to discuss where the safety net falls short and what needs to be done.

Examining the Federal EITC’s Impact on Poverty

The federal Earned Income Tax Credit (EITC) plays an important role in keeping Californians out of poverty. The credit supplements earnings for low-income workers at tax time, providing $2,400 on average to qualified tax filers.

Without the EITC, we estimate an additional 814,000 Californians would live in poverty, according to the latest data from the California Poverty Measure (CPM), an ongoing collaboration between PPIC and the Stanford Center on Poverty and Inequality. This reduction in poverty makes the EITC nearly comparable to CalFresh (formerly known as food stamps), the safety net program that keeps the most Californians out of poverty. Our estimates reflect data from 2013 to 2015 and do not include the state EITC, which was introduced in 2015 and expanded in 2017. The state EITC lowers poverty by very little because the largest credits go to workers with very low earnings, whose families mostly live well below the poverty line.

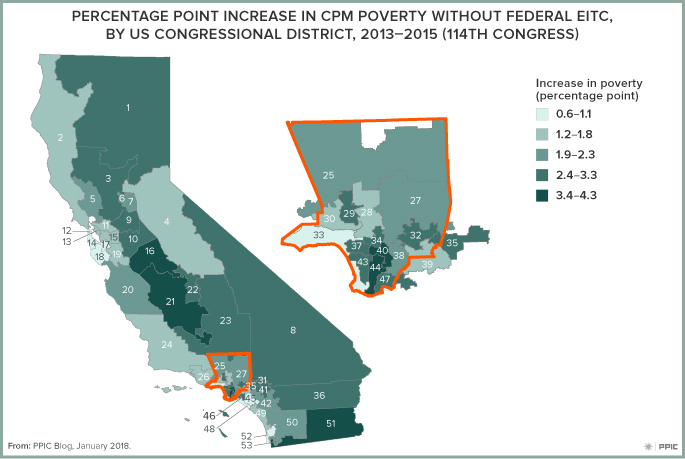
The role that the EITC plays varies widely across regions. Statewide, the poverty rate would be 2.2 percentage points higher without the EITC (22.6% instead of 20.4%). But in Lake and Mendocino Counties (combined), the poverty rate without the EITC would be 4.1 percentage points higher than it is currently, reaching 26.8%. Poverty in Marin County, on the other hand, would increase only 0.2 points, to 16.5%. Such differences could be due to several factors—for example, the share of eligible families who take advantage of the credit and the local availability of jobs.

PPIC recently released data showing poverty rates, poverty thresholds, and the effects of safety net programs not only by county, but also by state assembly and senate district and by US congressional district. These data provide an opportunity to dig more deeply into the varying roles of safety net programs across the state.

The EITC, for example, has the largest effect in some of the highest-poverty congressional districts, including District 40 (Rep. Roybal-Allard) and District 44 (Rep. Barragán). But in some relatively high-poverty districts it plays a smaller role (District 46, Rep. Correa). The data we provide can be a starting point for investigating—and potentially remedying—incomplete access to the EITC.