Is the Decline in the Humanities Overstated?

While there has been a strong increase in STEM degrees awarded at California colleges and universities over the past 16 years, many have noted a decline in student interest in the humanities. Colleges have adjusted their offerings to reflect changes in student demand, and some observers have questioned whether liberal arts colleges can sustain their enrollments in the face of diminishing student interest.

In California, the real story is not one of outright declines in humanities majors but a lack of growth compared to other majors. The number of students earning a bachelor’s degree in the humanities in California increased from just over 26,000 in 2000 to almost 38,000 in 2006. It has since declined—but only slightly—to 35,000. This pattern is widespread, with the University of California (UC), the California State University (CSU), and the state’s private nonprofits all experiencing sharp increases from 2000 to 2006 and slight declines since that time. Because other degrees have continued to increase, the share of degrees awarded to humanities majors has declined noticeably—from 27% in 2006 to 19% in 2016.

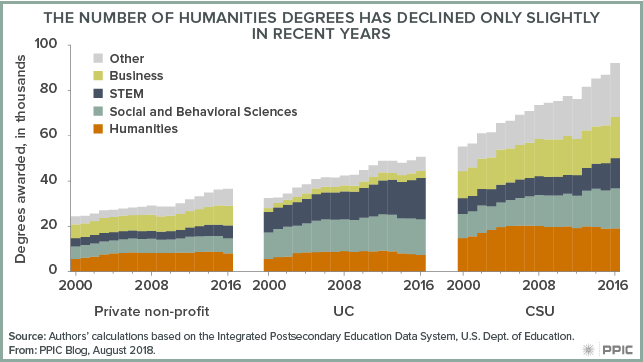
Humanities majors make up a larger share of students at private nonprofit colleges and CSU than at UC, but there is wide variation across campuses. At Cal Tech (the California Institute of Technology) only 0.8% of bachelor’s degrees were awarded in the humanities in 2016, whereas at Biola and Chapman Universities humanities degrees made up almost 40%. At CSU only 9% of degrees at Cal Poly San Luis Obispo were in the humanities (just 1% at Cal Maritime were), compared to 28% at Cal State Channel Islands. And at UC only 4% of UC Merced students earned a humanities degree, compared to 22% at UC Santa Barbara.

These patterns and trends suggest that the decline of the humanities is overstated, at least for now. But there are indications that these trends will persist. Economic returns tend to be higher for students in STEM than in the humanities, and students are increasingly citing job prospects as the primary reason they enroll in college. The College Board reports that among the newest college-bound students in California, only 9% expressed an interest in majoring in the humanities. Going forward, colleges and universities that emphasize the humanities will need to make the case (and it can be made) for the value of those degrees.

2020 Census: Counting the San Joaquin Valley

The decennial census plays an essential role in American democracy. The stakes are huge for California, and 2020 is fast approaching. This series of blog posts takes a detailed look at California communities that may be at risk of being undercounted.

PPIC’s new interactive census maps are an important tool for Californians working to ensure an accurate census count. Using estimates from the Census Bureau and the Federal Communications Commission, they highlight hard-to-count communities across the state and pinpoint reasons why certain areas may be hard to reach.

Home to 4.3 million people, the San Joaquin Valley may be one of California’s hardest-to-count regions in 2020. Encompassing about 11% of the state’s population, the valley runs south from San Joaquin County through Stanislaus, Merced, Madera, Fresno, Tulare, Kings, and Kern Counties. Most of the communities at risk of being undercounted in the region live south of Stanislaus County through Kern County. For example, 33% of census tracts in Fresno County are likely to be very hard to count, according to Census Bureau estimates that draw on demographic characteristics and historical trends. But only 7% of tracts in Stanislaus are very hard to count. Households in these very hard-to-count areas are less likely to respond initially to census forms and are therefore at risk of being undercounted.

Some highlights:

  • An undercount could reshape the legislative landscape of the San Joaquin Valley. Since legislative district lines will be redrawn based on the census, disproportionately undercounting parts of the San Joaquin Valley could reshape the region’s political representation. And while hard-to-count communities are distributed across several counties in the region, they are concentrated in fewer legislative districts. In Congressional Districts 16 (Costa) and 21 (Valadao), for example, about 42% of census tracts are likely to be very hard to count. Undercounting could also affect the northern San Joaquin Valley, which has hard-to-reach areas despite having fewer historically undercounted populations.
  • Undercounting people of color and noncitizens could disproportionately affect legislative districts in the central and southern San Joaquin Valley. This area has particularly high shares of groups that tend to be undercounted in the census—African Americans, Latinos, and Native Americans, as well as noncitizens, who may be even less likely to respond in 2020 due to the planned addition of a citizenship question. A total of six legislative districts have populations that are at least 65% African American, Latino, or Native American and at least 15% noncitizen: Congressional Districts 16 and 21; State Senate Districts 12 (Cannella) and 14 (Vidak); and State Assembly Districts 31 (Arambula) and 32 (Salas).
  • Another factor driving the San Joaquin Valley’s overall risk of being undercounted is the high share of young children. Young children are historically underrepresented in the census. There are particularly high concentrations of families with young children in the central and southern San Joaquin Valley: children under 5 years old make up 8% or more of the population in Fresno, Kern, Kings, Merced, and Tulare Counties—among the highest concentration in the state.
  • Housing conditions may make an accurate count especially challenging in the western San Joaquin Valley. In this area, relatively large shares of housing units are rentals, overcrowded rentals, and/or mobile homes—all of which can make residents harder to find and count accurately. For example, more than 20% of households live in mobile homes in some northwestern parts of San Joaquin County and some southwestern parts of Tulare County.
  • Limited internet access may be an issue in certain areas throughout the region. The Census Bureau plans to collect the majority of responses online in 2020—a change from previous practice. Each county in the San Joaquin Valley has some census tracts with minimal residential high-speed connectivity, with the lowest access outside cities. While people in these areas may have internet access through smartphones or public libraries, in general they may have more trouble accessing the census online.

We hope these maps serve as a starting point to help local, regional, and state leaders think about which activities, resources, and partnerships—including language assistance, awareness raising, and community outreach—might be most effective for accurately counting different parts of California. Stay tuned for future posts that examine hard-to-count communities in other regions of the state.

Video: A Conversation with Candidates for State Superintendent of Public Instruction

As part of our Speaker Series on California’s Future, PPIC is inviting all major candidates in selected statewide races to participate in public conversations. The purpose is to give Californians a better understanding of how candidates would approach the challenges facing our state.

In November, Californians will elect a new superintendent of public education. Education is by far the largest state spending area, and California’s public K–12 system—which educates more than 6 million children—is critical to the state’s future. What are the top priorities of the two candidates and what are their visions for California’s schools? PPIC president Mark Baldassare talked to Tony Thurmond, a member of the state assembly, and Marshall Tuck, a school improvement director, about how they would approach the job.

The candidates largely agreed on the need to increase state education funding and the importance of improving outcomes for low-income students, English Learners, and foster youth. Both are strong advocates for universal preschool. And both stressed the need to prepare all students not just for college and careers but also for civic engagement.

After noting that California currently ranks near the bottom among all states in per pupil funding, Tony Thurmond promised to prioritize moving the state into the top ten within his first four years—and to “take us to number one within eight years.” To help close achievement gaps, he would expand successful local approaches. He cited the Freedom School, an Afro-centric literacy program, and Footsteps to Brilliance, which focuses on immigrant families, as models.

Marshall Tuck emphasized the need to “start with equity.” His first priority would be to change the current funding policies to make sure state funding gets to kids with the greatest need. He would also work to streamline the state education code in order to “unlock the creativity of teachers and principals.”

While they agreed on many issues, Thurmond and Tuck emphasized differences in their backgrounds, each arguing that his experience makes him the better candidate.

Tuck argued that, while money is important, “implementation is key,” and cited his experience implementing successful policies in Los Angeles. After noting that the system has not been working, he argued that the next superintendent should be an education professional who can “fundamentally change the way we are approaching public education.”

Thurmond noted that the superintendent needs to be able to work with the county superintendents, the legislature, and the governor. He outlined his experience as an elected official and educator, as well as his “lived experience” as a student in California public schools—an experience, he said, that demonstrates how “education can save lives.”

Connecting Water Systems for Safe Drinking Water

Although most Californians have safe drinking water supplies, pockets of unsafe or inadequate water remain in parts of the state. Persistent water quality challenges mostly affect smaller, economically disadvantaged rural communities. About 90% of the affected water systems distribute water to fewer than 3,300 people each; most are very small, serving fewer than 500 people. Some small communities also face water shortages because their wells went dry during the latest drought. Solutions are financially out of reach for many poor communities, which lack resources and economies of scale to pay for expensive new treatment and supply facilities.

However, the state is actively encouraging one solution: the consolidation of smaller systems into larger ones. Consolidation can occur physically, by extending service connections to these communities, or administratively, by sharing managerial resources. Both approaches can improve the reliability and quality of water in a cost-effective, long-term manner. A 2015 law gives the State Water Board authority to mandate mergers if necessary. There have been 11 mandatory consolidations since then and more are pending. Voluntary consolidations are also on the rise: since the beginning of 2017, there have been 72 mergers.

Although consolidations can reduce costs over the long run, they entail some up-front expenses. Financial assistance is available in the form of state bonds, revolving funds, and some federal programs. Proposed legislation would create a new source of funding (from a voluntary donation on water bills and fees on agricultural chemicals) that would also provide resources. Several state bonds approved over the past decade dedicate funds for this purpose, and Proposition 3 on this November’s ballot would allocate an additional $500 million for infrastructure improvements that ensure access to safe drinking water.

To receive state funding, a water system that plans to extend safe water to a disadvantaged community typically applies for grants that support planning and construction costs as well as technical assistance. The Drinking Water State Revolving Fund (DWSRF) has supported a number of successful consolidation projects, such as one in Sutter County, where four water systems—including an elementary school—had ongoing arsenic and nitrate violations. DWSRF grants, in addition to funds from Yuba City, were used to finance the connection to Yuba City’s public water system, giving 995 people access to clean and reliable drinking water.

Getting grants can be challenging. The application for planning and construction is a complex, multi-year process, and many small, disadvantaged communities lack the capacity to navigate the application process. The State Water Board, along with some local organizations and programs, are helping affected communities with this process. The State Water Board also offers financial incentives to larger water systems that voluntarily consolidate with these communities, but additional support may be needed to encourage more widespread participation in consolidation programs.

While there are sources to finance capital improvements, other important needs are currently overlooked, including support for operation and maintenance costs, protections against unaffordable water rates, and legal services for consolidation.

Drinking water vulnerabilities in disadvantaged rural communities could worsen with climate change, and more can be done to encourage and streamline the consolidation process. There is growing awareness and action around providing safe and reliable drinking water to all Californians. With dependable funding and a clear state-level action plan, this goal could be achieved in the near term.

Video: A Conversation with Congresswoman Nancy Pelosi

As part of our Speaker Series on California’s Future, PPIC is inviting elected leaders across the political spectrum to participate in public conversations. The purpose is to give Californians a better understanding of how our leaders are addressing the challenges facing our state.

House Democratic Leader Nancy Pelosi and PPIC president Mark Baldassare had a wide-ranging conversation in San Francisco on Wednesday. They focused on the relationship between California and the federal government in a number of areas, including economic and tax policy, immigration, health care, and environmental issues.

Not surprisingly, Pelosi’s take on the state-federal relationship differs from that of her Republican counterpart, Kevin McCarthy, who fielded virtually the same questions from Baldassare in mid-August. In her view, this is an unusual time: “We haven’t had a time where the president has so targeted a state, in tax policy, environmental policy, trade policy.” Californians need to know about the statewide impact of these policies, and their elected leaders need to “try to work as much as possible in a bipartisan way to withstand that.”

She criticized the new federal tax law for significantly increasing the national debt without promoting growth. In fact, she continued, one of the best ways to promote economic growth is to enact comprehensive immigration reform. Asked what this would look like, she cited the bipartisan immigration bill that the Senate passed several years ago as one possible model. She deplored the current “uncivilized, inhumane” policy of separating families at the border. But she argued that while Trump-era ICE policies need to be changed, abolishing ICE is “not the answer.”

Pelosi, who played a major role in the passage of the Affordable Care Act, described health care reform as a “pillar of health and economic security for America’s working families.” She also characterized health care as a major issue in the November midterm elections. “The cost of health care is a very major issue in people’s lives, so we want to work in a bipartisan way, wherever possible, to reduce those costs.”

While she is concerned that Congress is not doing enough to ensure the integrity of the midterm elections, Pelosi is excited about the number of women who are running. “When I went to Congress, there were 12 Democratic and 11 Republican women.” Now, she added, “the majority of the people in our caucus are women, people of color, LGBTQ [. . .] and we want more!”

Why does she want to be Speaker? The short answer: “None of us is indispensable, but I think I’m probably the best person for the job.”


Year-Round Support for Low-Income Students

This summer marked the first time in eight years that summer Pell Grants were available. A need-based award to low-income, first-time undergraduates, the federal Pell Grant promotes access to postsecondary education. A summer component means that eligible students can use their Pell Grants year-round and receive up to one and a half awards in one academic year. For example, a student with the maximum school-year award of $6,095 can now receive a summertime award of $3,047—the total Pell Grant for the year would be $9,412. Unlike a student loan, Pell Grants do not need to be repaid. Previous PPIC work suggests that the availability of summer Pell Grants not only expands summer course enrollment but may also increase retention rates and accelerate time to degree.

Who is likely to benefit from summer Pell Grants? Of all California students who received Pell Grants in 2016–17, more than 80% attended a public institution. Further, the California Community Colleges (CCC) enrolled the most Pell recipients of all California’s public institutions: about 60%. The California State University (CSU) and University of California (UC) systems enrolled 29% and 11% of recipients, respectively.

Many students at CCC who receive a Pell Grant also receive state aid, most commonly in the form of a California College Promise Grant tuition waiver. This year, the CCC tuition waiver covers summer enrollment fees as well. Applying the summer Pell Grant on top of the tuition waiver at CCC may enable students to cover significant non-tuition costs like housing, which is often a larger expense than tuition itself. The return of the summer Pell Grant makes year-round college attendance more affordable and enables students to make timely progress to their education goals.

Video: A Conversation with Congressman Kevin McCarthy

As part of our Speaker Series on California’s Future, PPIC is inviting elected leaders across the political spectrum to participate in public conversations. The purpose is to give Californians a better understanding of how our leaders are addressing the challenges facing our state.

House Majority Leader Kevin McCarthy and PPIC president Mark Baldassare had a wide-ranging conversation in Sacramento last week. They focused on the relationship between California and the federal government in several areas, including tax reform, immigration, health care, water policy, wildfire management, and fuel emissions standards.

When asked about the impact of the recently passed federal tax law on Californians, he emphasized the bigger economic picture. The focus, he said, should be on the overall Republican agenda and whether it inspires optimism about the future: “Do you feel better off? How many quarters of economic growth have you had?”

McCarthy criticized the state’s leadership for its “backwards thinking” on the gas tax and other issues, and its oppositional stance to the Trump administration. He also talked about the need for bipartisan compromise in Congress. “I try to work with everybody,” he said, citing the work he did with Senator Feinstein to pass “the first major piece of water legislation in quite some time.” He returned to this theme after the conversation was briefly interrupted by a pro-DACA demonstration, asking why we can’t “sit down and communicate with one another” and decrying “elected officials who stand up and say ‘Divide us, not unite us’.”

Nonetheless, he seemed confident about finding ways to address major issues. About immigration policy, he said “I think we’re going to solve this problem” in the next congressional session. Asked about the 2020 Census, he said that Congress is making sure there will be an accurate count. “It is a big job,” he added, “and this is always the big fear before a census—are we prepared for it?”

Finally, when asked why he wants to become Speaker of the House, he said, “I want to make sure a Republican can be Speaker,” so that the party can continue to enact its agenda. He went on to describe the electoral landscape leading up to the November midterms, offering up a key takeaway: “This will be the year of the woman.”

Managing Forests to Reduce Wildfire Risks

California’s record-breaking fires have prompted a serious public discussion on how to reduce the risk of extreme wildfires. At the core of the debate is the role of vegetation management to reduce fuels. Some argue that California is not doing enough to manage its forests and that more trees must be removed. Others are concerned that this approach could result in a weakening of important environmental protections.

Both perspectives are grounded in real concerns. That said, Californians need to find common ground, because the state is in the grip of a crisis fueled by a warming climate, drought, and decades of management practices that have resulted in extensive areas of unhealthy, overly dense forests. Identifying overlapping objectives can help move stakeholders beyond conflict toward ecologically sound forest management. Here are a few observations that might help advance the conversation.

  • There are no one-size-fits-all solutions. Devastating wildfires have occurred recently in oak woodlands, scrub and chaparral, and mixed-conifer forest. Fuel reduction tools like prescribed burning and mechanical thinning may reduce wildfire threats in some ecosystems but not others, depending in part on land use practices and the frequency of fire before and after people began changing the landscape. Improving public understanding about the applicability of each approach can help move the debate forward.
  • Where fuel reduction is a viable tool, we aren’t doing enough. It has been estimated that fuel reduction on US Forest Service (USFS) lands in the Sierra Nevada would need to increase two- to six-fold to meaningfully improve forest resilience. Cal Fire (the state’s fire protection and forest management department) and USFS have both pledged to dramatically increase the amount of fuel reduction over the next few years. First priority should be given to locations where all parties can agree on management actions.
  • Mechanical thinning and logging serve different purposes. Both approaches can reduce fire risk in the Sierra’s mixed-conifer forests, and both usually require heavy equipment, access roads, and expertise in forest dynamics. But they are different in intent and design. Mechanical thinning is a forest management tool for selectively reducing forest vegetation—including small trees, shrubs, and groundcover―that can fuel dangerous fires. It is designed to retain large fire-resistant trees and to create a mosaic of trees and openings as was once common. By contrast, most commercial logging operations are more like crop farming: they aim to harvest enough trees to maximize net returns while stewarding the land for future harvests. These approaches leave very different looking forests. The costs and benefits of each approach should be at the center of discussions about which to use where.
  • Expanding forest management doesn’t require dropping environmental protections. State and federal laws require evaluations of the impact of proposed forest management projects on air, water, and sensitive species. These projects can be accomplished under current rules, but it costs time and money. Dedicating additional federal resources to environmental compliance will enable an increase in the pace of management in national forests. Small private forest owners need help negotiating the permitting process.

California’s pioneering efforts to address climate change won’t solve the wildfire problems we face today. Forest management can have an immediate impact, and it can be implemented under existing environmental laws. Defining a common set of long-term objectives and working together to increase trust and transparency can help stakeholders and forest managers move past conflict to reconciliation on this critical issue.

A Long-term View of Higher Education Funding

Along with tuition, state General Fund allocations are the largest source of revenue for California’s public colleges and universities. Overall, the state’s largest General Fund expenditures are in two areas: K–12 education, which has increased in relative size over time, and health and human services, which has experienced slight long-term declines. Corrections, which used to receive a very low share of General Fund allocations, has seen strong growth and now rivals higher education.

For decades the share of the state’s General Fund budget allocated to higher education declined substantially, from 18.0% in 1976–1977 to 10.4% in 2012–13. However, this pattern has reversed in the past few years. Indeed, California’s recently enacted 2018–19 budget continues the gains seen in recent years, with the state’s public colleges and universities receiving 11.7% of General Fund allocations.

These recent increases (and previous declines) were not experienced equally across the state’s three public systems of higher education. Because the community colleges are a part of the Proposition 98 funding guarantee (enacted in 1988), they were protected from the severe funding cuts that were experienced by the University of California (UC) and the California State University (CSU) during the Great Recession and enjoyed sharp gains in revenue as the state’s economy recovered. In comparison, even with increases in recent years, UC and CSU General Fund allocations remain below levels seen in the early 2000s (even as they serve more students), and their share of state General Fund allocations remains at historic lows.

This current funding situation is attributable less to long-term policy choices than to structural components of the state budget. The relatively slow growth of state funding for UC and CSU stems partly from the fact that the systems can raise tuition when state funding is cut during economic downturns. This is clearly not an option for other functions of government, including health and human services, K–12 education, and the corrections system. Budget decisions encompass many competing goals, with difficult trade-offs and long-term impacts. Moving forward, California’s budget planning needs to incorporate long-term goals that lead to a safer, healthier, and more prosperous state.

Geographic Variation in Poverty across California

Each year, when we update the data on poverty in California, we remark on how widely poverty rates vary across counties. In Los Angeles County, 24.3% of residents are poor, compared with just 11.8% of those in El Dorado County, according to the California Poverty Measure (CPM). The CPM is a collaboration between PPIC and the Stanford Center on Poverty and Inequality that adjusts for regional housing costs and incorporates resources from major social safety net programs.

Our new interactive maps highlight the dramatic variation in poverty across counties and US congressional, state senate, and state assembly districts. Overall, the maps show high rates of poverty in coastal and southern California, and lower rates in the northern and Sierra regions. This pattern is driven by a variety of factors: poor families in coastal, urban regions can earn relatively higher incomes, but this is often outweighed by high costs of living and reduced eligibility for safety net programs. In contrast, high poverty rates inland and along the north coast are driven by low incomes and limited employment—despite substantial poverty reduction by the social safety net.

These maps allow leaders from counties—where social safety net programs are often implemented—and legislative bodies—where program funding is allocated—to learn more about poverty and the impact of the safety net in their region.

Legislative districts see even greater disparities in poverty than counties do. Across assembly districts, for example, poverty rates differ by more than 30 percentage points, ranging from 7.8% in Assembly District 16 (Baker, R) in eastern Contra Costa County to 40.7% in Assembly District 59 (Jones-Sawyer, D) in central Los Angeles. This range reflects differences in the number of counties and assembly districts, as well as the size of their populations. California has 80 assembly districts with roughly equal populations, so they represent more slices of the state—especially in urban, densely populated counties.

Comparing counties and legislative districts draws attention to the ways that boundaries can bring forth or obscure populations. In the Inland Empire (San Bernardino and Riverside) in southeastern California, county and state senate district lines show poverty rates below the state average of 19.8% from 2014–16, ranging from 18.2% to 18.9%. But state assembly and US congressional districts in that area have high poverty rates, ranging from 20.5% to 22.7%—and are adjacent to districts with much less poverty.

The maps provide a rich resource for learning about the geographic variation of poverty in California. Since the factors driving poverty vary across the state, effective approaches for reducing poverty may vary too, as our previous research on child poverty has shown. For additional detail, the maps allow users to download estimates on the impact of major social safety net programs on poverty in different regions.