Video: The Mood Before Election Day

The final PPIC Statewide Survey before the November election found Hillary Clinton leading Donald Trump by 26 points among California likely voters and Kamala Harris leading Loretta Sanchez by 22 points. It also found that majorities support measures to extend a tax increase on high incomes, increase cigarette taxes, and legalize marijuana. Research associate David Kordus presented these and other key findings at a briefing in Sacramento last week.

The survey also examined issues that are likely to linger past Election Day. It finds that Californians are divided on the direction of the state. Majorities say the nation is going in the wrong direction, and they express low levels of trust in the federal government. And most Californians say the two major political parties do such a poor job that a third major party is needed.

Learn more

Read the October PPIC Statewide Survey: Californians and Their Government
Visit the PPIC Statewide Survey website

Computer Science in California’s K–12 Schools

Assembly Bill 2329—just signed by the governor—requires the state superintendent of public instruction to convene an advisory panel to develop computer science standards for California’s public schools. A look at the current state of computer science education reveals that this effort will entail a number of challenges and opportunities.

More Students Than Ever Are Taking AP Computer Science Exams

In 2015, a record-high 7,254 students from California’s public schools took the AP computer science exam, an eightfold increase from 2004. Test participation has grown across major demographic groups. After adjusting for fluctuations in student enrollment, particularly in grades 11 and 12 when students typically take the exam, white and Asian students made the most progress, with participation rate up by 800% or more. Growth has been slower among African American (690%) and Latino students (550%).

Test Performance Has Improved for Most Racial/Ethnic Groups

Although increasing numbers of Latino students are taking the exam, passage rates for this group have declined. In May 2004, 44% of Latino exam takers passed, compared to 34% percent in 2015. Performance has improved modestly among Asian and white students. The trend for African American students is less meaningful, because very few of them took the exam (fewer than 50 African Americans took the test before 2013).

More Girls Are Taking Computer Science Exams

In 2015, 26% of AP Computer Science exam takers were female, up from 19% in 2004. Over time both girls and boys have seen an improvement in performance. The gender gap, after some fluctuations, has largely remained unchanged.

Few Schools Offer Computer Science Courses, and Quality Varies

Few schools statewide are offering computer science courses and many of the courses that are offered—popular classes such as computer literacy and computer lab—are not rigorous enough to prepare students for college and beyond. In addition, finding teachers, especially for rigorous computer science courses, remains a challenge. For instance, out of 1,601 high and K–12 schools in California, only 142 offered computer programming courses, half of which are not meeting UC/CSU entrance requirements (author calculation using 2014–15 data from the California Department of Education).

California’s new law is an important first step to expand computer science education across the state. A recently introduced K–12 computer science framework developed by a national coalition of states, districts, and computer science organizations may be helpful as California develops its own standards. At the same time, continuing gaps in performance and variation in course access and quality represent an ongoing challenge.

Learn more

Read the report Upgrading Technology Infrastructure in California’s Schools and the fact sheet “Digital Learning in California’s K–12 Schools”

Community College Placement: Lessons from North Carolina


This post is part of an occasional series examining how California can learn from policies in other states.

Every year, California’s community colleges identify the vast majority of entering students as not ready for college-level courses in math and English. Since these courses are required to earn a degree or transfer to a four-year college, students deemed underprepared are placed in developmental (also known as remedial or basic-skills) courses to prepare for college work. Placement has a profound effect on students’ college trajectory: most developmental education students never earn a degree or transfer.

Concerns about poor outcomes have led California’s community colleges to reexamine their assessment and placement policies. How do colleges currently assess and place students? Are too many students placed into developmental courses? At PPIC, we will examine this topic in the months ahead. Reforms in other states can also help inform upcoming changes in California.

Policy: Uniform Assessment Test and Cut Scores in North Carolina

Prior to 2013, the North Carolina Community College System (NCCCS) allowed a great deal of local autonomy in assessment and placement policies—similar to California’s community colleges today. NCCCS provided a list of permitted assessments, but each of the 58 colleges decided on the specific tests (e.g., Accuplacer, Compass, or Asset tests) and cut-off scores that determined students’ math and English placement. Local policymaking lets colleges take into account their course offerings—which can differ a great deal, especially at the developmental or pre-collegiate level—and the needs of the specific populations being served. But allowing individual colleges to determine placement rules inevitably leads to varying definitions of what it means to be college ready.

In 2012, research by the Community College Research Center at Columbia University found that placement tests were only weakly predictive of success in college courses at NCCCS and that high school records were as useful or better at predicting college-level course success. Beginning in 2013, NCCCS implemented several reforms that transformed its assessment and placement system: multiple measures, a customized diagnostic math assessment, and uniform placement rules. In addition, students achieving a minimum high school GPA or SAT/ACT score could enroll in college-level courses without having to take a placement test.

Policy Impact

There are a number of arguments for uniform assessment and placement policies: they can set a common definition of college readiness, align high school and college expectations, allow states to measure performance across colleges, and facilitate transfer between colleges in the same system.

Early evidence from Central Piedmont Community College in Charlotte, North Carolina, also suggests that systemwide assessment and placement reform can significantly increase the number of students directly enrolling in college-level math and English. At Central Piedmont, 54% of students enrolled directly into these courses in fall 2015, up from 36% in fall 2012. It also appears that more students were able to complete college courses with no significant changes in pass rates. As more data is collected and analyzed, it will be important to see if these promising findings hold for colleges across the system and for different student groups.

Lessons for California

As California’s community colleges plan to implement a common assessment, the system must balance centralized decision making and local autonomy as well as rigorous standards and broader access. There is mounting evidence that more consistent and broader access to college-level courses contributes to improved student progress and more equitable outcomes. But some research does suggest that these reforms could result in lower course pass rates. For this reason, broader access to college-level courses should be complemented by increased support for faculty and academic supports for struggling students.

Learn more

Read Higher Education in California: Improving College Completion
Visit the PPIC Higher Education Center

Video: Policy Priorities for California’s Water

Five years into this drought—with the possibility of a sixth on the way—what have we learned about addressing the diverse challenges of scarce water supplies? A PPIC Water Policy Center event in Sacramento last week brought together experts to discuss four of the state’s key policy challenges: strengthening urban drought resilience, managing groundwater in rural areas, addressing declining ecosystem health, and ensuring safe drinking water in disadvantaged communities.

The far-ranging conversations took the audience on a virtual tour of California’s drought hot spots. It included Central Valley towns subsisting on bottled water after local wells dried up, stressed rivers and streams with numerous fish species on the brink of extinction, and farmers anticipating big changes to rural economies as a law to maintain sustainable groundwater levels is implemented.

Ellen Hanak, director of the PPIC Water Policy Center, gave an overview of how California is managing the complex and interrelated challenges of this persistent drought. The experience can help us better prepare for future droughts and a warming climate, she said.

Cities have weathered the drought fairly well. But many urban water systems—which supply about 90 percent of California’s population—struggled to implement the statewide water conservation mandate issued by Governor Brown in April 2015, panelists noted. Now that the mandate is no longer in force, the focus is on encouraging long term water efficiency—especially for outdoor landscape water use.

A panel on the complex challenges of implementing the state’s Sustainable Groundwater Management Act raised the need for better data to inform decision making. Karen Ross, secretary of the California Department of Food and Agriculture, said a big challenge for the law is “how do we create trust so that everyone will be engaged,” especially given the many challenges facing farming communities right now.

Managing water for the environment during drought was the focus of the third panel. Jeff Mount, senior fellow at the PPIC Water Policy Center, noted that California’s aquatic ecosystems “are in perpetual drought … because of how we manage water.” He argued that we must focus on managing ecosystems rather than trying to save individual species on the brink.

Water shortages and poor water quality have also made life difficult in a number of disadvantaged rural communities—the focus of the last panel. Hundreds of communities have experienced drying wells, nitrate pollution, and other problems that threaten their water supplies.

Laurel Firestone, co-director of the Community Water Center, noted that while addressing this crisis has become a growing priority in California, more needs to be done locally and nationally to address inequities in access to safe drinking water. “Our lack of action is costing vastly more … than if we got ahead of the problem and solved it,” she said.

We invite you to watch the videos from this event, and hope you find the discussions illuminating and useful:

Learn more

Read California’s Water (PPIC Briefing Kit, October 2016)
Visit the Policy Priorities for California’s Water YouTube page
Visit the PPIC Water Policy Center

Comparing College Readiness across States

How does California compare to other states in preparing students for college? This isn’t necessarily a straightforward question to answer, because most cross-state metrics, such as Advanced Placement or SAT performance, only capture the subset of students who are thinking seriously about college. However, California’s new 11th-grade assessments are aligned to college-readiness standards and administered in many other states—allowing us see how California compares to other states in preparing all students for college.

These new Smarter Balanced Assessment Consortium (SBAC) tests are aligned with the Common Core curriculum standards. The 2015–16 school year was the second year of statewide administration of these tests for students in grades 3–8 and grade 11 in California.

A high enough score on the 11th-grade test is an early guarantee that students can take college-level courses, rather than remedial courses, upon enrolling at any California State University (CSU) and most community colleges in the state. As part of California’s Early Assessment Program, students who score in the highest level (“standard exceeded”) in English language arts (ELA) or math are exempt from remediation at participating colleges. Students who score in the second highest level (“standard met”) are considered conditionally ready for college coursework and may become exempt from remediation upon successfully completing a specified course in the 12th grade. Ten other states also participate in the exam, and while the test scores don’t affect college remediation for all colleges in every state, over 200 colleges across most of the states accept the scores.

In California, 13% of 11th graders were ready for college courses in math and 20% were conditionally ready. In English, 26% were ready and an additional 33% were conditionally ready. California ranks about in the middle of all other states taking the exams, a surprising result considering previous standardized tests such as the National Assessment of Educational Progress have consistently placed California students as among the lowest-performing in the nation. Moreover, of the states using the exams, California has the largest share of students in the federal free or reduced-lunch program (a proxy for low-income status) and by far the largest share of English Learners. Students from both groups are about half as likely to be prepared for college compared with their peers. In other words, the California scores are perhaps more impressive in light of the barriers to college readiness that more California students face.


Does this mean that California is doing a good job preparing students for college? This 11th-grade test is meant to be an early signal to students of their college readiness. Students also have their senior year to prepare for college, and the readiness levels of 59% in English and 33% in math will likely improve by the end of 12th grade. However, for students who do go to college, remediation rates are still high at CSU (40%) and community colleges (80%), and haven’t changed much since the new assessments began. These results and cross-state comparisons show us that California has room for improvement and may face more challenges than other states moving forward.

Learn more
Visit the PPIC Higher Education Center

Changing Attitudes toward Marijuana Legalization

Six years ago, a California ballot initiative to legalize marijuana for recreational use fell short of a majority—46.5% voted yes. This November, Californians will vote on Proposition 64, another marijuana legalization initiative. Since the 2010 election, four other states and the District of Columbia have legalized marijuana for recreational use, and, in California, the PPIC Statewide Survey series has found increased support for legalization among likely voters and within some key groups.

In our September survey, after hearing the Proposition 64 ballot title and label, 60% of California likely voters said they would vote yes. That includes strong majorities of Democrats and independents and nearly half of Republicans.

  • Support has increased among likely voters. In response to a separate, more general question, a similar share (61%) of likely voters said that they think marijuana use should be legal. That’s a 10 point increase in support for legalization in general since September 2010, when about half of likely voters said they were in favor.
  • The partisan divide has narrowed. We have consistently found support for legalization in general to be lower among Republican likely voters than among Democrats or independents, but the gap is somewhat narrower today than it was in 2010. Then as now, at least 60% of Democratic and independent likely voters supported legalization. Among Republicans, though, support has increased from 32% in September 2010 to 45% in September of this year.
  • Support has grown among older Californians. Today, nearly three-fourths of California likely voters under age 35 favor legalization, and they are more likely than older Californians to do so—a pattern that has held since 2010. But support for marijuana legalization has increased among older Californians over the past six years. Today, nearly two-thirds of likely voters age 35 to 54 support legalization, compared to about half in 2010. A slight majority of likely voters age 55 and over are in favor today, while fewer than half favored it in 2010.

As with any election outcome, much will depend on who turns out to vote. Based on past election cycles, we can expect a larger—and younger—electorate in this presidential election year than we saw in the midterm election year of 2010. It remains to be seen, though, if Californians’ changing attitudes toward marijuana legalization will be reflected in the vote on Proposition 64.

Learn more

Read the September PPIC Statewide Survey
Visit the PPIC Statewide Survey website

Recycled Drinking Water: The Next Frontier

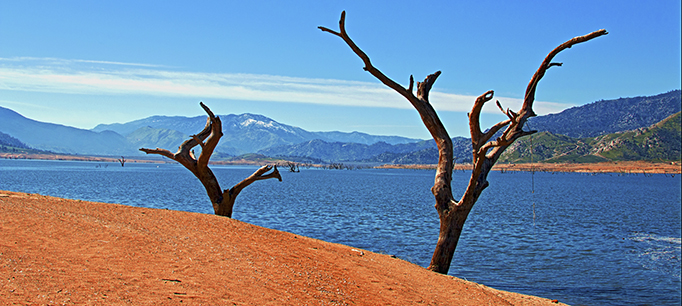
California is poised to become an early adopter of the direct reuse of purified wastewater as a source of drinking water. The State Water Board recently released a report for public comment that indicates it is feasible to regulate direct potable reuse to produce safe and reliable drinking water (comments are due by noon on October 25, 2016). We talked to David Sedlak—one of the 12 experts who worked on the report and a member of the PPIC Water Policy Center research network—about this potential new water source.

Public Policy Institute of California: How can treated wastewater be used?

David Sedlak: There are two main ways we reuse municipal wastewater. The first is referred to as non-potable reuse, which is the practice of taking water from conventional sewage treatment plants and subjecting it to a little more treatment before using it for landscape or agricultural irrigation or for an industrial use, like cooling towers or boilers. The second is to put it through a conventional sewage treatment plant and then through an advanced treatment plant, and reintroduce it back into the drinking water supply. This practice is referred to as potable water reuse.

We’ve spent the past three decades making lots of investments in non-potable reuse projects and in many cases, they turned out to be more expensive than we expected and less helpful in terms of preventing water shortages. In the early days of non-potable projects, we got all of the low-hanging fruit—using the water in places close to the treatment plant that needed it, such as golf courses or oil refineries. Because the users were close to the water source, the piping systems didn’t have to be very extensive. But as we tried to build more projects, the distances got longer and the projects got more expensive.

Potable water reuse holds a lot of promise because if you can make it clean enough to drink, you can use the existing water distribution system. In California, about half of the water use in cities is indoors. Hypothetically, there is a potential to recycle all the water used indoors—though you lose about 20 percent of it in the treatment process when you employ reverse osmosis membranes. So the upper boundary for potable water reuse might allow us to expand our urban water supply by about 40 percent.

PPIC: Where are we in terms of developing more potable projects?

DS: In California, all potable reuse systems built to date involve putting the wastewater through treatment, then putting it into underground aquifers until it is needed. This time spent in the natural environment serves to break the direct connection between wastewater and drinking water. This practice is called indirect potable reuse. What’s being discussed now is the possibility that we might skip that step. The reason people have become more interested in this approach is that not every city has a good groundwater aquifer near their water recycling plant. In the case of Los Angeles, for example, they would have to build an expensive pipeline to move treated water to valley aquifers. The places where direct potable reuse is getting the closest scrutiny are San Diego, Los Angeles, and San Jose.

Direct potable reuse is already happening in Texas—three projects have been built and a fourth is in the planning stages. The main impediment here in California is that the state has never written a permit for such a facility—no one ever asked for one before. The facilities in Texas got people thinking about the feasibility of doing it here.

PPIC: What factors affect the cost of this water source?

DS: Direct reuse is not necessarily more expensive than indirect potable projects. Engineers looking into direct potable reuse are considering additional treatment steps to reduce the risk that the failure of one or more steps in the process could cause a public health problem; these additional steps would increase the cost. But that is likely to be offset by the reduced costs of moving water, as it will be piped through the normal system. At this point we don’t see any major engineering challenges in direct potable reuse that we haven’t already seen in indirect reuse projects. The panel looked at various complicating aspects but none is a deal breaker at this point. So while the cost will vary from project to project, it looks like it will still be considerably less expensive than seawater desalination and many other alternative sources.

The bigger complicating factors are not engineering ones—these technologies have been pretty well tested in Texas and in the existing plants in California. It’s whether the public embraces direct potable reuse and if the state’s regulators feel comfortable permitting and endorsing it.

Learn more

Read about the State Water Board’s process on direct potable reuse (including how to comment on the report)
Read California’s Water: Water for Cities (from California’s Water briefing kit, October 2016)
Read “Water Management’s High-Tech Future” (PPIC Blog, September 3, 2015)

Video: John Chiang Looks to the Future

What are the top three issues that will make a difference to California’s future? That is the first question John Chiang—state treasurer and candidate for governor—was asked by PPIC’s president and CEO, Mark Baldassare.

Chiang’s response: education, economic security and opportunity, and the environment. He elaborated on these themes in the conversation before a San Francisco audience last week.

As treasurer, Chiang is the state’s banker, whose responsibilities include selling California’s bonds, investing its money, and managing its cash. He served two terms as state controller and was also on the Board of Equalization.

Baldassare said that he would sum up Governor Brown’s philosophy about taxes and spending as “fiscal restraint” and asked Chiang to sum up his own fiscal philosophy.

“Smart financial investment,” Chiang said.

“If you have the money, you invest it in education, you invest it in safety, you invest in infrastructure, make sure that you do the core issues correctly,” he elaborated.

PPIC invited Chiang as part of PPIC’s Speaker Series on the Future, which brings thought leaders from across the political and geographic spectrum to California audiences for conversations about the state’s pressing challenges. PPIC does not endorse, support, or oppose candidates for public office.

Race, Ethnicity, and For-Profit College Enrollment

After expanding rapidly for several years, enrollment in for-profit colleges has been declining since 2011. The decline in enrollment, which PPIC has noted, coincides with investigations of predatory for-profit marketing practices, restrictions on Cal Grant eligibility for some for-profit schools, and various closures, most recently ITT Tech.

During the period of rapid growth (between 2004 and 2011), enrollment in for-profits grew across every racial/ethnic group. While white and Latino students account for more than half of enrollment, African American enrollment saw the greatest growth―total for-profit enrollment doubled, but African American enrollment more than quadrupled.

Overall African American postsecondary enrollment increased by more than 46,000 students, and three-quarters of that growth was due to increased enrollment in for-profit schools. In 2004, the statewide share of African Americans enrolled in for-profit schools (8%) was similar to the share of African American high school graduates (7%). By 2011, African Americans made up 15% of overall for-profit enrollment, compared to about 7% of high school graduates meaning they made up disproportionately high share of for-profit enrollment relative their high school graduates numbers.

Since 2011, for-profit enrollment has steadily declined. From 2011 to 2014, for-profits saw a 20% drop across all racial/ethnic groups, while total postsecondary enrollment fell by only about 4%. In the same timeframe, total African American postsecondary enrollment fell about 13%, and much of that decline was due to falling enrollment at for-profit institutions and community colleges. Even so, one in five African American students are still enrolled in for-profit institutions, compared to fewer than one in ten white, Asian, and Latino students.

The fact that the overall African American postsecondary enrollment has dropped twice as much as this group’s high school graduation rate suggests that African American college enrollment may not be shifting from for-profits to other California institutions. If additional for-profits close, the college-going rate of African American students may continue to fall. Indeed, it may have fallen over the past year—we don’t yet have data on what has happened with enrollment since the shuttering of large for-profit institutions such as Heald, Wyotech, and ITT Tech.

What can public and nonprofit colleges do to attract students who have been or would be likely to enroll in for-profits? Some community colleges are reaching out to the ITT Tech students, and several colleges are starting to adopt some of the practices many students find enticing about for-profit institutions, including online courses and more flexible course scheduling. In addition to ensuring that more Californians, and more African Americans in particular, attend college, public and nonprofit institutions could help prevent high levels of student debt, which students in for-profit colleges are more likely to accrue and default on than students at other institutions.

Learn more

Read Higher Education in California: Making College Affordable
Visit the PPIC Higher Education Center

The End of the Post-Partisan Era?

Last week, a press release from the California Secretary of State touted the record number of 18.2 million California registered voters as a “major milestone.” The new numbers are impressive, but it’s also worth noting that California’s voter registration is in line with its current population trends. Both the number of registered voters and the number of adults who are eligible to vote have increased by about 1 million since September 2012.

What struck me as most significant about the September report—and what went largely without mention in the scant media coverage—is that a partisan shift that has been under way for several years has accelerated during the 2016 presidential election.

In 2004, a year after the recall of California governor Gray Davis, a Democrat, and the election of Republican Arnold Schwarzenegger, there was an 8 point gap between Democratic and Republican registration (43% to 35%). In the 2006 general election, Governor Schwarzenegger was reelected and one other Republican won a statewide race (Steve Poizner for insurance commissioner). In other words, California was a Democratic-leaning state but Republicans could eke out a statewide victory, depending on the partisan turnout and candidates.

When Democrat Barack Obama was running for president in the fall of 2008, the gap between Democratic and Republican registration was 12 points (44% to 32%). During President Obama’s reelection campaign in the fall of 2012, there was similar registration gap between Democrats and Republicans (43% to 30%). Between 2004 and 2012, the Republicans lost about a quarter of a million voters and the Democrats gained about three-quarters of a million voters. The biggest registration increase was among independent (or decline-to-state) voters, whose number grew by a million. With many new voters eschewing party membership, California seemed to be entering a “post-partisan” era. Still, with a double-digit lead in voter registration, Democratic candidates defeated Republicans in all statewide races in 2008, 2010, 2012, and 2014.

This September, the Democratic-Republican registration gap swelled to 18 points (45% to 27%). In a departure from recent trends, Democratic registration saw larger gains than independent registration over the past four years. Moreover, comparing the Secretary of State’s report for January 2016 with the September report, the biggest gain by far was in Democratic registration. This coincides with high interest in the Democratic primary between Bernie Sanders and Hillary Clinton and the unconventional candidacy of Republican Donald Trump. Is this a blip or does it signal the end of the post-partisan era? The Secretary of State’s report after the October 24 voter registration deadline will allow us to track registration trends amid debates, campaigning, and candidate news.

The growing partisan gap raises many questions. Since it’s easier to register than to vote, will new voters cast ballots this fall? With the latest PPIC Survey indicating a lack of competitive statewide races, will the growing Democratic advantage help to pass state propositions on taxes, corrections reform, and marijuana legalization? Will it allow the Democrats to reach their goal of a two-thirds majority in the state legislature? Looking beyond the 2016 election, the voter registration gap could have implications for the future of the Republican Party, the top-two primary, and California’s democracy.