Hans Johnson, director of the PPIC Higher Education Center and PPIC senior fellow, testified at the Joint Legislative Oversight Hearing on Cybersecurity Education and the Needs of the Workforce before the Assembly Committee on Higher Education in Sacramento today (October 10, 2017). Assemblymember Jose Medina chairs the Higher Education Committee and Assemblymember Jacqui Irwin chairs the Select Committee on Cybersecurity. Here are Johnson’s prepared remarks.
Thank you Chair Medina, Chair Irwin, and committee members. My name is Hans Johnson, and I am the director of the Higher Education Center at the Public Policy Institute of California. My role today is to provide a brief overview of cybersecurity labor market needs in the state. First, I’ll define cybersecurity occupations, next I’ll provide data on labor market trends, and finally I will discuss educational awards related to cybersecurity. Sources of information and data used in this testimony include the United States Department of Labor, the California Employment Development Department, the United States Census Bureau, and reporting by California colleges and universities to the United States Department of Education.
As an occupation, cybersecurity is identified by the US Department of Labor as “information security analyst” and resides within a broader set of computer and mathematical occupations. In this testimony, I will focus on the information security (IS) analyst occupation. However, it is important to note that other computer and information technology occupations include individuals who work at least partly on security issues. According to the US Department of Labor: “Information security analysts plan and carry out security measures to protect an organization’s computer networks and systems. Their responsibilities are continually expanding as the number of cyber attacks increases.”
The IS analyst occupation is a high wage, high demand occupation. It is growing but still relatively small. Increasingly, employers are hiring workers with at least a bachelor’s degree to fill IS analyst jobs, but a notable share of jobs are still filled by workers with less than a four-year degree. California colleges and universities have substantially increased the capacity of their institutions to award degrees in computer science and related fields. Even so, unemployment rates remain very low—an indication that employers could be having a hard time finding workers.
In California, EDD estimates the state was home to about 8,000 IS analysts in 2014, with that number projected to increase to 10,100 by 2024, a growth rate (26%) slower than other computer occupations (29%) but much faster than the state’s overall employment growth rate (15%). Still, it is important to note that IS analysts make up less than 1% of employment in computer occupations in California and less than 2% in the nation (see chart below). IS analysts work in a broad range of industries, including technology, banks, higher education, insurance, and health.
EDD estimates that IS analysts in California had a median wage of $53 per hour in the first quarter of 2017, which amounts to $110,000 on a full-time annual basis. Nationwide, the unemployment rate for IS analysts has been around 2% for several years now (based on my analysis of American Community Survey data from 2012 through 2015), with similarly low unemployment rates in California. Unemployment rates that low are a sign of high labor market demand.

Of critical concern for workers, and for these committees, are the education and training requirements for IS analysts. According to the U.S. Department of Labor:
Information security analysts usually need at least a bachelor’s degree in computer science, programming, or a related field. As information security continues to develop as a career field, many schools are responding with information security programs for prospective job seekers. These programs may become a common path for entry into the occupation. Currently, a well-rounded computer education is preferred.
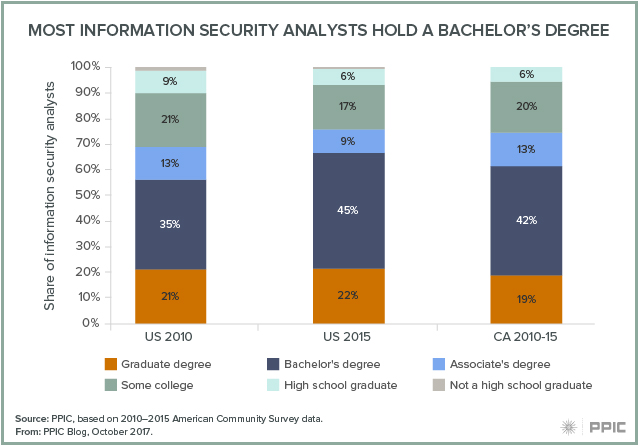
The number of IS analysts has increased nationwide in the last five years and so has their educational attainment. In the US, 67% of IS analysts had at least a bachelor’s degree in 2015 compared to 56% in 2010. In California, about two-thirds of analysts have at least a bachelor’s degree. The share of IS analysts in the US with an associate’s degree has declined from about 15% to less than 10%. The vast majority with a bachelor’s degree majored in one of three fields: computer science (including information systems), engineering (including electrical engineering and computer engineering), and business (including management information systems). In California, annual average earnings for IS analysts with a bachelor’s degree are about 70% higher than for those with some college or an associate’s degree, who in turn earn about 20% more than those with only a high school diploma. Unemployment rates are low for IS analysts, especially those who have some postsecondary education and those who have a bachelor’s or graduate degree.
California is home to dozens of colleges and universities that offer degrees in computer and information sciences. The state’s universities, especially the University of California, have quickly responded to the strong demand for these degrees (see chart below). The total number of bachelor’s degrees awarded increased from less than 3,000 in 2010 to 6,000 by 2016, with UC and CSU accounting for 65% of the total in 2016. The most common major is computer science, followed by computer and information science.

California’s community colleges also offer postsecondary training in computer and information sciences, ranging from short-term certificate programs to associate’s degrees. Importantly, they also provide lower division courses necessary for transfer to a four-year college or university. The total number of associate’s degrees in computer and information sciences and support services doubled between 2010 and 2016, from 719 to 1,490. The number of short-term certificates (completed in less than one academic year) increased from 1,605 in 2010 to 1,838 in 2016, and the number of longer-term certificates (completed in at least one but less than two academic years) increased from 225 to 321. In all, the number of postsecondary awards totaled more than 3,600 by 2016. PPIC is currently developing research that explores information technology awards at the community colleges and is working with the Employment Development Department and the Chancellor’s Office of the California Community Colleges to secure access to student and wage data.
In thinking through the roles of the different segments of higher education in California, it is important to keep in mind that the segments are designed to work as a system. The strong demand, both on the part of students and employers, in technology fields should be met by each institution and by the segments working together. For example, improving transfer from community colleges to UC and CSU in technology fields through better articulation—including Associate Degrees for Transfer—is necessary if students are going to fully realize the economic benefits of these fields. Moreover, cybersecurity occupations are but one part of a larger technology sector. Developing a larger industry-wide and cross-system approach to meeting demand is necessary. Innovations—such as locating some CSU bachelor’s degree programs at community college campuses—offer the promise of reaching more students, including those underrepresented at our four-year colleges. California can best serve the growing number of students who want to pursue technology jobs by taking advantage of the strengths of each segment of its public higher education system—and helping those segments work together to meet the economic need for these highly skilled workers.


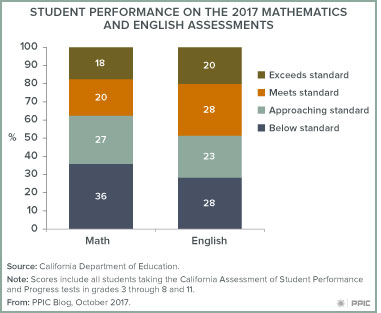 Known as the California Assessment of Student Performance and Progress (CAASPP), tests in English and mathematics are administered to virtually all K–12 students in grades 3 through 8 and in grade 11. Students take the computer-based assessments in late spring each year. The scores are reported across four performance levels. In English this year, 45% percent of students performed at the top two levels, which signal that they are working at or above the state’s standard for proficiency. About 28% of all tested students fell into the lowest performance level, “below standard.” In comparison, fewer students had mastered the mathematics skills needed to meet state standards, with 38% earning a proficient score. More than a third (36%) scored at the lowest performance level.
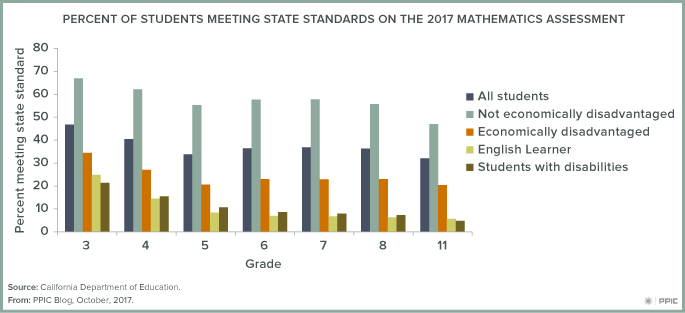


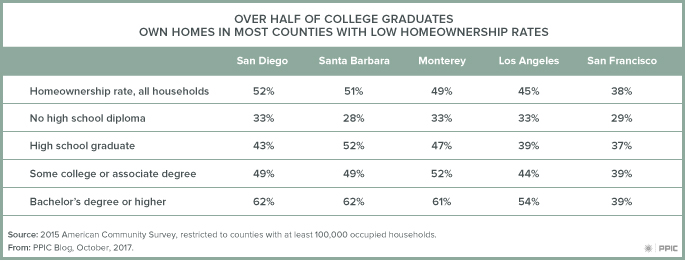
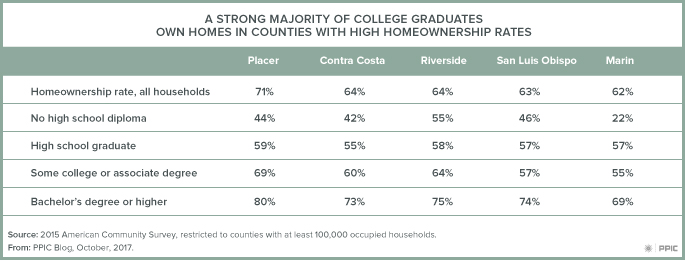
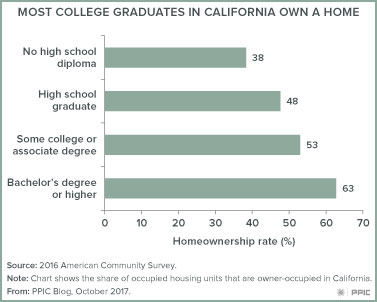 Owning a home has long been part of the American dream. But with the state’s high housing costs, homeownership is difficult for many Californians to achieve. In a