Drought Watch: It’s the Heat and the Humidity

This is part of a continuing series on the impact of the drought.

The severity of the current drought is sparking keen interest in seeing how this past water year (October 2013–September 2014)—and more importantly, the past combination of years—ranks in comparison to other droughts. As noted in a PPIC fact sheet, this drought is one of the driest.

What’s more, this drought is so challenging because it has been very warm. Recent summaries from the National Climatic Data Center reveal that the 2014 water year was one of California’s warmest, as the map below indicates. The numbers show how average temperatures for the past water year compare over 119 years of record-keeping. Much of the west was warm—and California was warmest of all.

In addition, the 2014 water year was preceded by two drought years with daily average temperatures and daily maximum temperatures that were well above the 20th century average.

Temperature plays an important role in exacerbating water scarcity during drought. Warm temperatures during the winter and spring reduce the amount of snow relative to rain and lead to earlier spring snowmelt. The state’s snowpack is our largest surface reservoir, accounting for roughly a third of available supply.

Warm temperatures have an equally important impact on how much water is lost to the atmosphere by transpiration of plants and evaporation from soils. In a typical year, this process—called evapotranspiration—removes almost two thirds of the water that falls on the state. Warmer temperatures and a longer growing season dry things out, sharply reducing the share of rainfall that makes it into rivers and groundwater.

As soils dry out, it is harder to recover when the rains come again. The parched landscapes of California will require abundant rain this winter before soils become saturated enough to produce significant runoff. This is why runoff, relative to the amount of precipitation, is often less following very dry years. Even if we receive normal precipitation this winter, we will still have a drought “hangover” (see recent forecasts for the coming winter).

Finally, it is worth noting that most climate change models suggest that the well-documented decades-long trend toward warmer temperatures in California will continue (models are less certain about changes in precipitation amount). More years that are both dry and warm will pose many challenges for California, as we can see from our struggles with the current drought.

Figure source: National Climatic Data Center

Immigration: What’s Next in California?

More than one million Californians could be affected by President Obama’s executive order on immigration. Undocumented immigrants who have resided continuously in the U.S. for the past five years and are parents of children who are either U.S. citizens or legal permanent residents will be eligible for work permits. They will also be relieved from the threat of deportation. In addition, the executive order increases the number of people eligible to register as “Dreamers” because they were brought to the U.S. as children.

Undocumented immigrants who qualify under the president’s order will likely be able to provide more stable homes and increase their connection to their communities. Californians have already demonstrated that this is what they want for undocumented immigrants. More than 80% of Californians favor providing undocumented immigrants with a pathway to citizenship if they meet background checks, pay back taxes and penalties, and learn English—according to each of the three PPIC Statewide Surveys that asked about this issue in 2014.

California legislators have been leaders in setting policy that helps integrate the undocumented immigrants already in our communities by passing legislation that allows undocumented immigrant youth to pay in-state tuition at our colleges and universities, qualify for state financial aid, and obtain driver’s licenses. Low-income Californians registered as “Dreamers” also qualify for state Medi-Cal.

What happens next depends in large part on the reaction of state and local governments. Knowing where qualified undocumented immigrants live is essential to realizing the potential gains both to the state and to the immigrants themselves. This is challenging. Surveys don’t generally ask about immigration status, so most of what we know about this population derives from complicated estimates of immigration status.

Here, we present counts of undocumented immigrants who have filed federal tax returns without social security numbers (instead using Individual Taxpayer Identification Numbers, or ITINs) and with wage forms (W-2s) attached. We believe this is a reasonable way to broadly determine who will be affected by President Obama’s executive order. Undocumented immigrant tax payers are more likely to have been in the U.S. longer and are likely to be the most intent on making the U.S. their permanent home. By filing taxes, they have already taken steps to identify themselves as contributing members of their communities and the economy.

A few caveats—while we are certain that each of the immigrants we identify in this fashion are undocumented, this method probably does not count all undocumented immigrants who may be eligible for the order. Probably not all undocumented immigrant tax payers use ITIN numbers, and not all undocumented immigrants file tax returns. Further, not all undocumented immigrants using ITIN numbers will be eligible for the order.

We find that California has over 900,000 undocumented immigrants filing federal tax returns for the 2012 tax year, the most recent year data is available. These undocumented immigrants live in 55 of our 58 counties, with large numbers in Los Angeles, the Bay Area, the Sacramento region, the Central Valley, coastal California, and the Inland Empire. This information can be useful to local legal service providers and local governments to help plan for the registration of eligible undocumented immigrants, the most critical first step in implementing the president’s order.

Of course, county populations are not homogeneous—a closer look reveals sharp differences in the number of ITIN filings by zip code, even within counties. The map below shows high numbers of undocumented immigrants in rural regions (large-area zip codes), as well as in city and suburban centers (small-area zip codes). In Riverside County, for instance, undocumented workers are found in high numbers in the urban areas in the west, as well as in the agricultural region around the Coachella Valley.

President Obama has made it clear that those eligible for deportation relief under this new executive order are ineligible for health care subsidies under the Affordable Care Act. But, as in the past, California may wish to do more—for example, providing Medi-Cal coverage to qualifying adults and doing more to reach out to their already eligible children. In addition, upward mobility is most likely for immigrants obtaining work permits if they make investments in English language acquisition. NGOs, community college districts, and school districts that still provide adult education could use the information about where undocumented immigrants live to plan course offerings in the years to come.

Will Proposition 47 Save Money?

Earlier this month California voters passed Proposition 47, which classifies a number of drug and property offenses as misdemeanors instead of felonies or “wobblers” (wobblers may be charged as misdemeanors or felonies at the discretion of the prosecutor). Moreover, the new law—which went into effect November 5—permits offenders to file for resentencing, meaning that those who are resentenced could be released from jail or prison.

Based on limited data, the Legislative Analyst Office estimates that roughly 40,000 offenders per year will be affected by Proposition 47 and that total county and state savings associated with the reform may be in the “high hundreds of millions of dollars annually.” The bulk of the state savings will be aimed at reducing re-offending by providing funding for mental health and substance abuse treatment.

A clear short-term benefit of this reform is that it is likely to help the state meet the federally mandated reductions in the prison population by February 2016. The California Department of Corrections and Rehabilitation estimates that around 4,700 inmates are eligible to petition for release from prison under Proposition 47.

The greatest impact, however, might be at the county jails. Because of the 2011 corrections realignment reform, most of the lower-level offenders now covered under Proposition 47 are serving their sentences in county jail instead of state prison. Recent reports that focused on the proposition’s expected jail savings, using the LAO’s estimate of 40,000 affected offenders per year, put the local savings from the proposition somewhere between $400 and $700 million.

While substantial savings may very well occur from housing fewer inmates affected by Proposition 47 in county jails, a closer look suggests expectations may be too optimistic.

First, the data used to generate the LAO estimate of the number of affected offenders also show that about 30 percent of the convictions in 2012 did not result in jail time, but rather in a straight probation term. The largest share of convictions, about 41 percent, led to a jail term followed by probation. Only 11 percent of convictions resulted in a straight jail sentence. In other words, even though the data suggest that the estimated number of affected offenders is 40,000 annually, the potential number of convictions directly affecting the jail population would be roughly half that number.

Second, the estimated local savings from Proposition 47 are based on the assumption that newly freed jail beds will remain empty. Given that jail overcrowding in California compelled the early release of 71,000 sentenced offenders for the period between April 2013 and March 2014, this assumption may not hold. A likely response to the newly freed jail beds will be to refill them with inmates, who absent the proposition, would have been released early due to overcrowding. While using freed beds to reduce early releases may limit savings, it may also bring a new degree of integrity to sentencing and alleviate the public safety concerns associated with these early releases.

In the end, the Proposition 47 budget savings may fall short of projections—but the proposition may well bring other benefits, including fewer releases due to overcrowding. Furthermore, the passage of Proposition 47 means that offenders convicted of these lower-level offenses—who otherwise have a clean record—will be spared the stigma of a felony record. In this way, the proposition may ultimately lead to less re-offending because those charged under its new sentencing standards will have greater access to jobs and housing than they would if they had become convicted felons.

How Does UC Compare in Enrolling Nonresident Students?

Record-high numbers of out-of-state students are enrolling in the UC system. Estimates show that one out of every five freshmen starting at a University of California campus this fall will be a student who attended high school in a state outside of California or outside of the U.S.

Nonresident students pay about three times the tuition of a California resident. Since the state’s deep cuts to higher education budgets, the UC system has increasingly relied upon nonresident student enrollment as a source of revenue. In fact, Senator Kevin de León recently suggested raising tuition on nonresidents to increase revenue for UC. Several other legislators and members of the public have criticized the increased recruitment and admission of nonresidents. All of which raises a question: How does UC’s enrollment of nonresident students compare to that of similar universities in other states?

Among public, four-year research universities nationwide, only UC Berkeley and UCLA are above the national average in the proportion of students paying out-of-state tuition. The UC average is well below the national average for similar universities. In fact, the UC system claimed six of the bottom 17 spots, as the following chart demonstrates.

Looking at the trend over time, the UC system has enrolled relatively low levels of nonresident students compared to other similar universities, but that average has been increasing sharply since 2010. However, nonresident enrollment is also increasing at other top-tier, public universities throughout the nation—likely because of budget woes in other states. In the most recent two years, there has been no national data for a comparison, but UC provides the number of students intending to register each year, which is likely an upper bound for nonresident enrollment. The number of nonresident students has continued to climb, especially at UC Berkeley and UCLA, where they are estimated to make up 29.8% and 30.1% of 2014 freshmen enrollees, respectively. But even with these increases, nonresident enrollment is still likely lower at UC Berkeley and UCLA than it is at many prestigious public four-year universities, and the UC system is likely well below the national average for similar schools.

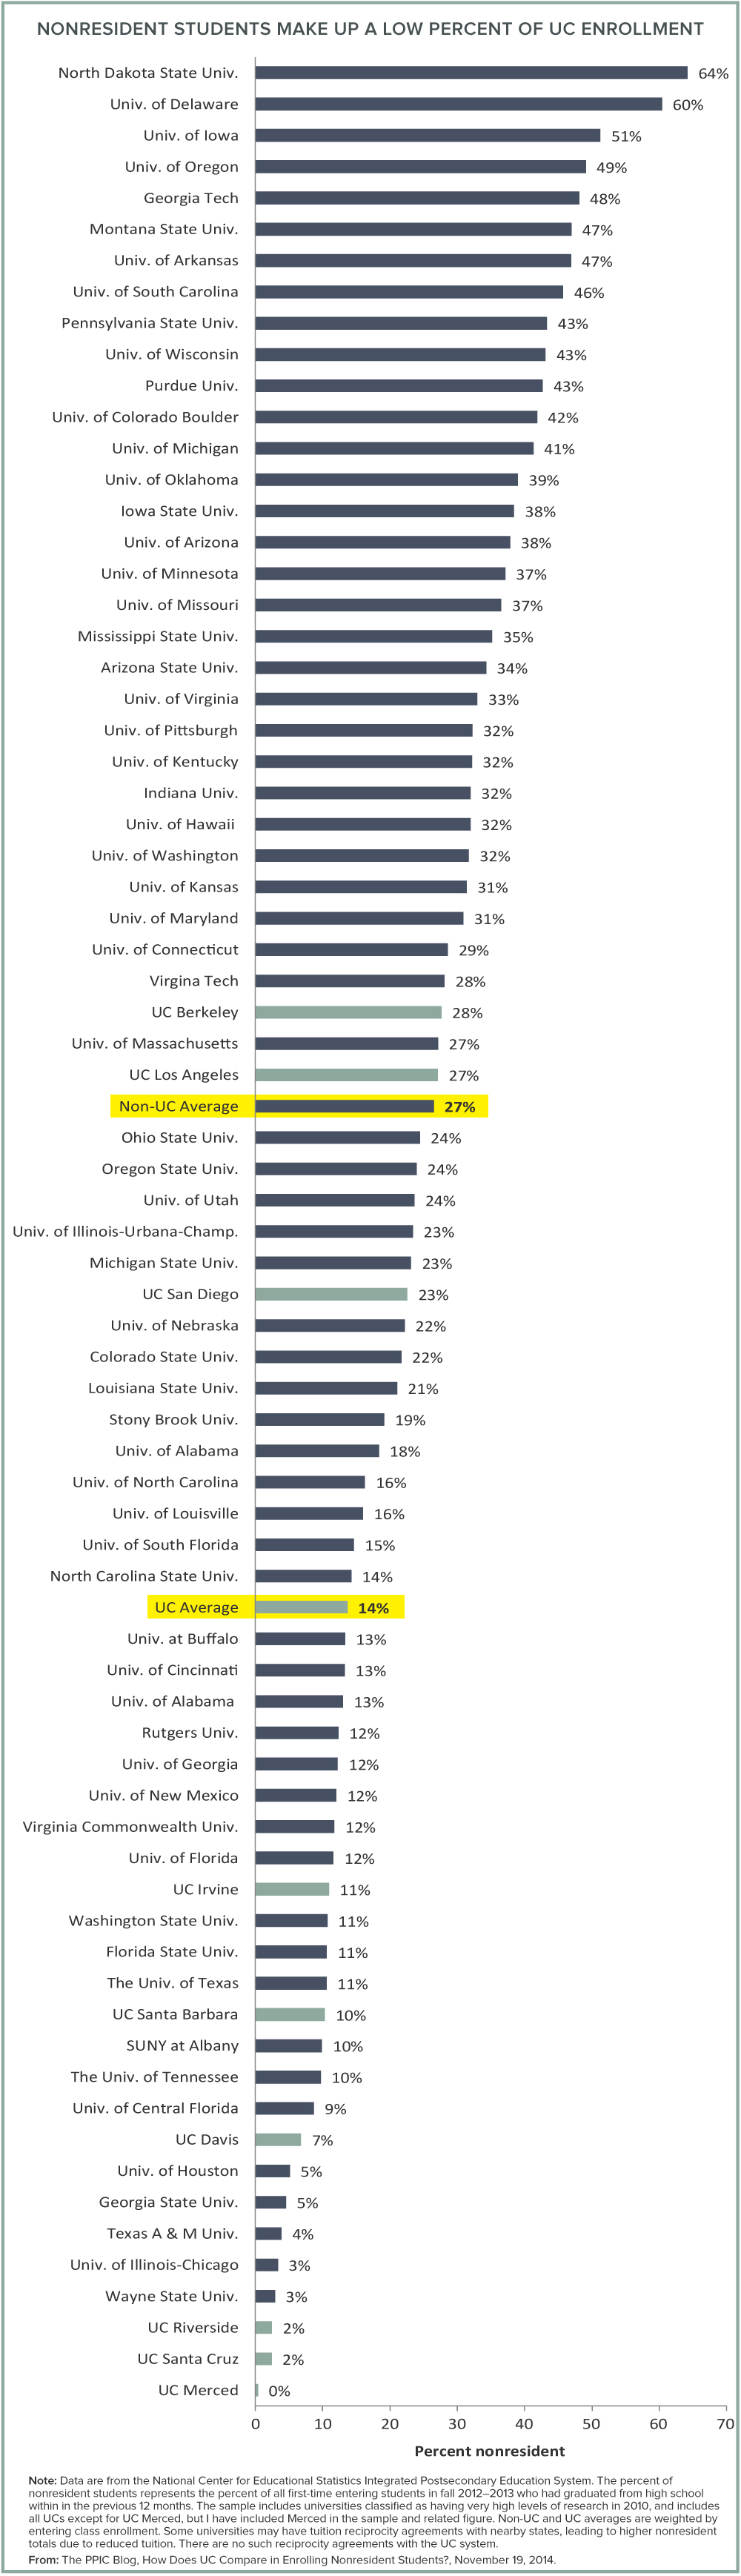
UC President Janet Napolitano has stated that she has considered limiting the number nonresident students in the UC system. But instead of setting system-wide limits, and relying on some universities to have fewer nonresidents to balance Berkeley and UCLA, the president and board of regents may consider setting enrollment limits for nonresident students for each university in the system. The full board of regents meets Thursday to vote on a plan for raising tuition at UC. If UC cannot increase revenue through tuition increases or from the state, they may seek to enroll more nonresidents, as they have done in the past. Even though the UC system has a relatively low proportion of nonresident students compared to the nation, such a move would still likely generate controversy.

Note: (BOTTOM CHART) Data are from National Center for Educational Statistics Integrated Postsecondary Education System (IPEDS) and the UC Office of the President. Solid lines indicate data retrieved from IPEDS; dotted lines indicate estimated enrollments based on UC Office of the President’s reported Statement of Intent to Register (SIR). The percent of nonresident students represents the percent of all first-time entering students in fall 2012–2013 who had graduated from high school within in the previous 12 months. The IPEDS sample includes universities classified as having very high levels of research, and includes all UCs except for UC Merced, but I have included Merced in the sample and related figure. Non-UC and UC averages are weighted by entering class enrollment. Universities are not required to submit nonresident counts to IPEDS in odd years, and some do not. Those odd year values are imputed from the even years surrounding them.

California’s Voter Turnout Problem

Voter turnout in California’s 2014 midterm election was awful. It looks to have hit a new low, with about 42 percent of registered voters deciding to cast a ballot. The previous low came in a 2002 race between Bill Simon and Gray Davis that everyone at the time agreed marked a low point for engagement and interest.

But are these numbers really so bad? Can we put them in some broader context that makes them look better? We can try, but it turns out that when we do, it only makes them look worse.

First, turnout as a share of registered voters tells only half the story. It ignores all the Californians who were legally eligible to vote but didn’t even bother to get registered in the first place. If we’re worried about citizen engagement, then ignoring these people is a problem. When they are included in the calculation, turnout drops to 31 percent—5 percentage points below the previous low and 17 points below the average for midterm elections since 1922.

The problem is still more dire when we stack California against the rest of the country. The graph below shows midterm turnout among eligible voters in California and the United States as a whole (the U.S. numbers come courtesy of Michael McDonald and his United States Elections Project).

As the graph indicates, national turnout was low this year (about 36%), but it wasn’t too far out of line with the trend since the 1970s, which has been a little low but flat. California’s midterm turnout, by contrast, has been in a fairly steady decline since the mid-1950s. Our recent turnout is 5 points below the national number, despite the fact that many other states did not have any statewide election (and the national average includes California itself).

Before we conclude this is a California problem, it’s useful to see the same graph for presidential elections.

It looks about the same—fairly flat national turnout and falling California turnout since the 1970s—until roughly the last 20 years. During this most recent period, California’s decline has stopped, and turnout in both California and the nation has even increased a little.

Taken together, these graphs rule out some explanations. The problem is not California’s political reforms like the redistricting commission or the top-two primary, because the gubernatorial decline predates those changes (which came in 2012). But it’s not something immutable about California, either, because it’s nothing a few exciting presidential elections can’t fix. In fact, what’s interesting is how good California’s turnout used to be compared to the rest of the country, and therefore how new it is to have a California with turnout that is actually below the national average.

To get at the answer, we will need to understand what has been different about recent presidential elections in California, and why higher turnout for them has not extended to gubernatorial races. Is turnout decline the natural state of things, from which presidential contests have departed? Or is higher turnout the more reasonable expectation, from which gubernatorial turnout is an aberration? Both accounts seem reasonable, but it’ll take further study to pull the two apart.

Paying for Higher Education

As concerns have grown about access to and affordability of California’s higher education system, understanding costs has become more critical than ever. How are institutions—and students—faring?

This question is the focus of three reports released by PPIC and a panel discussion held last week in Sacramento. Hans Johnson, a Bren fellow at PPIC, first summarized the research. One report shows that federal financial aid has shielded low-income students from rising tuition at the University of California and California State University. A second report evaluates both revenues and spending—including faculty salaries and benefits— and concludes that UC and CSU have not become less efficient in the past several years. A third report suggests that as California begins to reinvest in public higher education, it could tie funding more closely to results—for example, the number of degrees awarded—to meet state goals. In his presentation, Johnson noted that the state’s current goals—the Master Plan for Higher Education—are more than 50 years old and overdue for an update.

Panelists took up the issue of goals—how to set them, what to measure, and how to share the costs—in a discussion moderated by Patrick Murphy, PPIC research director. Participants were Henry Brady, dean of UC Berkeley’s Goldman School of Public Policy; Nancy Shulock, former executive director of CSU Sacramento’s Institute for Higher Education Leadership and Policy; and Amy Supinger, California policy consultant for the Lumina Foundation.

Health Care Reform in California: An Update

Beginning tomorrow, many Californians will be able to enroll in or switch health insurance plans through the state’s insurance exchange, Covered California. In its first six months, Covered California enrolled 1.1 million people in private insurance plans and 2.2 million in Medi-Cal. This year the goal is to further expand enrollment and reduce the number of uninsured in the state. The open enrollment period will last for three months, although people will have to enroll in private plans by December 15 for coverage to kick in on January 1, 2015, and those who are eligible for Medi-Cal can enroll year-round.

What has happened so far?

  • California was one of the first states to implement the Affordable Care Act and set up its own exchange. Although there were some bumps along the way, the rollout was relatively smooth, and enrollment numbers were strong.
  • Of the 1.1 million people who enrolled in private insurance plans, approximately 88% were eligible for federal subsidies to offset their out-of-pocket costs.

What’s different this year?

  • In 2015, insurers and policymakers are hoping to enroll a large number of the estimated 3-5 million California residents with no insurance. A recent survey estimated that 30% of the remaining uninsured are undocumented immigrants, who are ineligible for ACA coverage.
  • Covered California is trying to make enrollment easier by increasing staffing and hiring more workers who speak more than one language.
  • Covered California monthly premiums will increase modestly—by around 4.2 percent, on average. Some premiums may increase by more than that, and some plans may become less expensive.
  • The tax penalty for uninsured individuals will be considerably higher:
    • In 2014, the penalty was 1.0% of household income or $95 per adult and $47.50 per child, whichever is greater.
    • In 2015, it will be 2.0% of household income or $325 per adult and $162.50 per child, whichever is greater.
  • Small businesses (with fewer than 50 employees) will be able to offer plans in two tiers through the Small Business Health Options Program (SHOP); they can also offer separate adult dental plans.
  • The tax penalty for firms with 50 to 100 employees that do not offer insurance coverage has been delayed until 2016.

What to look for in the months ahead?

  • Covered California is expecting to enroll around 500,000 people of all ages in private plans over the next few months. Policymakers are eager to enroll young adults (under 35) in insurance plans, because they are likely to be healthy, which will help keep premiums low and encourage insurers to enter the marketplace. Covered California has also allocated more than $100 million for Latino outreach.
  • There is currently a backlog of Medi-Cal applications waiting for approval from the Department of Health Care Services. A big influx of new enrollees could create longer wait times. Department officials are working to improve the system that processes applications; to clear the backlog, it will begin granting temporary approval to applicants younger than 19 to speed up their enrollment.
  • The U.S. Supreme Court will hear a challenge to the Affordable Care Act’s federal subsidy provisions next year. Because California does not participate in the federal insurance marketplace, it will not be directly affected by the court’s decision. But there could be significant implications for the program as a whole.

The Kaiser Family Foundation is a reliable source of information about enrollment specifics.

New Era for Initiatives?

California’s exceptional nature was on display again last Tuesday, as Democratic candidates swept the statewide races while Republicans scored big victories in the national midterm elections. An analysis by my PPIC colleagues Eric McGhee and Daniel Krimm shows that the state’s legislative races were closer this time around and a few competitive seats switched parties. In the end, though, the California Legislature and U.S. House delegation remain firmly in the Democratic column.

The exit polls confirmed what we reported in 2014 PPIC pre-election surveys and analyses of likely voters’ profiles. The 15 point voter registration gap between Democrats and Republicans (43% to 28%) narrowed somewhat in this midterm election but not by enough to challenge the deep-blue nature of California politics. The final voter tally is still weeks away, but this election year will likely stand out in California history for record-low turnouts in both the June primary and the November general election.

The search for the cause of voter apathy has mainly focused on the governor’s race, but I would like to call attention to another exceptional feature of this election: the drop-off in state propositions and citizens’ initiatives, which have often captured media attention and voter interest in the past. It may mark the beginning of a trend with profound implications for voter engagement and state policymaking.

This year, there were only eight state propositions on the June and the November ballots, including four legislative measures, three citizens’ initiatives, and one referenda. Both legislative measures on the June ballot, Propositions 41 and 42, passed with more than 60 percent of the vote and little fanfare. On the November ballot, two legislative measures, Propositions 1 and 2, also garnered more than 60 percent of the vote. Governor Brown sold them as a package with a “Save Water, Save Money” campaign, tapping into concerns about the state drought and budget shortfalls. Proposition 47, a citizens’ initiative on criminal sentencing, passed with almost 60 percent at a time when fear of crime does not loom large among Californians. The three measures that failed—two citizens’ initiatives on health care, Propositions 45 and 46, and a referendum on Indian gaming, Proposition 48—faced well-funded opponents. Although money was clearly a factor in the outcomes on ballot measures, the $151 million in total spending represents a down year for the campaign consultants in the California initiative business.

To place this year in context, there were 100 state propositions on state ballots between 2003 and 2013, including 68 citizens’ initiatives, 25 legislative measures, 6 referenda, and the governor’s recall. Total spending for and against the 68 citizens’ initiatives was about $1.8 billion. In fact, since the Proposition 13 era began in 1978, the numbers of state propositions and citizens’ initiatives in midterm and presidential election years has never been lower than in the 2014 election cycle. Why the dramatic change in voter decision making at the ballot box?

One contributing factor is SB 202, which had the intended consequence of keeping citizens’ initiatives off the June primary ballot for the first time in decades. Passed by the legislature and signed by the governor in late 2011, this law limits citizens’ initiatives and referenda to the November election, when more voters typically cast ballots. A PPIC report pointed to another potential effect of the law: turnout could fall by 3 to 7 points without initiatives on the primary ballot. While the legislature can still place its proposals on the primary ballot, as it did with Propositions 41 and 42 this June, these measures can lack the sizzle and drama of initiative campaigns. In other words, SB 202 could have the unintended consequence of lower primary turnout.

SB 202 was expected to result in more initiatives on the November ballot, but that did not happen this year. It is possible that some interest groups shied away from the ballot because their causes were more likely to succeed in a primary with a smaller, older, and more conservative electorate. Others may have decided to wait until the presidential election in November 2016 because their causes are better aligned with a larger, younger, and more liberal electorate. Or maybe initiatives have simply become too expensive, even for the interest groups that operate in this arena. In any case, fewer initiative campaigns gave Californians fewer reasons—and fewer televised reminders—to vote this fall.

Because of another new law, SB 1253, we can expect further declines in the number of initiatives on state ballots. Passed by the legislature and signed by the governor this fall, the law offers proponents more opportunities to amend and withdraw their measures, and it requires the legislature to hold public hearings to review initiatives. These types of process changes have strong public support in PPIC Statewide Surveys. By allowing time for reconsideration and providing opportunities for collaboration between initiative proponents and the legislature, SB 1253 may result in fewer citizens’ initiatives and more legislative measures—which would be a throwback to the pre- term limits era before 1990. Such a trend might improve the initiative process, but it could also make elections less interesting for voters.

An early test of SB 1253 will be the marijuana legalization initiative that is on course for the November 2016 ballot. A previous marijuana legalization initiative failed with a 46 percent yes vote in 2010. The October 2014 PPIC Statewide Survey found that 50 percent of likely voters are in favor of legalizing marijuana, so it is far from certain that a 2016 initiative would pass.

Will legislators and proponents search for a compromise before the initiative goes to the voters? Legislators may want to find ways to connect with younger voters in 2016, while proponents may want to bypass costly and risky campaigns. Another reason to think there may be a compromise: the pass rate for legislative measures (71%) has been much higher than the pass rate for citizens’ initiatives (38%) over the past 40 years. If a deal is struck on this high-profile, controversial issue, initiative compromise leading to legislative measures could become the new hybrid model for making policy at the ballot box.

How will voters respond to primaries and general elections with fewer citizens’ initiatives on the ballot? It seems likely that presidential elections will still hold their interest, but primaries and midterm elections might be less compelling. In other words, tinkering with the citizens’ initiative process may unintentionally produce new historic lows in voter turnout. Looking for other tools to engage Californians in elections while improving the initiative process will keep secretary of state–elect Alex Padilla busy over the next four years.

Crime Rates Down, But Not Everywhere

Most of California’s counties saw lower crime rates in 2013, according to the latest data. Violent crime dropped in 41 out of the 58 counties, and property crime dropped in 37 counties. In some counties the decreases are substantial. For example, property and violent crime rates in Merced County dropped by 20.4% and 15.8%, respectively, while Napa experienced declines of 10.8% and 14.7%.

While news of improved public safety is unquestionably good, crime experts will point out that understanding year-to-year changes is difficult. That’s particularly true for small counties, where just a few criminal incidents can dramatically affect crime rates. Larger counties are less sensitive to this, by virtue of their size alone, so looking at changes in crime rates in the state’s largest counties provides a meaningful focus.

Here, too, the news is mostly good—most of the state’s large counties saw drops in crime rates in 2013. This appears to be part of a longer trend (2012 was an exception). Violent crime dropped in 14 out of the state’s 15 largest counties, which include more than four-fifths of California’s total population. The property crime rate decreased in 11 out of the 15 largest counties. Again, some of the drops are substantial. For example, Orange and Sacramento Counties saw decreases of 10% and 9.4% in property crime, and their violent crime rates dropped by 11.9% and 7%.

However, not all large counties saw improvements in 2013. One county’s recent trend differs noticeably: San Francisco. Even as property and violent crime rates reached 10-year lows in Los Angeles, Orange, and Sacramento Counties, San Francisco’s reached 10-year highs. The recent increase is surprising. The county appeared to be in good shape to handle the new responsibilities—most centrally, managing lower-level felons—given to all counties under California’s public safety realignment. San Francisco is often regarded as innovative in its strategies to prevent re-offending. It is also a county that does not face jail capacity constraints. More broadly, San Francisco has seen a shift toward a wealthier population and has a strong and growing economy—indicators that usually point to less crime.

Right now, it is difficult to say what is behind San Francisco’s troubling crime trend, but it is possible that some features unique to the county are contributing factors. One of these features is the relatively high proportion of non-residents in San Francisco at any point in time. For example, if there is an increase in the number of tourists and commuting workers, then the number of potential crime victims (which may attract more offenders) also increases. But crime rates are based only on the number of county residents—they do not take into account changes in non-residential population. So an increase in the number of reported crimes could partially be driven by an increase in the number of visitors, including tourists and commuting workers. Estimates based on Census data show that commuting workers add about 162,000 to the daytime population of San Francisco. That’s more commuters than any other county in California—including Los Angeles County, which is roughly 12 times larger.

It’s still not clear if changes in the non-resident population are driving up San Francisco’s crime rates—the recent increase in residential burglary suggests other crime-related factors could be involved. Changes in the number of cops, policing strategies, sentencing and incarceration decisions, jail capacity, and approaches to reduce re-offending are all factors that may affect county crime rates and trends.

This brief mini-analysis of San Francisco’s crime trends is admittedly speculative, and it points toward the difficulty of interpreting these trends—as well as the need for more research, which would allow us to better understand the underlying factors of crime and crime trends in California. PPIC is committed to continuing such efforts.

(TOP CHART) Source: Author calculations based on the California Department of Justice’s Criminal Justice Statistics Center, California Crimes and Clearances Files, 2004–2013. Note: Violent crime includes homicide, rape, robbery, and aggravated assault.

(BOTTOM CHART) Source: Author calculations based on the California Department of Justice’s Criminal Justice Statistics Center, California Crimes and Clearances Files, 2004–2013. Note: Property crime includes burglary, motor vehicle theft, and larceny theft (including non-felonious larceny theft).

The Road Ahead for Superintendent Torlakson

In what was thought to be one of the most closely contested statewide races, incumbent Tom Torlakson defeated challenger Marshall Tuck to retain the job of state schools chief. In the post mortems, much will be made of the money that was spent on perhaps the most expensive race in this cycle. The conversation, undoubtedly, will focus in part on the significance that national groups attached to this race, which pitted the powerful teachers’ union against the “reformers.” Though there is some value to attempting to unpack the past, it is more important to look forward to the impact Torlakson could have on education in California in his second term.

Leading up to election day, commentators routinely described the state superintendent position as “powerless” or even “obscure.” And it is true that when it comes to making policy the state education chief plays a limited role. A great deal of policy has already been made, and what lies ahead is the difficult job of implementation. The superintendent could play a major part in deciding how these policies roll out. The California Department of Education (CDE) that Torlakson heads has more than 1,500 employees and a budget of $250 million dollars. How he chooses to allocate those resources could make a real contribution to supporting schools and districts as they grapple with major changes.

California has made more significant changes to K–12 education policy in the past four years than it made in the previous two decades:

  • In 2010, the state adopted the Common Core State Standards, a decision that affects nearly every element of what happens in the classroom.
  • In 2013, California scrapped its old system of distributing funds to schools and opted for a formula that directs additional dollars to districts with higher numbers of needy students. One consequence of this change was to put much more power in the hands of local decisionmakers.
  • Accompanying the new funding strategy is a new approach to holding districts accountable for the performance of their schools.
  • And if that isn’t enough, California has begun a new statewide testing regime that has, as yet, only been piloted. The first real round of tests will begin this spring, with results due out in the summer.

As my colleague Paul Warren and I recently observed, CDE has played a minimal role in guiding implementation of the new standards but there are several things it could do to ease the transition. There are also challenges ahead for the state when it comes to the new accountability requirements. Because the new rules were written broadly, they have probably raised more questions than they answered about what accountability looks like going forward. Finally, somebody needs to help students and parents prepare for the new test results. On average, scores are likely to be lower. That doesn’t mean that California’s children somehow became less smart over the past two years; it means that the tests are harder. This is an important distinction that will need to be communicated.

Policy implementation isn’t sexy. It is hard, roll up-your-sleeves work. If the superintendent embraces his role, he could have an impact on California education that goes far beyond symbolism.