How Are School Districts Spending Their LCFF Dollars?

Since the enactment of the Local Control Funding Formula (LCFF) in 2013–14, funding for K–12 education has risen to record highs. Much of the increase is due to the improved state economy, which has seen nearly a decade of continuous growth and led to dramatic expansions in the state budget. Even so, the LCFF has significantly altered the funding landscape, with the intention of providing more resources to the districts, schools, and students who need them most. Six years in, what can we say about how this system is faring?

Under the LCFF, districts with more high-need students (those who are low income, English Learners, homeless, or foster youth) have seen larger funding increases. Between 2013–14 and 2017–18, high-need districts (those with student populations that are at least 55% high need) increased student spending more than $500 more per-pupil than did lower-need districts (where fewer than 30% of students are high need). Districts with especially large shares of high-need students (80% or 90%) saw an even greater funding increase under the new funding formula.

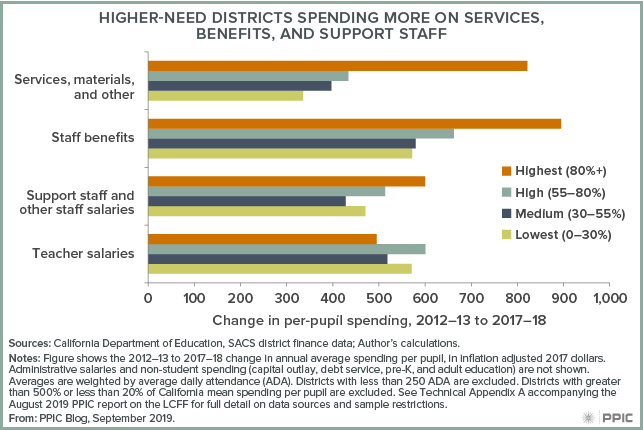
Are higher-need districts spending differently than lower-need districts? We can address this question by comparing the changes in spending between 2012–13—the year prior to LCFF’s enactment—and 2017–18, the most recent year for which K–12 financial data is available.

The data reveal two patterns of note. First, despite greater total increases, spending on teacher salaries actually grew more in lowest-need than in the highest-need districts: $570 per student in the lowest-need districts (where fewer than 30% of students are high need) vs $495 in the highest-need districts (where more than 80% of students are high need). Higher-need districts hired more teachers and saw greater reductions in teacher-pupil teacher ratios. However, a greater reliance on novice teachers (whose salaries are lower) reduced the overall spending increase among these districts. Benefits spending also increased by much more in higher-need districts, mainly due to the greater increases in staffing levels.

Second, higher-need districts have been spending more on support staff and other non-teaching staff. They have also spent more on services, materials, and other student spending (excluding capital outlay, debt service, pre-K, and adult education): these expenditures increased by $822 per student in the highest need districts, as opposed to $336 in the lowest need districts. Higher-need districts are most likely attempting to address the additional challenges that higher-need students face outside the classroom. The hope is that these additional services and support staff will translate into improvements in academic performance that will narrow achievement gaps. Research on similar reforms in other states suggests that this approach will eventually pay off.

figure - Higher-need Districts Spending More on Services, Benefits, and Support Staff

Currently, however, concerns are growing about whether additional funding is reaching the highest-need students within districts. Because districts are not required to report their school-level spending publicly, it is difficult to assess how this funding is allocated within a district. However, public staff records and salary schedules do allow us to examine differences in teacher spending across schools in the same district. Such comparisons show that districts tend to spend more on their highest-need schools but that the difference is modest.

Fortunately, federal requirements will soon make more comprehensive school-level spending data available. While we don’t yet know how accurate and comparable it will be, this data will bring new and much-needed transparency to our K–12 finance system.

Video: School Resources and the Local Control Funding Formula

The Local Control Funding Formula (LCFF) was enacted in 2013-14 with three major goals: to simplify California’s K–12 school finance system, increase local control over spending, and provide additional funding to districts with large shares of high-need students—those who are low income, English Learners, homeless, and/or foster youth. At a lunchtime event in Sacramento last Thursday, PPIC researcher Julien Lafortune shared key findings from a new report that looks at increased spending under the LCFF. Then, a panel of experts offered state and local perspectives on the successes and challenges of directing funding to high-need students.

The PPIC report offers new statewide evidence on how school resources have been affected by LCFF; it also examines the extent to which these resources are reaching the highest-need students. It finds that LCFF funding is, for the most part, reaching the high-need students for whom it was intended. But the funding formula imperfectly targets high-need students in lower-need districts.

Kent Kern, superintendent of schools for the San Juan Unified School District, highlighted the challenges of serving high-need students in a district with wide disparities across schools. At 54.5%, his district’s share of high-need students is just below the LCFF’s “high need” funding threshold; however, 19 of its 64 schools have shares of high-need students that are 80% or above. “One of my schools that’s actually at the 99th percentile is a mile away from a school in another district. If we received the same funding as that district got, [our] school would be generating $1.4 million more.”

Not surprisingly, Kern would welcome a change to the LCFF that could benefit the high-need students in his district: “I think there would be some threshold that would allow schools with high-need concentrations to get more money.”

From a statewide perspective, however, the LCFF’s district-level approach is important. Michael Kirst, professor emeritus at Stanford and a key LCFF architect, emphasized the importance of providing additional funding to districts with the highest concentrations of need, to help them address particularly difficult educational challenges: “I would continue to support the theory of concentration, though I realize there are tradeoffs.” Samantha Tran, senior managing director at Children Now, pointed out that when the LCFF was being developed, many stakeholders were concerned that a school-level funding model could create perverse incentives: “If a border line could be drawn that allows for deeper concentration that draws down more state dollars . . . that is not the policy we want in place. We don’t want to perpetuate segregation.”

Asked what they would change about the LCFF, Kirst and Tran agreed on the need for more money as well as greater transparency on spending. Kirst noted that “it takes more than money” to retain teachers and improve student outcomes, but there are clear links between spending and achievement. And Tran said that while she has “no interest in bean counting,” the state needs a clearer understanding of trends in spending and outcomes.

From both the state and the local perspective, the LCFF has been successful in focusing attention on high-need students. As Tran put it, “We’re actually having a conversation about high-need schools . . . that’s a success.” One of the biggest challenges, from Kern’s perspective, is that people expect “too much change too fast. . . . I think we just need to stay the course.”


K–12 Education and the New State Budget

The recently enacted 2019–20 budget allocates 28% of the total state budget for all K–12 education programs: $103.4 billion ($58.8 billion from the General Fund). Proposition 98, passed by the voters in 1988, establishes a minimum annual funding level for K–12 schools and community colleges. This year, the Proposition 98 funding level is $81.1 billion, bringing K–12 per-pupil expenditures to nearly $12,000. According to the Department of Finance, total per-pupil funding, including all federal, state, and local sources amounts to $17,423.

In addition, the rainy day fund requires the state to set aside savings for future education spending based on specific criteria, including General Fund tax revenue and Proposition 98 funding levels. This year, for the first time ever, the budget triggers a deposit into Public School System Stabilization Account at $376.5 million.

figure - K-12 Funding Is at a New High

The Local Control Funding Formula (LCFF) is the primary manner in which funds are distributed to support students. This year’s budget brings the total LCFF funding to nearly $63 billion, a $1.9 billion increase from last year, accounting for a statutory cost-of-living adjustment.

This year’s enacted budget also includes funding to address a wide range of concerns, including pensions, special education, and full-day kindergarten. For teacher pensions (CalSTRS), the budget pays down the state’s ($2.9 billion) and the districts’ share ($1.6 billion) of the unfunded liability. Another $500 million for fiscal year 2019–20 reduces by 1.03% school districts’ contribution rate to CalSTRS and CalPERS (pensions for public employees). The budget adds $350 million to reduce that contribution rate by an additional 0.7% in 2020–21.

The budget aims to mitigate rising special education costs to districts by adding more than $600 million to support students with disabilities.

A $300 million one-time payment goes to the Full-Day Kindergarten Facilities Grant program, which allows districts to construct new facilities or retrofit preexisting ones for the purposes of ensuring access to full-day kindergarten.

Despite the record funding level this year, two longer-term finance issues loom. The CalSTRS funding plan, as governed by AB 1469, has set school districts’ share of teacher pension costs to increase to 18.1% in 2019–20 and to 19.1% by 2020–21. While the budget’s funding toward the districts’ contribution rate will provide much-needed relief, growing pension costs will remain challenging.

Finally, in a time of growing costs, declining student enrollment is hampering districts across the state. Over the past five years, nearly half of all districts experienced enrollment losses—and this trend may continue over the next decade. Given that the state’s funding model is based on average daily attendance, declining enrollment is likely to persist as an important fiscal issue over the long run.

Budget Takes Baby Steps Toward Special Education Reform

The new 2019–20 state budget recently signed by Governor Newson provides significant new funding for K–12 special education programs. It also makes substantial revisions to the state funding model for services to students with disabilities—and signals policymakers’ intent to make even more extensive changes in this policy area next year.

Passage of the Local Control Funding Formula (LCFF) in 2013 generated questions about the fiscal and planning effects on local special education programs. Our work in this area (in 2016 and 2018) has found that district special education costs have risen much faster than state funding over the previous decade and has recommended several changes to make state funding more responsive to local costs. The new state budget includes two of our key recommendations:

  • Equalize special education funding. This year, $153 million was added to partially equalize per-pupil special education funding levels. Our report recommends equalizing local per-pupil funding rates up to the 90th percentile of current levels. Funding rates across Special Education Local Plan Areas (SELPAs) range from about $500 per pupil to more than $1,000. The new funding would bring the lowest local rate up to $557, which is about the 75th percentile of existing rates.
  • Fund early childhood special education. Another $493 million in this year’s budget will provide grants of about $9,000 for 3- and 4-year-olds who participate in special education preschool programs. State special education formulas fail to provide any state support for these children, and our reports conclude that the lack of funding could discourage districts from aggressively seeking children who could benefit from early services.

Because the new funding helps districts pay for their existing special education programs, these appropriations provide welcome fiscal relief. But the budget attaches a giant question mark to the long-term future of these new appropriations. Specifically, in 2020–21, the budget makes the two new grants conditional on broader special education reforms, and even holds out the possibility of revising those grants. Issues for further discussion include:

  • More changes to special education funding. Problems with the main special education funding formula were not addressed in this year’s budget. We have suggested the state peg annual budget increases to a better predictor of future costs, such as LCFF increases or past changes in special education costs.
  • Refining the role of SELPAs. We have also suggested giving districts greater leeway in determining how students with disabilities are educated, consistent with LCFF’s local control focus. SELPAs perform a wide range of services locally, including planning how students are served and supporting district special education programs that exhibit sub-par performance.
  • Improving local special education programs. The budget identifies two specific areas for attention: serving more students in their regular classroom (rather than in separate special education classes) and ensuring that student subgroups are not identified for special education in disproportionate numbers. By including this issue in the budget language, policymakers are signaling they want faster progress in these areas.

Will the Governor’s Budget Reduce the Heat on School Districts?

Last week Los Angeles district leaders reached a deal with public school teachers to end the city’s first teachers’ strike in 30 years, agreeing to higher teacher salaries, smaller class sizes, and more support staff. The strike was the culmination of long-brewing tensions over the amount and allocation of funds in California’s largest school district. Many other districts in the state are facing similar challenges, as the demand for resources grows faster than the available dollars.

Earlier this month, the governor’s first budget proposal acknowledged some of these broader difficulties. The 2019–20 spending plan proposes $3 billion in one-time payment to CalSTRS, the main teachers’ retirement system, on behalf of schools (separate from the General Fund K–12 spending determined by Proposition 98). The proposal also includes $1.1 billion to pay down a portion of the state’s share of the estimated CalSTRS liability.

The proposed $3 billion CalSTRS payment could take some financial pressure off school districts. Funding for schools is determined by two main formulas. First, total statewide funding is determined by applying a formula (Proposition 98) to the expected revenue from state and local property taxes. Then, another formula (the Local Control Funding Formula) is used to determine the bulk of the dollars available to individual school districts.

Distributing resources in this manner means local school districts, even one as large as Los Angeles, have limited control over the total amount of dollars they have to work with. But the demand for those dollars is constantly going up as districts find themselves paying more—overall and in particular areas such as special education services, health care premiums, and pensions. Pensions are especially challenging, as legislation passed in 2014 mandated that school districts’ share of teacher pension contributions would rise from 8% (2013) of their teacher payrolls to 19% by 2020. This increase will drive annual pension contributions to more than $1,000 per student in most local school districts.

How much relief might the governor’s proposed payment provide? The answer is some, but not much. The governor’s budget document states that the payment “will reduce the out-year contribution rate by half a percentage point.” Given that number, the expected relief amounts to an annual savings of around $25 per student. In large districts such as Los Angeles, this adds up to tens of millions of dollars annually, but districts with lower enrollment numbers will see more modest financial gains.

The CalSTRS payment proposal is a departure from prior state budgets. First, it represents an acknowledgment that, despite recent increases in total education spending, school districts still face fiscal challenges. Second, it proposes to direct non–Proposition 98 funds, making it a de facto increase in total K–12 resources. School district administrators are likely to appreciate both. However, the proposal still needs the legislature’s approval, and it’s not clear whether it would significantly relieve fiscal pressures on districts.

Whether the one-time CalSTRS payment represents a shift in future policy remains to be seen. If it is in fact only a one-time payment, the impact on the resources available to schools will be welcome but modest. It may, however, signal a different approach to education funding in the long run—something that would be worth watching.

Video: Analyzing the Standardized Test Results

California’s public school students did much better the second year they took new standardized tests, and the state is catching up to others that use the same Smarter Balanced tests. PPIC researchers Iwunze Ugo and Laura Hill take a close look at the test results in a new report, Student Achievement and Growth on California’s K–12 Assessments, which Ugo presented at a Sacramento briefing last week.

The researchers used two years of results to assess early implementation of two major statewide reforms—the Common Core curriculum and the new finance system that targets additional funding toward low-income students, English Learners, and foster youth. The PPIC report looks in depth at the test results for English Learners and economically disadvantaged students and finds that achievement gaps are not closing. Of particular concern are the districts and schools experiencing both low achievement and low growth in achievement between the first year and the second year of testing. This suggests that students who were already lagging their peers could be falling further behind.

The researchers conclude that struggling districts may need more guidance from the state—and might also look to schools and districts that have had success with high-need students.

Learn more

Read the report Student Achievement and Growth on California’s K–12 Assessments

Debate over How Special Education Is Funded

Last month the state Department of Finance held meetings in Los Angeles, Sacramento, Fresno, and San Mateo to get input on improving special education, the state’s largest K–12 categorical program. The Department of Finance asked PPIC to kick off these meetings with a presentation of findings and recommendations from our recent report on special education financing. The report calls for folding state special education funding into California’s new Local Control Funding Formula as a means of improving local flexibility and accountability. Currently, state and federal funds are distributed to regional administrative entities known as Special Education Local Planning Areas (SELPAs).

The one consistent theme at the public meetings was a call for more money from local educators and parents. Beyond that point of agreement, though, these discussions did not lay out a clear path for the state to follow in its effort to improve services for disabled students.

Our report is not the only one to call for major changes in special education. A study published by the Statewide Task Force on Special Education in 2015 concluded that California’s special education program suffers from “systemic dysfunction.” It says that, too often, students miss opportunities to grow because they are served in separate programs outside the regular classroom. The task force encourages changes at both the state and local level to integrate special education with the programs that serve nondisabled students. The report also recommends earlier services to children with disabilities, an integrated state and federal accountability system for special education, and more funding for local programs.

The Department of Finance staffers made it clear that the reports were a starting point, and that they were looking for suggestions about how to make special education more effective and efficient. Many who attended the meetings argued that special education is underfunded by both the state and federal government. Many also commented on the need to improve the way infant and preschool services for children with disabilities are funded.

PPIC’s recommendation to send funds to districts rather than SELPA was mostly opposed by the educators, parents, and administrators who spoke at the meetings. These participants often voiced support for SELPAs, and worried that our recommendations would hurt small districts or the network of regional services that SELPA funding supports. Larger districts, on the other hand, noted that they may bear a disproportionate cost of these small district subsidies and regional services. Several parents also voiced concerns about the proposed shift in funding, because they believe district administrators are less supportive than SELPA staff.

The meetings demonstrated the difficulty of developing a funding system that will be effective in every district in our large and diverse state. They underscore the logic behind the Local Control Funding Formula: Improving performance requires giving school districts greater control over critical program and funding decisions, but that control must be balanced by a broad accountability system and monitored by parent and community oversight. As we argued in our report, only school districts can address the systemic dysfunction of California’s system, and the state needs to give them the control and accountability to do so.

With the March outreach meetings concluded, the ball is in the Brown administration’s court. It will be worth watching whether the governor proposes any program changes during budget discussions later this year or in next year’s budget.

Learn more

Read the report Special Education Finance in California


Funding Special Education

California’s special education system serves almost 12% of public school students with yearly allocations of more than $12 billion from local, state, and federal funding sources. Despite changes in the numbers of students served and the nature of their disabilities, its finance system has not been addressed in a comprehensive way for more than two decades.

PPIC recently released Special Education Finance in California, a report examining the system in light of the principles that underlie the Local Control Funding Formula. These principles—which determine how K–12 funds are allocated—are local control and accountability, transparency, and equity. The PPIC report also draws on the 2015 Statewide Special Education Task Force, which envisioned a seamless program of student services that is part of a unified system of general and special education. The PPIC authors recommend changes that can help achieve this vision.

At a well-attended Sacramento event held in conjunction with the release of the PPIC report, coauthor Paul Warren summarized the way the special education finance system works now and outlined PPIC’s recommendations to change it. A panel of education experts then took up the issue. They concurred that it is time for a change.

“The kids can’t wait,” said Kim Conner, whose experience includes being the parent of a child with special needs. “We’ve waited a long time. It’s easy for us to say from a fiscal standpoint, we don’t have money, we don’t know enough . . . But we know so much. We can do this.”

Michael Kirst, president of the California State Board of Education, said the PPIC report is helpful in understanding the current system, which “has some underlying rationales but no overall rationale. It is an accretion of different things.”

“It is very hard to understand, how the money flows, who makes decisions, he said. “It is not adjusted sufficiently for student needs . . . It is inequitable.” Calling the PPIC report “bold and provocative,” he said it “should certainly should kick off a really deep discussion on change.”

Mary Samples, assistant superintendent of the Special Education Local Plan Area in Ventura County, said a key topic in the discussion of change needs whether enough funding is allocated for special education. Samples, who served as chair of the finance subcommittee of the Statewide Special Education Task Force, said, “I don’t think that moving the money from one bucket to another solves the problem. The problem is adequacy of funding.”

Three Bills Signal State of Education Policy

In this year’s busy legislative session, Governor Brown signed 316 of the nearly 800 education-related bills sent to his desk. The bills made relatively small changes on a range of issues from local parcel taxes to school disciplinary policy.

In recent years, a series of reforms—including passage of the Local Control Funding Formula (LCFF), adoption of the Common Core State Standards, and the shift to the new computer-based Smarter Balanced tests—have constituted a significant transition for the state’s 6.2 million public school students. These changes were designed to target K–12 funding for students with the greatest needs and focus teaching on the development of critical-thinking skills. Rather than signing off on legislative changes to these reforms, the governor has opted to continue their implementation while shifting some attention to challenges on the horizon.

A review of the fates of three bills, the state budget, and recent administrative actions helps illustrate the current state of education policy in California:

  • Aligning state and federal accountability rules. Earlier this year, the State Board of Education adopted a new accountability system for evaluating the progress of schools and districts in the eight priority areas—including parental involvement, school climate, and student achievement—laid out in the LCFF. The governor vetoed Assembly Bill (AB) 2548, which would have compelled the state board to align the accountability system with new federal regulations requiring the state to intervene in the lowest-performing 5% of schools. By using multiple measures, the state’s system takes a more holistic view of student achievement. But this approach makes it difficult to assign a number to each school in order to identify those that need the most help—putting it at odds with the federal government. The governor resisted changing course with his veto, but the state may need a waiver to meet the federal requirement.
  • Addressing the teacher shortage. The budget included several teacher workforce initiatives to address the state’s looming shortage, including financial assistance for classified employees interested in teaching and grants to universities encouraging four-year teacher credential programs. The governor signed AB 2248, allowing those with out-of-state credentials to teach English Learners in California. This relatively small change—which addresses one of the subject areas with an acute teacher shortage—stood out in contrast to related legislative efforts that failed, like a bill that would have provided student loan forgiveness for teachers who serve in schools with the most needs.
  • Preparing California’s students for the future. The governor also signed AB 2329, creating a 23-member advisory panel tasked with developing a strategic implementation plan to expand access to courses in computer science—a critical field for the 21st century economy. The plan would lay out the standards for a computer science curriculum and increase the number of computer science teachers, with the goal of ensuring access for all students.

These examples show that as the implementation of major education reforms continues, the governor has focused on making small tweaks to the state’s system and laying the groundwork for the coming years. As California’s leaders look toward the future, it is vital that they build a robust educational system that will be able to address both near- and long-term challenges.

Early Results from Education Reforms

California’s K–12 system is implementing an unprecedented number of reforms. The state’s school funding system and curriculum standards are new, as are all statewide tests. A new school accountability system is being developed. A number of large urban districts are changing their high school graduation requirements. These reforms are designed to equalize opportunities for students and close achievement gaps among demographic groups.

It will be some time before we know what all of these changes add up to, but PPIC researchers who examined the early results of two reforms presented their findings at a PPIC event in Sacramento last week.

California’s New Standardized Tests

PPIC senior fellow Laura Hill summarized the results of California’s new standardized tests, the focus of a PPIC report she coauthored. The scores show that English Learners and economically disadvantaged students are far behind other student groups—possibly farther behind than initially thought. As the accountability system evolves in the state, the test results are an important call to action for districts and schools struggling to help high-need students, Hill said. High-need students did well in some schools and districts, and the first-year results provide an opportunity to learn from their experiences.

College Prep for All?

Julian Betts, an economics professor at the University of California, San Diego, and PPIC adjunct fellow, examined a high school graduation requirement that makes college preparatory courses mandatory for all students. Major urban school districts—including Los Angeles, San Diego, San Francisco, and Oakland—recently implemented this requirement, making it mandatory for students to complete the a–g sequence of classes required for admission to the University of California or California State University. Based on a PPIC analysis of the San Diego Unified School Districts’ Class of 2016, Betts and his coauthors concluded that this requirement is likely to help many students but damage the prospects of others. He suggested steps that San Diego and other districts can take to help lower-achieving students meet the new graduation goals.

Learn more

Visit PPIC’s K–12 education pages
Visit the PPIC Higher Education Center