Low Crime Numbers Leveling off Under Shelter-in-Place

After large decreases in March, the latest numbers on crime in the wake of COVID-19 mostly point towards a leveling off, with continuing lower rates for four California cities—Los Angeles, Oakland, San Diego, and San Francisco. There are a few exceptions, such as commercial burglaries, which rose by about 37%.

Swings in crime numbers stem from many factors under any conditions, and certainly during a pandemic.  With improved weather and possible shelter-in-place fatigue, more people—potential victims and perpetrators—are out. The dire economic situation may be a factor, while state and local directives, such as zero bail, an issue of heightened concern within law enforcement, may be another.

Data on crime in these four large cities cover rates through April 2020. They represent preliminary numbers that are subject to revision before they are submitted to the California Department of Justice as part of the state’s official crime statistics. Furthermore, the numbers do not represent all of California.

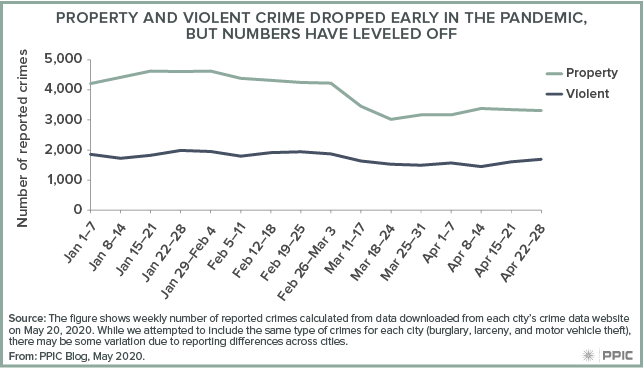
A closer look shows that violent and property crimes broadly leveled off in April, after falling from February through March. In particular, violent crimes fell from 1,881 in February to 1,603 in March, and then came down slightly to 1,580 in April—a decrease of 16% since February. For property crimes, the number dropped from 4,294 in February to 3,399 in March, then fell somewhat further in April to 3,302, for a total February-to-April drop of 23.1%.

Figure - Property and Violent Crime Dropped Early in the Pandemic, but Numbers Have Leveled Off

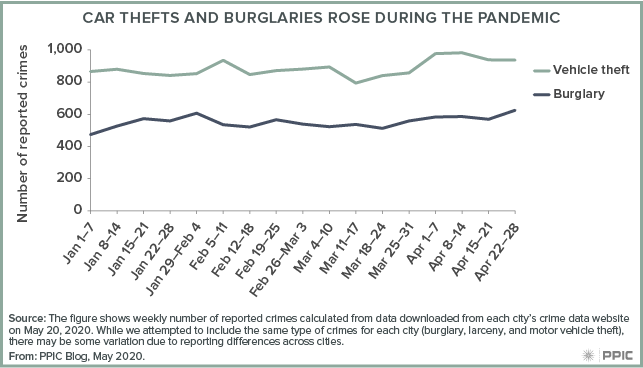
Within these broader categories, some crime was on the uptick in April. While burglaries fell by 1.3% from February to March, the weekly number rose by 9.3% in April compared to February. This increase is primarily driven by commercial burglaries, up by 21.2% in March relative to February and up by 37.5% in April, again relative to February. Car theft is also up: after declining by 4.2% between February and March, it rose in April and is now 8.5% higher than in February.

Figure - Car Thefts and Burglaries Rose during the Pandemic

The changes in crime numbers vary across these cities. For example, while commercial burglary is up in all four cities, the rise in vehicle theft is driven by Los Angeles, where the number of stolen vehicles increased from 352 to 363 and then 468 in February, March, and April; or up 32.9% compared to February. In Oakland, reported assaults rose in April; after dipping to 96 per week in March—from 116 in February—the average weekly number of assaults climbed to 129 in April. And while still below pre-pandemic numbers, assaults in Los Angeles in late April were higher than in March, up from 766 to 805 on average per week.

As crime in these four cities seems to be hovering at low rates, at or below the pre-pandemic numbers, there is no evidence yet that efforts like zero bail, which went into effect April 13, led to broad increases in crime. However, as some crimes are on the uptick, they deserve attention to determine whether they are part of common swings in crime numbers or early signs of reversing trends. If reversals are indicated, now is the time to identify contributing factors and investigate effective solutions.

What COVID-19 Budget Cuts Mean for Public Safety Spending

State funding aimed at programs and supervision for some jail inmates in jails and others on probation will drop sharply as a result of the COVID-19 crisis. While spending on the state correctional system will decrease less than 1% under recently announced cuts to the California state budget, funding for counties may drop 24%.

Probable cuts now loom over local budgets as well, and spending on local public safety may fall significantly.  Although lower jail populations during the pandemic could create budget savings, there may also be a higher need for re-entry and community-based services as released individuals return to communities.

In 2011, California enacted sweeping changes to its correctional system to address federal court orders to alleviate severe overcrowding in the prison system. This public safety realignment shifted correctional responsibilities for tens of thousands of offenders, from state prison and parole systems over to county sheriff and probation departments.

To fund the shift, the state created the local community corrections account, with money drawn from a dedicated portion of state sales tax revenue. Voters issued a constitutional guarantee for that portion of tax revenue when they passed Proposition 30 in November 2012. But while the percentage of revenue was guaranteed, the actual amount of sales tax collected can vary. The amount is now changing because of the COVID-19 crisis.

Counties were meant to use these funds to provide supervision and programming to individuals who were realigned from the state to the counties. More specifically, the state expected counties to fund cost-effective, evidence-based programming that improved offender rehabilitation and public safety in local communities. Such programming might include day reporting centers, expanded jail training programs, or specialized courts that handle individuals with drug dependency or mental health disorders.

Each county had the freedom to implement programs that best suited their situation. Community Corrections Partnerships (CCPs)—headed by the chief probation officer, with representatives from law enforcement, health and human services, and community organizations—provide realignment plans and recommend where to allocate funding.

Realignment funding grew 47% from $930 million in 2012–13 to $1.37 billion in 2018–19. In state budget estimates from before COVID-19, sales tax revenue rose steadily, with the local community corrections fund expected to increase to $1.54 billion for fiscal year 2020–21.

Figure - Estimates for Realignment Funding Change with the Pandemic

However, the pandemic weakened the economy—in updated state budget estimates, the governor predicted a drop in sales tax revenue of more than 27% for 2020–21. The local community corrections account is now estimated to receive only $1.17 billion—a 24% decrease from the earlier estimate and 14% below the 2018–19 fiscal year.

Because revenues are paid to counties monthly, local agencies will feel the effect of sinking revenues almost immediately. The fiscal situation undoubtedly poses challenges for successful community re-entry programs; it is more important than ever to evaluate policies and programs that to lead to cost-effective solutions.

Special Elections Preview Fall Voting during COVID-19

Given the risk of transmitting the novel coronavirus, Governor Newsom has mandated that all California voters receive a vote-by-mail ballot for the November election; socially distant in-person voting options are being worked out. This approach was taken for two recent special elections—one in Congressional District (CD) 25 in north Los Angeles and eastern Ventura Counties, and one in State Senate District (SD) 28 in Riverside County. Both were runoffs, and both first-stage elections coincided with the March 3 presidential primary. Some observers are looking to these elections as test cases for November.

Over the past 30 years, when one stage of a special election has coincided with a regularly scheduled election and the other has not, the stand-alone election has always had lower turnout. On average, the difference has been 25%. In the May run-off election, however, turnout in the LA portion of CD 25 was slightly higher than turnout in March (38%, compared to 36%, as of May 19).

LA County was able to offer in-person voting as an option in both elections because it had already replaced traditional polling places with a smaller number of in-person “vote centers” open to all voters in the county. That may explain some of the strong turnout, but the shift away from polling places was more abrupt in the Ventura portion and turnout increased from 51% to 55%. And Riverside’s SD 28, where the shift was also sudden, saw only a modest drop in turnout (44% to 38%).

We should be careful not to draw too many conclusions from these numbers. Some of the turnout dynamics reflect the competition in each race. In CD 25 in particular, the runoff was unusually interesting for Republicans compared to the March 3 primary, so many more were probably motivated to vote.

More important, the fall will be a very different experience, involving more than 40 times as many voters in all 58 counties with a wide range of backgrounds. The scale of the response must expand to match. Neither Ventura nor Riverside was able to offer in-person voting. That has to change for the fall. Voters who prefer to cast ballots in person tend to come from populations that are already underrepresented. The question is not whether but how many in-person voting sites can be made available.

Nonetheless, the strong turnout in these special elections is a hopeful sign. There is still much work to be done, but it may be possible to conduct a fall election that is both safe and fair.

Public Higher Education in California Faces a Fiscal Crisis

[vc_row][vc_column][vc_column_text]As the coronavirus pandemic continues to disrupt California’s economy, the Newsom administration is projecting a $54 billion decline in state revenues for the 2021 fiscal year and revising the budget accordingly. California’s public universities—which do not have dedicated funding streams or constitutional protections—face disproportionately large funding cuts. So far, the federal government has provided some emergency relief to mitigate the pandemic’s unprecedented impact on higher education. Without additional support, however, the state’s public colleges might have to reduce student access and services.

During the Great Recession, a drop in state revenues of $40 billion in 2009 led to cuts equaling roughly one-third of state funding for the University of California (UC) and California State University (CSU) systems (on a per student basis). Consequently, tuition doubled at UC and CSU, faculty and staff were laid off or furloughed, and critical capital improvements and maintenance were deferred.

In turn, students faced reduced access to courses, higher student-faculty ratios, increased costs, and fewer support services. As the economy improved, the state was able to increase allocations to the state’s colleges. As a result, UC and CSU admitted thousands of additional students, graduation rates went up, and the number of degrees awarded increased substantially.

figure - General Fund Expenditures for UC and CSU Dropped Sharply in the Great Recession

Early evidence suggests that the global pandemic could have an even more dramatic fiscal impact on public higher education in California. In the short-term, public colleges face critical revenue shortages: now that students have been sent home and instruction has moved online, revenues from auxiliary enterprises (housing, food, parking, etc.) have evaporated. In addition, UC has suspended elective surgeries at its medical centers and is incurring costs associated with research and treatment of the coronavirus. CSU has projected revenue losses of $337 million for the spring semester, while UC projects a $500 million loss for the month of March alone.

In the longer-term, the systems may find it challenging to raise additional revenues. The percentage of out-of-state students—who pay higher tuition—is now capped at 18% for the five most popular UC campuses, and enrollment of international students is likely to decline due to visa and travel restrictions. Endowment funds are shrinking and tuition increases are controversial. Moreover, unprecedented levels of unemployment will increase demand for federal, state, and institutional financial aid programs.

Governor Newsom’s May budget revision includes a 10% cut for each public higher education system. The revised budget proposal also reduces state financial aid for students who attend nonprofit private colleges from $9,084 to $8,056 per year. The budget proposal does allow UC and CSU to redirect some restricted revenues and to refinance debt at historically low interest rates. However, without additional revenue–whether through federal or state support, or tuition increases—it will be difficult to improve access, quality, and student success in the coming years.[/vc_column_text][/vc_column][/vc_row]

The Economic Toll of COVID-19 on Small Business

[vc_row][vc_column][vc_column_text]Fifty-six percent of California small businesses experienced “large negative” effects from the pandemic, according to a recent Census survey—a survey that includes businesses with up to 500 employees. Sectors hit hardest by initial job loss face the most severe setbacks. As small businesses weather closures brought on by COVID-19, policy efforts to support them will be important for the state’s economic recovery.

Ninety-five percent of businesses are very small businesses with less than 50 employees, and these businesses employ one-third of California’s workers. Unemployed Californians will need workplaces to return to after the state recovers—small and very small businesses are a common place for workers to land.

In response to the pandemic, about three-quarters of small businesses in hard-hit sectors, such as food service and entertainment, have had to take dramatic measures. That is, today business owners in these sectors are much more likely to have laid off employees, decreased employee hours, or suffered revenue losses since mid-April, compared to other sectors.

Compounding these struggles, many small businesses have already missed scheduled payments such as rent, utilities, or payroll. The impact has been particularly stark in accommodation and food services, where nearly two-thirds of business owners have missed payments since March 13.

Figure - Small Businesses in Hardest-Hit-Sectors Face Mounting Challenges

Very small businesses are more likely to be owned by women and nonwhite Californians than larger businesses.  Latinos own 11% of these businesses but only 2% of larger businesses. Similarly, Asians own 23% of very small businesses versus roughly 10% of larger businesses. In California, women run 22% of such businesses, compared to 7% of larger businesses.

Within the industries hit hardest by COVID-19, very small businesses with less than 50 employees have even higher rates of Asian, Latino, and women ownership. In particular, one-third in this heavily affected sector—for example, restaurants and retail—are Asian-owned. Women also own 26% of very small businesses in these industries; another 20% are jointly owned by men and women.[/vc_column_text][/vc_column][/vc_row][vc_row max_width=”80″ visibility=”visible-desktop”][vc_column][vc_column_text][infogram id=”1pj99903epwez1i6zzgjry1njeamvd0vkmz?live”][/vc_column_text][/vc_column][/vc_row][vc_row max_width=”80″ visibility=”visible-tablet-landscape”][vc_column][vc_column_text]

[infogram id=”1pj99903epwez1i6zzgjry1njeamvd0vkmz?live”]

[/vc_column_text][/vc_column][/vc_row][vc_row visibility=”visible-tablet-portrait”][vc_column][vc_column_text]

[infogram id=”1pj99903epwez1i6zzgjry1njeamvd0vkmz?live”]

[/vc_column_text][/vc_column][/vc_row][vc_row visibility=”visible-phone”][vc_column][vc_column_text]

[infogram id=”1pj99903epwez1i6zzgjry1njeamvd0vkmz?live”]

[/vc_column_text][/vc_column][/vc_row][vc_row][vc_column][vc_column_text]Despite policymaker concerns about the survival of small businesses, initial efforts to provide assistance have fallen short of expectations. Over 88% of California small businesses in accommodation and food services applied for federal assistance through the Paycheck Protection Program (PPP), yet only 27% received any support. For other federal programs like Economic Injury Disaster Loans (EIDL) and Small Business Administration (SBA) Loan Forgiveness, less than half of the businesses in hard-hit industries that requested funding received any.

Policies to help these businesses manage the current downturn will influence the state’s economic recovery. Small businesses employ many of California’s workers, and small business ownership offers a path to economic mobility and success. In addition, young businesses—many of which are small—play a particularly important role in job creation.

While federal assistance will remain critical, state and local efforts can help fill the gap. Because some communities lack sufficient resources, state efforts to provide financial assistance through the Small Business Loan Guarantee Program are a step in the right direction.[/vc_column_text][/vc_column][/vc_row]

How the Pandemic Has Disrupted Food Chains

The COVID-19 health emergency has changed what we eat and where we eat it. We talked with Dave Puglia, president and CEO of Western Growers (which represents family farms growing fresh produce) and a member of the PPIC Water Policy Center advisory council, about how these changes are affecting California’s agricultural sector.

photo - Dave Puglia

PPIC: How has the pandemic affected food supply chains?

DAVE PUGLIA: The pandemic shut down the food service sector—restaurants, schools and universities, hotels—so suddenly and completely that it just blew up supply chains. This caused many farmers to divert their produce from food service outlets to retail markets. That added more confusion to the food chain, as certain commodity prices dropped like a stone due to oversupply, while some other crops did quite well, fueled by people buying more produce that is less perishable. Foods like carrots, onions, and potatoes have been flying off the shelves.

Those first few weeks were incredibly damaging to American agriculture, and particularly the fresh produce industry. California’s desert region was in full swing for harvesting when the shutdowns began. I watched one of my members plow 350 acres of romaine lettuce into the ground. A lot of fresh produce made it to food banks—our members doubled the amount they usually ship to them—but we saw some food banks wave off perishable fresh produce, which requires adequate cold storage space and must be distributed quickly. For growers, transportation was an added cost.

We’re not out of the woods yet. The food service sector is still largely shut down. California’s coastal farms are now starting to harvest. They had to project a month ago how much crop to plant without knowing if restaurants will be open, half open, or still closed. And for those with permanent crops—table grapes, nuts, and stone fruits—their crops are coming. They’ll have to make these same tough decisions about whether it pencils out to pay for the labor, shipping, and cooling costs to harvest their crop. To put it in perspective, harvesting—which includes labor and energy—comprises about half the costs to produce, say, an acre of lettuce.

Farming has always been a risky business, but this has created an impossible guessing game for growers in fresh produce.

PPIC: What can be done to help get more farm products to emergency food programs?

DP: The top priority is to inject capital into the food system now. Ideally, the federal government would increase food purchases so we can deliver more produce to food banks and organizations that serve people in need. The CARES Act began to fund this, but the amount was small—$600 million over six months, across the whole country. That won’t buy a lot of food. The quickest way to help is to dramatically increase funding to this program.

At the state level, increasing the tax credit for food going to food banks could help. Currently, California has a 15% tax credit on the value of produce that the state’s farmers deliver to food banks. Clearly, the state needs every tax dollar it can get, but if we’re trying to keep farmers going so they can continue to grow our food and support the economy, that would be a good way to help.

PPIC: What further steps would mitigate the damage?

DP: The immediate need is for the federal government to expand its agricultural relief package in the CARES Act. The caps on the relief package were not practical for fresh produce, dairy, and cattle. Growers got $125,000 per farmer, which was appreciated—but it’s a very small amount given the losses for the higher value crops, which cost more to produce. For example, a farmer growing romaine lettuce spends about $10,000 per acre. The average-sized lettuce farm is 225 acres; the relief package covered losses for about 12.5 acres of that. Strawberries cost roughly $50,000 per acre to produce; the relief package covered just 2.5 acres of lost production on the average 55-acre farm.

The state has been helpful in crafting practical guidance for continued operation of our farms, which helped the industry implement distancing very quickly. We have a big challenge there, as these folks work and live in close quarters. It was also very helpful that the governor acted quickly on our request to help farmworkers with emergency childcare. These are mostly families where both parents work and don’t have the option of a parent staying home with the kids.

Going forward, I hope that coming out of this crisis we don’t see a raft of new regulatory costs. The cost of doing business in California is already quite high. If the cost of farming here compared to Mexico or Arizona gets much higher, it will incentivize more farmers to relocate.

PPIC: What changes to California agriculture do you envision coming out of this crisis?

DP: Farmers are amazingly adaptive people, and I’m encouraged by the many California farms that are finding new, more efficient ways of operating and producing food because of this crisis.

Will there be fewer restaurants in two years’ time, or will Americans have returned to their previous habits of eating out? No one knows. But growers will adapt to changing demand, and they’ll respond very quickly.

COVID-19 Highlights the Need for Statewide Student Data

The pandemic makes it clearer than ever that California would benefit from a data system that links information across educational institutions. Without it, California policymakers will continue to lack important information—including insights into the impact of the coronavirus pandemic on our students and educational institutions.

Better data would help determine who is most affected by the pandemic, where to direct support, and how to prepare for future crises. For example, is the pandemic affecting key educational transitions of some students more than others? Some regions more than others? Where should the state best direct its resources to ensure students keep moving through the educational pipeline? Right now, these questions cannot be fully answered.

The governor’s office remains supportive of building a statewide data system, and the state’s Cradle to Career Workgroup is still aiming to deliver a proposal to the legislature by the end of 2020.  At its most recent meeting, the workgroup endorsed creating a multifaceted system, including data tools for the general public and researchers, as well as ways for practitioners, students, and families to link data regarding transitions to and between colleges.

The workgroup also endorsed including early childhood data, to focus on early determinants of educational success and align with the governor’s focus on early childhood care. Over the summer and fall, the workgroup will decide on proposals that define the scope of the system, ensure privacy and security, and govern access.

Balancing the state’s need for connected data with the current economic downturn may be difficult. However, forgoing all of the recent progress could indefinitely stall this important effort, not only hampering the flow of critical information but also leaving the state flying blind during the next crisis.

PPIC will continue to participate in an advisory capacity for the Cradle to Career Workgroup and will also convene the California Education Data Collaborative to aid and inform the state in creating a useful data system that helps students and provides valuable direction for the state—during good times and bad.

Will Groundwater Sustainability Plans End the Problem of Dry Drinking Water Wells?

In the midst of the COVID-19 crisis, work continues on managing groundwater for long-term sustainability, as required by California’s landmark Sustainable Groundwater Management Act (SGMA). In January, water users in 21 critically overdrafted basins delivered their groundwater sustainability plans to the state Department of Water Resources. In this series, we examine the 36 plans submitted for 11 critically overdrafted basins in the San Joaquin Valley—California’s largest farming region, where excess pumping is a major challenge.

Why are drinking water wells going dry in the valley?

In the San Joaquin Valley, groundwater is the primary source of drinking water. While groundwater levels in the valley have generally been declining for decades, the problem of overdraft—which can cause shallow wells to run dry—is particularly acute during droughts as surface water supplies for irrigating crops are limited. This especially affects domestic wells and small community wells, which tend to be shallower than those used for irrigation or large urban water systems. During the 2012–16 drought, 2,600 well-dependent households reported water shortages across the state; almost 80% of these were in the San Joaquin Valley. We estimate that the valley’s total number of dry domestic wells was likely higher (see map below, on left). Many small community wells also faced shortages.

Does SGMA protect wells from running dry in the future?

SGMA was enacted to address the negative consequences of groundwater overdraft. Declining water levels is one of the six undesirable results that plans must avoid. Local agencies are tasked with setting minimum water level thresholds to avoid effects that are “significant and unreasonable”—something that can vary with local conditions.

Allowing some flexibility is important, because very restrictive thresholds would require immediate and costly cuts in groundwater pumping. Yet in many places, additional water level declines can render shallow drinking water wells useless. If agencies choose to allow continued pumping to avoid major disruptions in the regional economy, they are required to mitigate any significant and unreasonable effects. Options include covering the costs of drilling deeper wells or providing an alternative water supply.

How do groundwater plans address risks to domestic wells?

The plans reflect a range of approaches—as shown in the map below, on the right. In several basins, plans set water level thresholds to protect domestic wells from going dry. Some other plans acknowledge that their thresholds might cause some wells to go dry, and these already have a mitigation program in place or propose considering mitigation in the future. Plans in the remaining basins either do not discuss the potential impacts their thresholds have on domestic wells or do not consider these impacts to merit action. This includes the Kings Basin—home to a dense network of well-dependent communities—where three plans acknowledge that roughly 600 domestic wells may go dry, but do not consider this a significant and unreasonable impact of continued overdraft.

figure - Many Plans Do Not Consider Protections for Domestic Wells

Is mitigation a good alternative?

Chowchilla and Madera basins also have some domestic wells at risk and have conducted economic analyses to compare the costs of two alternatives: rapidly reducing agricultural pumping to maintain higher water levels, or replacing domestic wells that would be affected. At a cost of $25,000 per well, the full costs of replacing affected domestic wells in Chowchilla ($130,000) and Madera ($770,000) are orders of magnitude lower than the costs of reducing agricultural pumping sooner ($581 million in Chowchilla and $968 million in Madera). This shows that it can be more cost effective for a basin to provide assistance to domestic well owners than to set restrictive water level thresholds that would result in large and abrupt losses in the local economy.

What’s next?

Although SGMA doesn’t protect every well from going dry, it does require plans to consider this problem and mitigate significant and unreasonable effects. At a minimum, the state should require that each plan quantify the impacts of its water level thresholds on drinking water supplies.

Increasing community participation in groundwater planning efforts is another priority. And as groundwater sustainability agencies grapple with how to bring their basins into balance over the coming decades, better information will also be key to improving decision making and reducing conflicts. The Department of Water Resources began releasing well records several years ago. The next priority should be improving understanding of which wells are used for drinking water, which wells are abandoned, and other critical information.

Many shallow wells serve economically disadvantaged communities, making the stakes especially high. Because the San Joaquin Valley has a high share of water systems with water quality problems, it’s also important to consider solutions that address both water quality and water quantity whenever possible. In many cases, providing alternative sources of supply may be the best option for affected communities.

Sinking Lands, Damaged Infrastructure: Will Better Groundwater Management End Subsidence?

In the midst of the COVID-19 crisis, work continues on managing groundwater for long-term sustainability, as required by California’s landmark Sustainable Groundwater Management Act (SGMA). In January, water users in 21 critically overdrafted basins delivered their groundwater sustainability plans to the state Department of Water Resources. In this series, we examine the 36 plans submitted for 11 critically overdrafted basins in the San Joaquin Valley—California’s largest farming region, where excess pumping is a major challenge.

What is subsidence, and why does it matter?

Excess groundwater pumping can compact soils, causing land to sink. Because this subsidence can damage costly infrastructure, avoiding it is an important reason to manage groundwater.

Subsidence due to groundwater pumping has been occurring in the San Joaquin Valley for almost a century, but it accelerated during the 2012–16 drought. Subsidence has damaged some critical water conveyance arteries, including the Friant-Kern Canal (40% of capacity lost in some stretches), and the California Aqueduct (more than 20% of capacity lost). Bridges over these and other canals are sinking, a local dam can’t hold water anymore, and stretches of the high-speed rail track have been designed to prevent damage from future subsidence.

Subsidence can also permanently reduce the capacity of aquifers to store water. Valley aquifers may have lost as much as 3.25% of their capacity from soil compaction during the 2012‒16 drought.

This infrastructure damage doesn’t just affect the individual farms or water agencies that are pumping groundwater—it affects other parties, both locally and many miles away. Mitigating damage will cost many millions, if not billions, of dollars.

How does SGMA require plans to address subsidence?

Under SGMA, land subsidence is one of the six undesirable results that every groundwater sustainability plan should seek to avoid. Plans must define indicators to track subsidence over time, and set thresholds to avoid “significant and unreasonable” impacts.

In principle, this framework allows plans to be more tolerant of continued subsidence in places that will not incur as much damage—for instance, in areas without major infrastructure. Local pumpers have an interest in this flexibility, because avoiding subsidence generally requires significantly curtailing groundwater use, and this curtailment is especially costly during droughts. But to be sure they are not causing harm, plans need to consider the consequences of subsidence for other parties—many of whom are not part of the local groundwater planning process.

Are the plans taking adequate steps?

In practice, the plans vary widely in their approaches to addressing subsidence. In several areas where infrastructure has already been damaged, agencies are setting thresholds to avoid additional subsidence. For instance, in the Chowchilla basin and parts of Delta Mendota, goals include avoiding further damage to local conveyance infrastructure and to levees that provide flood protection. But most plans set thresholds that are not tied to specific past or future impacts. And many of these thresholds are quite high—allowing the rates of land subsidence observed during the recent drought. This raises the risk of future harm, even in areas that have not yet experienced damage.

The figures below show subsidence rates over the past five years—which included both wet and dry years—alongside the cumulative amount of subsidence that the plans would allow over the next two decades. Recent subsidence rates are measured using satellite data, funded by the Department of Water Resources. Many plans are giving themselves a lot of leeway over the next 20 years, in some cases accepting 10–15 feet of additional subsidence. Even the lower thresholds in some sensitive areas might not end infrastructure problems and conflicts. For instance, the Friant Water Authority has warned that plans in the Tule basin will further reduce capacity in the Friant-Kern Canal, significantly affecting downstream water users. Similarly, the Department of Water Resources found that an additional 2.1 feet of subsidence in some sections of the California Aqueduct could further harm downstream water users. This is roughly one-third of the maximum amount allowed in the vicinity of the aqueduct by the Westside basin plan (6 feet).

figure - Plans Allow Significant Subsidence to Continue in the San Joaquin Valley

What’s next?

The valley’s groundwater plans are at an early stage in tackling land subsidence. One important next step will be strengthening the information base for effective management. The paucity of public monitoring data raises challenges for local efforts. Continued state support for annual valley-wide surveys using satellite data could reduce overall monitoring costs and facilitate early identification of subsidence hotspots. The state should also press water users to provide more robust assessments of the risks of future subsidence in their plans.

Overcrowded Housing and COVID-19 Risk among Essential Workers

[vc_row][vc_column][vc_column_text]Some Californians face substantial risk of illness within their own households under the state’s shelter-in-place order. Physical distancing and self-isolation can be virtually impossible in crowded homes, threatening the health of entire households. In crowded living conditions, individuals are at higher risk of transmitting infectious diseases, a factor that may challenge the state’s efforts to manage the pandemic while reopening the economy.

As the high cost of housing is a stark reality for nearly two-thirds of Californians, finding affordable housing can mean cohabiting with several other people. California’s overcrowding rate is well above the national average; the share of housing units with more than one occupant per room is 8.3% compared with 3.4% across the nation. Furthermore, overcrowding is much more common among renters than homeowners (13.4% vs. 4.0%), and in Latino households (18.4% vs. 2.4% of white households).

While most Californians have been staying home to reduce coronavirus transmission, essential workers do not have the option to shelter in place. Over one-third of California’s labor force works in essential occupations that require being physically present. Compared to nonessential workers, they are at higher risk of infection because they continue to circulate among others despite the shutdown.

Essential workers are more likely than nonessential workers to live in overcrowded housing—16 percent versus 12 percent. That share is almost double for workers in farming (31%), and food preparation/serving (29%).

Figure - Workers in Essential Jobs May Live in Overcrowded Households

A recent study confirms that essential workers and those in larger households do face a higher risk of contracting coronavirus. It would be ideal to explore the relationship between COVID-19 cases and workers living in crowded conditions. However, inconsistent testing availability across regions makes cases an unreliable measure of the virus’s geographic spread; deaths, which are better measured, are a valuable proxy.

There is a clear link between COVID-19 deaths and essential workers who live in overcrowded homes, though the relationship is muddied by regional differences in terms of the age structure of the population,  underlying health conditions, and other factors. Santa Barbara (25%), Madera (23%), Los Angeles (21%), Orange (20%), and Tulare (19%) counties have the highest shares of essential workers in overcrowded homes. Los Angeles and Tulare are experiencing large numbers of deaths per capita, at 14 and 9 deaths per 100,000 people, but the other counties are not.[/vc_column_text][/vc_column][/vc_row][vc_row max_width=”80″ visibility=”visible-desktop”][vc_column][vc_column_text][infogram id=”1p375951mzw3k9c0mex60d30kdidymqxjlx?live”][/vc_column_text][/vc_column][/vc_row][vc_row max_width=”80″ visibility=”visible-tablet-landscape”][vc_column][vc_column_text]

[infogram id=”1p375951mzw3k9c0mex60d30kdidymqxjlx?live”]

[/vc_column_text][/vc_column][/vc_row][vc_row visibility=”visible-tablet-portrait”][vc_column][vc_column_text]

[infogram id=”1p375951mzw3k9c0mex60d30kdidymqxjlx?live”]

[/vc_column_text][/vc_column][/vc_row][vc_row visibility=”visible-phone”][vc_column][vc_column_text]

[infogram id=”1p375951mzw3k9c0mex60d30kdidymqxjlx?live”]

[/vc_column_text][/vc_column][/vc_row][vc_row][vc_column][vc_column_text]California will lift some shelter-in-place restrictions in the coming days, and more people will leave their homes to work. Examining work and living conditions together can identify areas where people are least able to take effective actions against the spread of the coronavirus. Designing policies to protect the health of workers and their households will be critical to managing COVID-19 while restarting the state’s economy.[/vc_column_text][/vc_column][/vc_row]