Video: Californians and Education

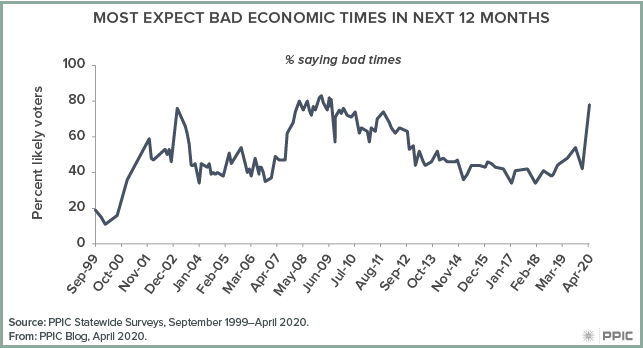
In the era of COVID-19, about eight in ten adults fear getting sick, and 80% expect bad economic times ahead. At a virtual briefing on Thursday, PPIC researcher Alyssa Dykman said the drop in consumer confidence “is unprecedented in the history of the PPIC survey.”

The event featured Dykman, who presented attitudes on K–12 education, funding, and policy preferences along with concerns over the coronavirus pandemic in the latest PPIC statewide survey. PPIC President and CEO Mark Baldassare supplied deeper context for key findings and responded to online questions.

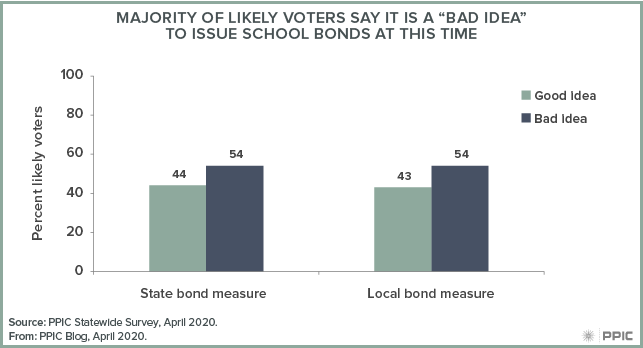
Approval ratings have hit rare numbers: at 78%, approval has surged for Governor Newsom’s handling of K-12 education, and at 92%, public school parents express overwhelming support for school district handling of school closures. COVID-19, however, has shaken support for school bonds, with about half or fewer adults and likely voters saying it’s a good idea now for state government to fund school construction projects.

Baldassare underscored Californians’ concerns around health and finances, stating that two-thirds of adults are worried about both. Many say their lives are disrupted and about half say the stress is affecting mental health.

What do these concerns mean for California schools? “People are giving state leadership and local leadership a lot of leeway in how they respond to the public health and economic crisis,” Baldassare said. But the state will see its first test of this extraordinary support in May, when the governor submits a revised budget that will reflect revenue loss from a sharp economic downturn.

That may also lead to roadblocks for state and local school funding in November. In the March primary, “the defeat of most of the local school bond measures really caught a lot of people by surprise,” Baldassare said. “It was difficult to pass school funding measures.” At the moment Californians are hesitant to commit more funding to schools, which may impact voting on the split-roll property bond measure and others in the November election.

The survey offers several takeaways around planning for California public education. “We’ve never had anything like the school closures that are taking place,” Baldassare said. He reflected that Californians may reconsider the value of teachers going forward, including whether “teachers have the resources they need in order to do the job,” and noted that the public may have “a new understanding of the important and difficult role teachers play every day in the lives of public school children.”

Californians also may now recognize the struggles of vulnerable students, especially in terms of online access.

“It is going to be a test of Californians’ political will,” Baldassare said, “the degree to which we are committed to improving student outcomes, particularly among the large numbers of English language learners and low income students across the state.”

School Funding, COVID-19, and the 2020 Election Year

This post is excerpted from Mark Baldassare’s prepared remarks for the PPIC Statewide Survey virtual briefing on April 23, 2020.

State funding for K–12 public schools will take center stage when Governor Newsom unveils revisions to the state budget in a few weeks. The growing fiscal toll of the COVID-19 crisis is likely to affect school funding plans as a deep economic recession looms. K–12 schools have the largest share of the state General Fund, and many Californians say it is their top priority for state spending. Still, California voters seem to be pulling back their support for school funding on ballot measures.

One of the biggest surprises in the March 3 primary was the defeat of the Proposition 13 state school bond (53% voted no). The last time a state school bond failed to pass was back in 1994. Proponents have tried to explain away this loss as confusion caused by the number 13—the same as the notorious anti-tax initiative that passed in 1978.

However, outcomes of local school bond measures point to a different story. Bucking recent trends, 63% of local school bonds on the March primary ballot failed to reach the 55% threshold needed to pass. It may be that early anxieties about COVID-19 resulted in voter caution about extending debt. In the absence of exit polls to validate this theory, the April PPIC Statewide Survey sheds light on what may have happened. It also offers sobering news for efforts to convince voters to support school funding measures in the November election.

First, though, let’s dispense with the notion that views about school funding have fundamentally shifted. Today, 55% of California likely voters say that state funding for their local public schools is not enough. And 53% would vote yes on a state school bond while 50% would vote yes on a local school bond. Moreover, 53% percent would vote yes on a split roll property tax to fund local public schools—a measure that appears headed for the November ballot. All of these results today are similar to those last April, suggesting that basic attitudes about school funding are fairly stable.

But current conditions appear to be having a strong effect on the timeframe for public support. Our survey was conducted from April 1 to 9—roughly a month from the primary and a few weeks into stay-at-home orders. We find that most likely voters say it is a “bad idea” to issue state (54%) or local (54%) school bonds at this time. Majorities of Californians without children in public school agree (bad idea: state 56%, local 57%). Fewer than half across the state’s regions say it is a good idea to issue these bonds now. Only those with children in public school think that it is a good time to issue state (57%) or local school bonds (58%).

figure - Majority of Likely Voters Say it is a “Bad Idea” To Issue School Bonds at this Time

Why? Californians have had their world shaken by the COVID-19 crisis. Since January there has been a 36-point increase in expectations for bad economic times in California over the next 12 months (42% to 78%)—sending us to depths of consumer pessimism not seen since the Great Recession. And right now, 74% percent are worried about negative impacts of the coronavirus on their personal finances.

figure - Most Expect Bad Economic Times in Next 12 Months

This pessimism is likely to have profound implications for school funding measures on the November ballot. The state’s fiscal and economic problems will weigh heavily on voters’ minds when they are asked to make decisions on spending, taxes, and bonds. Many may be reluctant to ask taxpayers (like themselves) to foot the bill, or to increase commercial property taxes, to make up for shortfalls in school funding.

We can also expect a rocky road ahead for the governor and state legislature. Although our April survey found a steep rise in the governor’s and legislature’s approval ratings around handling K–12 public education, state leaders now face the prospect of having to cut back on popular plans to increase school funding. During the Great Recession, we saw the governor’s and legislature’s approval ratings tumble with state budget cuts to local schools.

Our surveys will be closely monitoring all of these dynamics as California heads toward a much-anticipated November presidential election.

Voting Matters to Most Californians, but Many Don’t Show Up

Most Californians see voting as critical to a healthy democracy. In our February Statewide Survey, overwhelming majorities of adults (86%) and likely voters (96%) said voting in the 2020 elections is very important, a view held among those registered (90%) and not registered (76%) to vote.

However, while most hold this view, we know that 85% of California adults are eligible to vote but only 70% are registered. Low political participation is cause for worry in and of itself. If a small electorate does not represent the population—as is the case in California—there is even greater cause for concern.

Today, California’s adult population is 42% white and 35% Latino; the remainder are Asian American (15%), African American (6%), and other (3%). Yet 57% of California likely voters are white—only 20% are Latino, and the balance are Asian American, African American, and other. The percentage flips among nonvoters: 56% are Latino and only 22% are white.

figure - Likely Voters Do Not Represent California’s Diversity

And while a third of adults are foreign born, 83% of Californians who frequently vote in state elections are US born. Among nonvoters, 34% are US born (California Department of Finance 2019).

Differences between likely voters and nonvoters sharpen along age and socioeconomic lines. Frequent California voters are age 45 and older (65%), own their home (64%), have attended (39%) or graduated (41%) college, and have annual household incomes of $60,000 or more (59%). Nonvoters are younger than age 45 (65%) and renters (65%); about one in five are college graduates, and one in four earn $60,000 or more.

The political attitudes of voters and nonvoters also differ markedly and often reflect their socioeconomic conditions. Although the many nonvoters in the state may make their preferences known in public opinion surveys on issues, the views of likely voters prevail at the ballot box, when they decide on important matters that affect all Californians.

For example, single-payer healthcare has been a topic of robust discussion leading into the Democratic primary. In California, a split has emerged between nonvoters and likely voters over the question of whether health care coverage should be the responsibility of the federal government. While most nonvoters (72%) say it is the government’s responsibility, fewer likely voters (55%) hold this view.

figure - Nonvoters View Healthcare as a Government Responsibility

On Election Day, it’s important for all Californians eligible to vote make their voices heard. The state has made participating in elections more seamless than ever—even those not yet registered can take advantage of same-day voter registration at a local polling place. Californians overwhelmingly believe in the importance of elections. Today is the day to act on that belief.

Video: Californians and Their Government

In California’s March 3 primary, the state ballot will feature several initiatives—including a $15 billion bond for the construction and modernization of public education facilities. Slightly more than half of likely voters approve, while 42% are opposed and 8% are undecided. PPIC researcher Dean Bonner outlined this and other key findings from the latest PPIC Statewide Survey at a briefing in Sacramento last Friday.

In November, Californians may be asked to vote on a constitutional amendment that would require state and local governments to provide housing or shelter beds to all homeless residents. About six in ten adults and 55% of likely voters say they would vote yes on such an amendment. Majorities of adults and likely voters also support Governor Newsom’s proposal to allocate $1 billion to address homelessness.

Other survey highlights:

  • More than six in ten Californians say housing affordability is a big problem in their part of the state, and the cost of living is causing many to consider moving out of California.
  • A majority of Californians (53%) approve of the way Governor Newsom is handling his job; this is the governor’s highest approval rating to date.
  • Views on the governor’s plan to scale back the high-speed rail project are mixed, while most approve of his proposal to build only one tunnel under the Sacramento–San Joaquin Delta.
  • Bernie Sanders leads all other Democratic presidential candidates with 32% support among Democratic primary likely voters. Joe Biden has 14% support, 13% support Elizabeth Warren, and Pete Buttigieg and Michael Bloomberg were tied at 12%.

Electability Matters in the Democratic Primary

Californians will head to the polls next Tuesday for the Democratic primary—and over 2 million have already returned their mail-in ballots. As Democratic and independent (also known as no party preference) voters prepare to choose their presidential nominee, the question arises: do they care more about electability or a candidate’s position on the issues?

Electability seems to edge out issue position for likely voters. According to our February 2020 survey, choosing the candidate most likely to defeat Donald Trump is more important to nearly six in ten Democratic primary likely voters (57%), while one in three (33%) say nominating a candidate whose positions on the issues come closest to theirs is more important. Findings were similar in our November 2019 survey (55% electability, 36% issue positions).

This view is widely held among Democratic primary likely voters, with at least half across nearly all demographic groups saying electability is more important. Among the lone outlier group—likely voters age 18 to 44—half think the candidates’ positions on the issues is more important.

figure - What’s More Important to Likely Voters in a Democratic Nominee?

There is a connection between a likely voter’s priorities and support for specific candidates. Among those who rank candidate positions on issues as more important, 43% support Bernie Sanders; fewer support Pete Buttigieg (13%), Elizabeth Warren (11%), Joe Biden (9%), or Michael Bloomberg (7%). For those who rank electability as more important, Sanders is also the top choice with 24% support, but he is followed closely by Biden (16%), Bloomberg (16%), Warren (15%), and Buttigieg (12%).

As Californians prepare to cast their votes at the polls—and continue to send in mail ballots—electability will be on the minds of many, and it could play a role in deciding who the Democratic Party nominates to run in the fall.

Californians Are Grappling with Homelessness

In his State of the State address last week, Gavin Newsom focused almost exclusively on homelessness—a significant long-term problem and major concern for state residents. In 2019, 150,000 Californians—more than a quarter of the US homeless population—were counted as homeless. California’s rate of homelessness rose to 38 per 10,000 residents, the third highest in the nation.

What is more, 72% of California’s homeless residents are unsheltered, living on the street or in parks and other makeshift spaces. And nearly three in ten self-report as chronically homeless—having been on the streets for more than a year.

Figure: California's Homelessness Crisis is Longstanding
Californians across the state are feeling the gravity of this issue. The latest PPIC Statewide Survey finds that more than 8 in 10 Californians see homelessness as a problem in their part of the state (86% adults, 89% likely voters).

figure -

Considering these numbers, it does not come as surprise that Governor Newsom has made homelessness a major focus. Citing the connection between chronic homelessness, mental health, and behavioral health, Newsom has underlined the importance of policies and investments that allow for “whole person” care. By linking current funding sources and asking lawmakers to expand the use of funds for services provided to the homeless population—especially those involved with the criminal justice system and at-risk foster youth—the governor hopes to improve and integrate these services.

The PPIC Statewide Survey finds that a full 70% of Californians—and 64% of likely voters—favor the governor’s proposed $1 billion budget expenditure to address homelessness. State leadership and investment are key, but there is only so much that can be done at the statewide level. Finding solutions to homelessness requires coordination between the federal, state, and local levels, as well as collaboration across sectors—including housing, health, and social services.

Concerns about Poverty and Income Inequality Are Running High

Even as California’s economy is surging—with unemployment at a historically low 3.9% last month—residents around the state are worried about poverty. About eight in ten adults say that poverty is a big problem (49%) or somewhat of a problem (33%) in their part of California. Likely voters hold similar views (47% big, 35% somewhat). This concern is high across every region of the state.

figure - Californians around the State Are Concerned about Poverty

Income inequality has grown substantially across the nation, and it is particularly notable in California. About two in three adults (63%) and seven in ten likely voters (68%) think the gap between rich and poor is getting larger in their part of California. Across regions, nearly half to three-quarters of residents hold this view.

figure - Most Californians Think the Gap between Rich and Poor Is Growing

California’s Independent Voters and the Presidential Primary

Independents may play a central role in the March primary, as they now comprise the second-largest voting bloc in California. The share of Californians registered as independents, also known as “decline to state” or “no party preference” (NPP), was 26.7% of registered voters as of October—up from 24% at the same point before the last presidential primary. With independents a growing faction, it is critical to understand these voters and their motivations.

In PPIC’s November Statewide Survey, 28% of registered voters were independents. About six in ten say they have always been an independent voter, while four in ten say they previously registered with a major party—with 56% naming the Democratic Party and 40% the Republican Party. Today, about half of independent voters (48%) consider their views closer to the Democratic Party, while fewer say the Republican Party (24%) or neither party (22%).

When asked the main reason they are registered as an independent and not as a member of a political party, a plurality (39%) say they are not satisfied with the parties and they do not reflect their views. Another 15% say they vote for candidates, not parties, and 8% vote for both Democrats and Republicans.

figure - Reason for Registering as an Independent

In California, political parties decide whether independents can vote in their presidential primary, and three political parties allow it: the American Independents, Democrats, and Libertarians. One in four independent voters in our November survey plan to vote in the Democratic primary, while about half say they will vote on the nonpartisan ballot.

Independents seeking to vote in the Republican presidential primary must re-register to vote with that party. Without registering as a Republican, independents will be unable to cast a vote for President Trump or potential challengers in the Republican presidential primary. (Members of the Green or Peace and Freedom parties must also re-register with and request a ballot from the major party of their choice.)

Independents who want to vote for US president in the primary must request a ballot with presidential candidates on it; otherwise, they receive a nonpartisan ballot. Although the deadline to request a ballot has passed, independents can still exchange their ballot at a local elections office or re-register with another party.

PPIC will continue to track voter and party profiles in 2020, with a focus on the state’s evolving independent voting bloc.

Unfavorable Ratings for Political Parties Persist among Californians

How do Californians view the two major political parties in this era of hyper-partisanship? In our recent survey, 47% of adults and 46% of likely voters report a favorable impression of the Democratic Party and 31% of adults and 34% of likely voters report a favorable impression of the Republican Party. In expressing their relative discontent with how these two parties represent the American people, a majority of adults (54%) and likely voters (57%) say a third major party is needed.

Since we first asked about party favorability in March 2010, positive views of the parties have rarely exceeded 50% and impressions have remained steady among adults and likely voters. Although favorability toward the Democratic Party sits below 50% overall, it rose among certain groups, including African Americans (52% 2010, 71% today), those with annual household incomes of $40,000 to $80,000 (39% in 2010, 49% today), and college graduates (39% in 2010, 48% today). Party favorability remained stable across all other regions and demographic groups.

For the Republican Party, favorability has increased somewhat among Central Valley residents (30% 2010, 38% today) but declined somewhat among 18 to 34 year olds (32% in 2010, 24% today). However, favorability is steady among all other regions and demographic groups.

figure - Favorability of Political Parties over Time

While less than half of adults and likely voters hold positive views about either major party, majorities of partisans continue to regard their party well. Favorability has climbed among party members since 2010 (Democratic 68% 2010, 76% today; Republican 54% 2010, 77% today). Among independents, impressions of both parties remain similar to 2010, but about six in ten independents, who comprise more than a quarter of the California electorate, report a poor impression of both parties (60% Democratic, 63% Republican). Notably, today, 21% of adults and 14% of likely voters have an unfavorable view of both parties.

With both parties facing mediocre ratings, about half or more of California’s residents have consistently called for a third major political party since October 2006. Today, just one in three adults (34%) and likely voters (32%) think that the two major parties do an adequate job representing the American people. About half or more across parties and regions—and a plurality among demographic groups—feel a third major party is needed, with independents (62%) and those earning over $40,000 annually (62%) most likely to hold this view.

figure - Nearly Half or More Californians Think a Third Major Political Party Is Needed

As the electorate changes, and as the 2020 election landscape develops, PPIC will continue to monitor Californians’ views on the major political parties.

The Democratic Presidential Primary: What Do Californians Care About?

Mark Baldassare, PPIC president and CEO, and director of the PPIC Statewide Survey, participated in a panel on election issues at the Pacific Chapter of the American Association of Public Opinion Research meeting on December 6, 2019 in San Francisco. This post is excerpted from his prepared remarks.

Californians are turning their attention to the March 3 Super Tuesday primary as they play a new role in deciding the next Democratic presidential nominee. This is unfamiliar territory for California’s Democratic primary voters, who have become accustomed to casting ballots in June after other states have already determined the winner of their party’s presidential sweepstakes.

The 2019 PPIC surveys have consistently identified three frontrunners—Joe Biden, Bernie Sanders, and Elizabeth Warren—with no clear favorite. At the same time, likely voters have signaled an openness to considering alternatives. In this context, the debates loom large, and eight in ten likely voters in the September PPIC survey say they are important (41% very, 43% somewhat) in deciding their vote.

What do California’s Democratic primary likely voters most want to hear from the candidates as the stage is being set for a December 19 Democratic debate in Los Angeles? In an open-ended question in the November PPIC survey, the top four issues mentioned are health care (21%), the environment (14%), jobs and the economy (13%), and immigration (12%). Several other issues—such as education, homelessness, housing affordability, gun control, crime, and taxes—are each mentioned by less than one in ten likely voters.

figure - Top Issues for Likely Voters in the Democratic Primary

Across demographic groups, likely voters differ on the issues that matter the most. For instance, voters age 45 and older want to hear about health care more often than younger voters do (26% to 13%), while Latinos want to hear about immigration more often than whites do (24% to 5%), and whites want to hear about the environment more often than Latinos do (23% to 4%). Jobs and the economy is the only top issue generating a similar amount of interest across age, education, gender, income, race/ethnic, and regional groups.

The issues of greatest concern also vary according to candidate preference. Biden’s supporters name health care more often (25%), Warren’s supporters mention the environment more often (26%), and Sander’s supporters name immigration more often (22%). By contrast, supporters of the three leading candidates are similarly likely to mention jobs and the economy (13% Sanders, 11% Biden, 7% Warren).

One area of strong consensus? Views of President Trump. In the November PPIC survey, 91% of California Democratic primary likely voters say they disapprove of President Trump and 84% support his impeachment and removal from office.

When asked what’s more important, nominating a candidate who seems most likely to defeat Trump or one whose positions on issues are closest to theirs, 55% want to defeat Trump, while 36% want alignment on positions. Since the May PPIC survey, support for impeachment (65% to 84%) and the importance of nominating an electable candidate (48% to 55%) has risen.

figure - What’s More Important to You in a Democratic Nominee?

Those who say that electability is most important, compared with those who say policy positions are most important, are more likely to mention health care (25% to 15%) and less likely to name immigration (7% to 18%) as the issue that they most want to hear about in the presidential debates. We find no differences between these two voter groups in the mention of the environment or jobs and the economy. Interestingly, education (11% to 2%) is noted more often among those who say that alignment on the issues is more important to them.

The Los Angeles debate is the next big opportunity for the presidential candidates to connect with California voters whose preferences are still being formed. Many Democratic primary likely voters already report that they are closely following the election news, but the debate could still result in an expanded electorate—and a scrambling of the race—if candidates connect with voters on issues that matter the most to them.

Throughout 2020, PPIC surveys will be monitoring what is likely to be an historic year for voter participation, as Californians engage in a consequential primary and a highly anticipated general election.