Video: A Conversation with Governor Gavin Newsom

Governor Gavin Newsom’s conversation with PPIC president Mark Baldassare last week focused on energy policy and climate change. After noting that it had been one year since PG&E declared bankruptcy, Baldassare asked the governor about his vision for the future of California utilities. Newsom responded by broadening the question. “We have to start thinking about our energy future and our transportation future and our low-carbon, green growth future in a collaborative mindset.”

In this context, he continued, “PG&E’s bankruptcy has turned out to be an extraordinary opportunity for this state. . . . It’s allowed us to ask questions . . . that otherwise weren’t front and center.” PG&E, he said, has to come out of bankruptcy with a vision for the future that prioritizes long-term thinking and public safety rather than shareholder return. The bottom line? California needs a “transformatively different” utility. And, he added, “if PG&E can’t do it, we’ll do it for them.”

Key to planning for the state’s energy future is making sure it works for all Californians. Going green, Newsom said, “can’t mean more income inequality.” It has to benefit both the “haves” and the “have nots”—creating jobs and ensuring affordable energy, and mitigating the dislocation that comes with change.

Another key area is wildfire mitigation and prevention. Newsom noted that the 2019 fire season was less damaging than other recent seasons, in part because “we’ve never been more prepared.” The state has been investing in new technology that monitors and predicts wildfires, as well as equipment for suppressing fires and responding to crises.

Wildfire prevention is complex, in part because, as Newsom pointed out, the federal government owns the majority of forest land in California. “We are doing the job the federal government is no longer doing,” Newsom said, adding that “the Trump administration’s budgets have been proposing cuts to forest management.” Land-use patterns are another complicating factor. New building codes have helped recently built housing survive fires, but there are a large number of older buildings in fire-prone areas.

As Newsom sees it, the challenge of implementing the state’s ambitious climate mandates is to bring politics and policy into alignment. “Politically, I recognize that what’s necessary may be impossible. But also I recognize from a policy perspective that what is impossible has to become necessary.” The ultimate goal, of course, is to move California forward: “The world is changing. We have to change with it.”

Concerns about Poverty and Income Inequality Are Running High

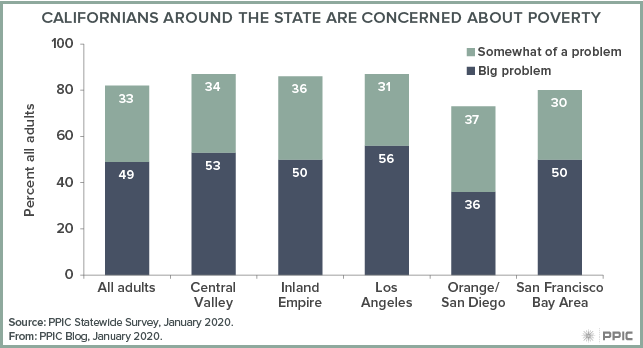
Even as California’s economy is surging—with unemployment at a historically low 3.9% last month—residents around the state are worried about poverty. About eight in ten adults say that poverty is a big problem (49%) or somewhat of a problem (33%) in their part of California. Likely voters hold similar views (47% big, 35% somewhat). This concern is high across every region of the state.

figure - Californians around the State Are Concerned about Poverty

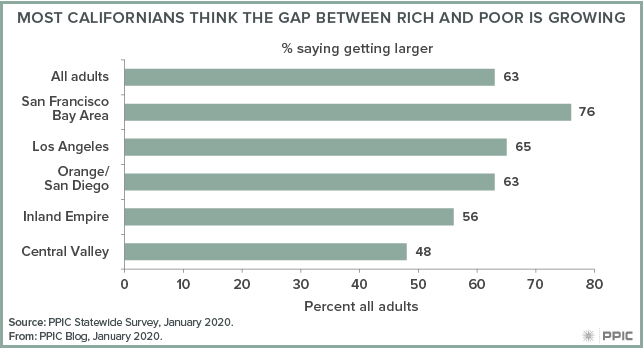
Income inequality has grown substantially across the nation, and it is particularly notable in California. About two in three adults (63%) and seven in ten likely voters (68%) think the gap between rich and poor is getting larger in their part of California. Across regions, nearly half to three-quarters of residents hold this view.

figure - Most Californians Think the Gap between Rich and Poor Is Growing

Leveling the Playing Field in College Admissions

Recent news of wealthy parents allegedly paying bribes to get their children into elite colleges has raised a lot of questions about the college admissions process. While fewer than 100 students were involved—out of more than 1 million new college freshmen every year—the scandal brings up larger issues of equitable college access and high income inequality in California.

More than half of Californians (53%) say qualified students from low-income families have less opportunity than other students to get a college education, according to a 2018 PPIC survey. Even without resorting to bribery, there are many advantages that students from high-income families have in college admissions, including living in safer neighborhoods, attending better high schools, and having more help preparing for the application process (e.g., paying for SAT or ACT prep courses). Admission practices at most private colleges also favor students who can pay the full price of attending.

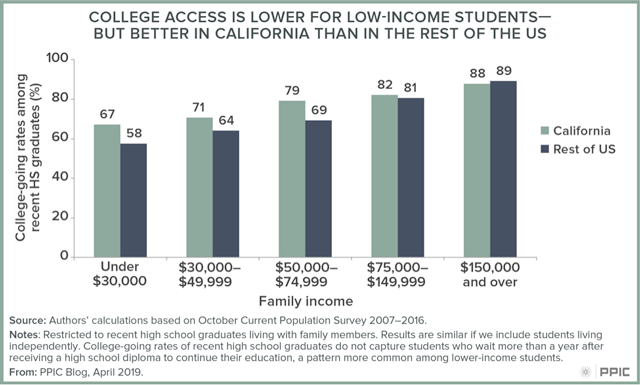
Our recent report on economic mobility and higher education highlights the challenges facing low-income students in California—but also offers some hope. Although recent high school graduates from low-income families are less likely to enroll in college than students from higher-income families, a greater percentage of low-income students go to college in California (67%) compared to other states (58%). Enrollment gaps between low- and high-income students in California (21 percentage points) are also substantially lower than in the rest of the country (31 percentage points).

Figure 1: College Access is Lower For Low-Income Students--But Better in California Than In the Rest of the US

California’s large public higher education system is key to ensuring broad access. The University of California (UC) enrolls more low-income students than any other public research university system in the country. Indeed, applicants from disadvantaged backgrounds are given extra consideration in UC’s “holistic review” process. Thirty-eight percent of UC undergraduates in 2016–17 received Pell grants (federal grants to low-income students), compared to 26% of undergraduates at public research universities in the rest of the country.

California State University (CSU), the largest public university system in the country, provides even more access than UC. Almost half (49% in 2016–17) of CSU students receive Pell grants. California’s private nonprofit colleges also play an important role, with 29% of their undergraduates receiving Pell grants.

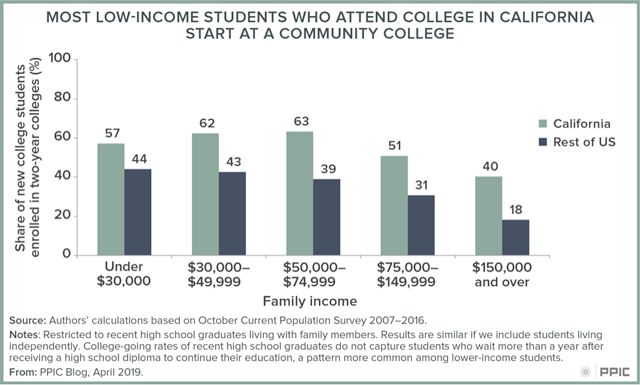
But perhaps most important are California’s community colleges. More than half of low-income students who attend college in California start at a community college.

Figure 2: Most Low-Income Students Who Attend College in California Start at a Community College

Although college access for low-income students in California is relatively good compared to the rest of the nation, more can be done. For example, improving financial aid would make college more accessible to more low-income students and would likely lead to higher graduation rates. And because so many low-income students start at community colleges, increasing transfer rates is critical to ensuring that higher education continues to serve as a ladder of economic mobility. New reforms at the community colleges—including changes in remediation and the Associate Degree for Transfer program—should lead to substantial increases in transfer and help more students achieve their academic and economic goals.

Geographic Variation in Poverty across California

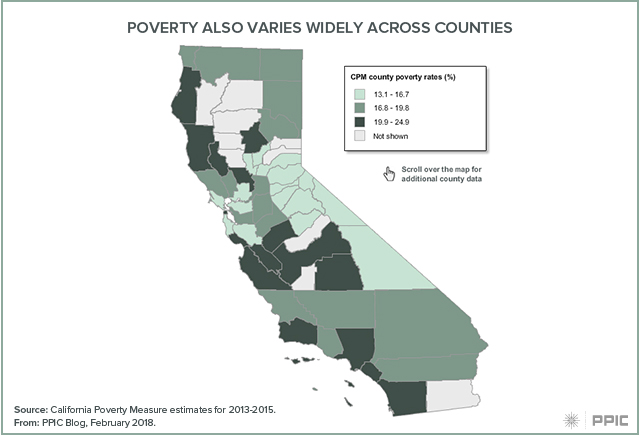
Each year, when we update the data on poverty in California, we remark on how widely poverty rates vary across counties. In Los Angeles County, 24.3% of residents are poor, compared with just 11.8% of those in El Dorado County, according to the California Poverty Measure (CPM). The CPM is a collaboration between PPIC and the Stanford Center on Poverty and Inequality that adjusts for regional housing costs and incorporates resources from major social safety net programs.

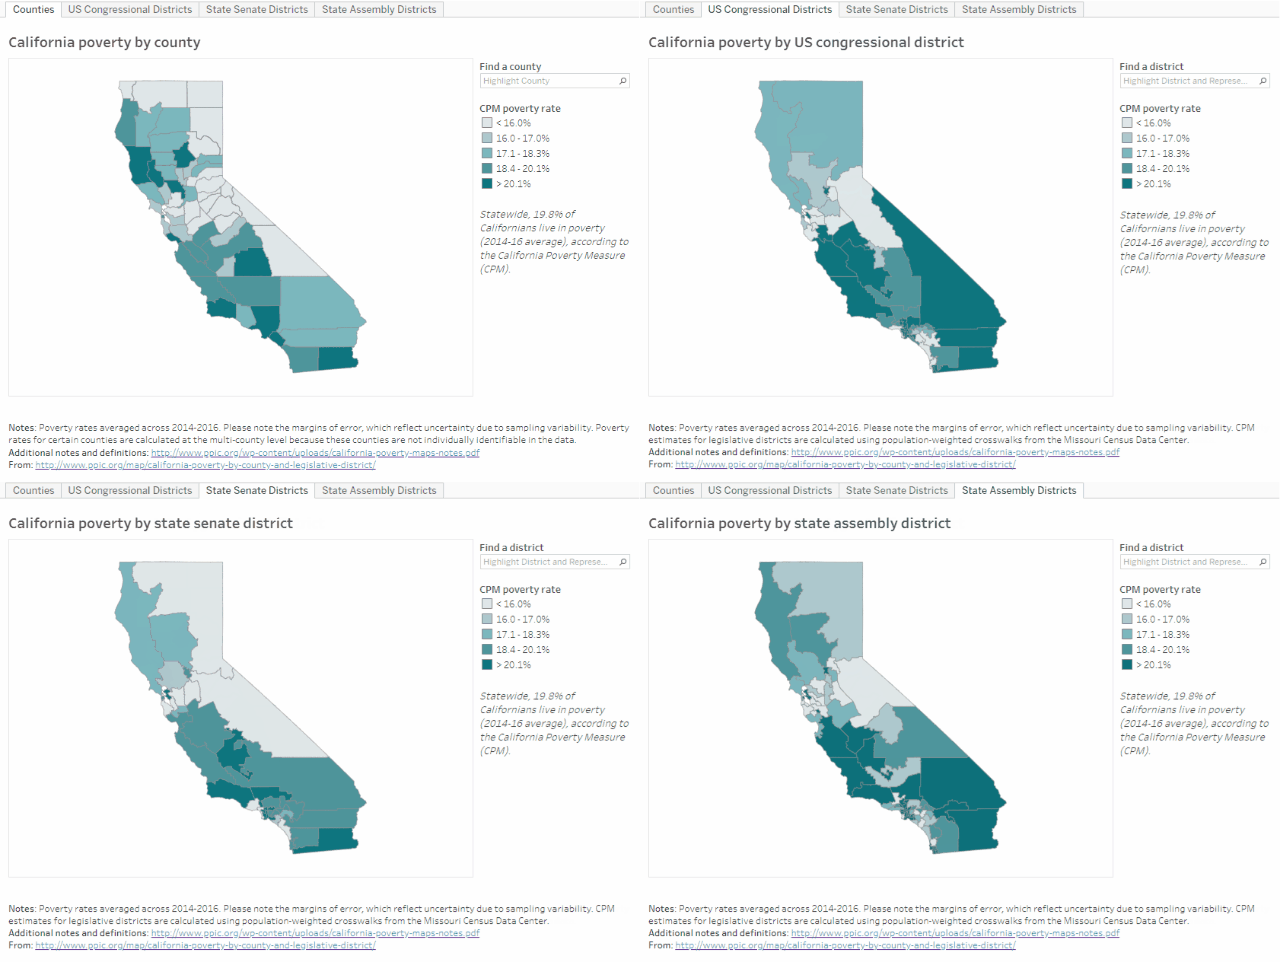
Our new interactive maps highlight the dramatic variation in poverty across counties and US congressional, state senate, and state assembly districts. Overall, the maps show high rates of poverty in coastal and southern California, and lower rates in the northern and Sierra regions. This pattern is driven by a variety of factors: poor families in coastal, urban regions can earn relatively higher incomes, but this is often outweighed by high costs of living and reduced eligibility for safety net programs. In contrast, high poverty rates inland and along the north coast are driven by low incomes and limited employment—despite substantial poverty reduction by the social safety net.

These maps allow leaders from counties—where social safety net programs are often implemented—and legislative bodies—where program funding is allocated—to learn more about poverty and the impact of the safety net in their region.

Legislative districts see even greater disparities in poverty than counties do. Across assembly districts, for example, poverty rates differ by more than 30 percentage points, ranging from 7.8% in Assembly District 16 (Baker, R) in eastern Contra Costa County to 40.7% in Assembly District 59 (Jones-Sawyer, D) in central Los Angeles. This range reflects differences in the number of counties and assembly districts, as well as the size of their populations. California has 80 assembly districts with roughly equal populations, so they represent more slices of the state—especially in urban, densely populated counties.

Comparing counties and legislative districts draws attention to the ways that boundaries can bring forth or obscure populations. In the Inland Empire (San Bernardino and Riverside) in southeastern California, county and state senate district lines show poverty rates below the state average of 19.8% from 2014–16, ranging from 18.2% to 18.9%. But state assembly and US congressional districts in that area have high poverty rates, ranging from 20.5% to 22.7%—and are adjacent to districts with much less poverty.

The maps provide a rich resource for learning about the geographic variation of poverty in California. Since the factors driving poverty vary across the state, effective approaches for reducing poverty may vary too, as our previous research on child poverty has shown. For additional detail, the maps allow users to download estimates on the impact of major social safety net programs on poverty in different regions.

Testimony: Safety Net Plays Key Role in Reducing Poverty

Sarah Bohn, research fellow at the Public Policy Institute of California, testified today, February 14, 2018, before the Senate Budget and Fiscal Review Committee, Informational Hearing on Human Services. The topic of today’s hearing: poverty and social safety net programs. Here are her prepared remarks.

Poverty is high in California, and it has not improved as much as the economy has in recent years. In fact, California’s poverty rate is highest in country, according to our estimates. Throughout this presentation, I will rely on the California Poverty Measure research (a joint effort between PPIC and Stanford) that accounts not only for earnings but also for benefits from major safety net programs and the cost of housing to give a comprehensive, accurate, and state-specific account of the resources families have on hand to meet their basic needs.

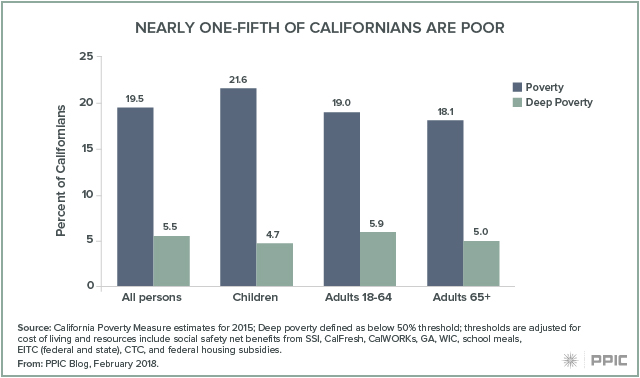
We find that 19.5% of Californians were poor as of 2015—that means 7.5 million people living below a basic needs threshold (less than $30,000 in total resources for a family of four). The poverty rate is slightly higher for children at 21.6%. In addition, 5.5% of Californians are in deep poverty—which means they have less than half of what it takes to meet basic needs, or about $15,000 annually for a family of four. Overall, the share of Californians in poverty remains higher than it was before the last recession started and is relatively high by historical standards.
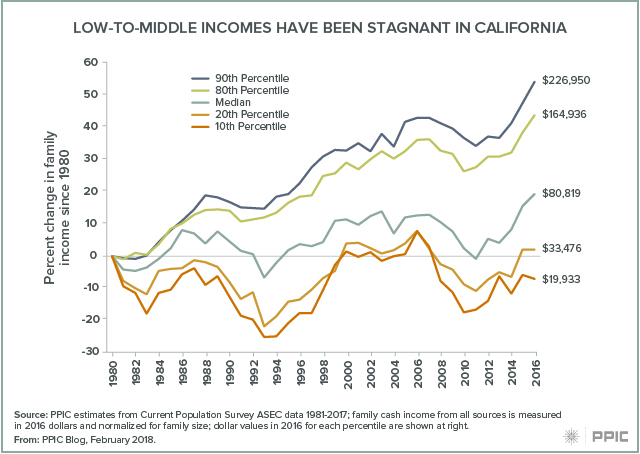
To understand why, providing a long-term picture of how all Californians have fared is helpful. For the bottom half of California families, income has been quite stagnant for at least the past three decades. The bottom 10% are earning less than they were in 1980 (about $20,000) and the bottom 20% are earning just 4% more.  Compare that to the top 10%, which are earning 54% more than they did in 1980.  Much of this is driven by how economic opportunities (especially in the labor market) have changed and polarized – generating both high rates of poverty and high income inequality.
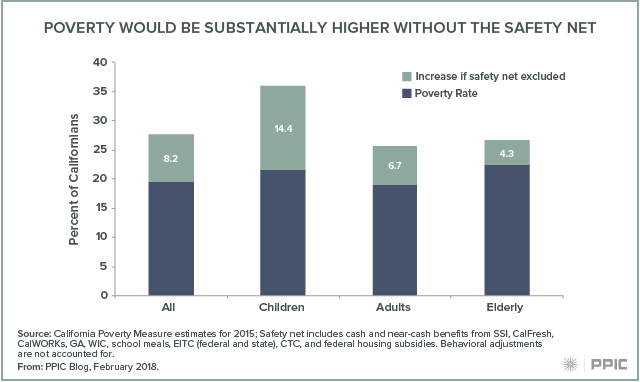
How does this relate to the safety net? With stagnant earnings since 1980, safety net resources become an even more important factor in making ends meet as cost of living increases. Our estimates show that major safety net program benefits play a critical role in mitigating poverty. The California poverty rate would be 8 points higher were it not for these programs—that means an additional 3.1 million Californians would be in poverty. The deep poverty rate would more than double were it not for the safety net.
Looking specifically at CalFresh, CalWORKs, and SSI—the programs we’re focusing on today—we estimate that a large number of Californians are moved out of deep poverty or poverty because of the program benefits they or their family members receive.
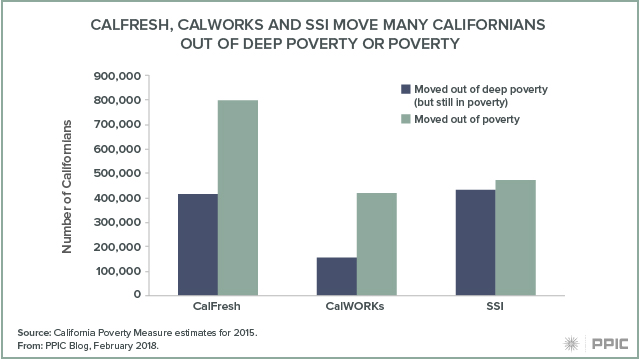
Specifically, CalFresh moves 400,000 people out of deep poverty; 800,000 are moved out of poverty.  The numbers are a bit smaller for CalWORKs families (150,000 from deep poverty and 400,000 from poverty), in part because the program reaches fewer families. And finally, SSI moves about 400,000 out of deep poverty and about the same number out of poverty. Keep in mind that families on these programs may be far from the poverty line, so even if they are not technically moved out of poverty, program resources can still be an important way for them to meet basic needs. Families may also benefit from multiple programs in combination.

The safety net plays a critical role in helping make ends meet but income from work is still the biggest component of family resources, even for families in poverty. And as we saw over the long term, the trend in income alone is not positive for families in the bottom half of the income distribution. So in addition to helping families manage in the short term, ideally social safety net programs could contribute to mobility over the long term, counteracting the trend in income inequality. However, one factor limiting the potential impact of safety net resources is the high cost of living in California, driven mostly by housing but also other living expenses like child care and medical costs.

After we consider these other expenses, we end up with poverty rates that are high compared to other states and high within and across California as well.  This is what the poverty looks like across a number of demographic characteristics.
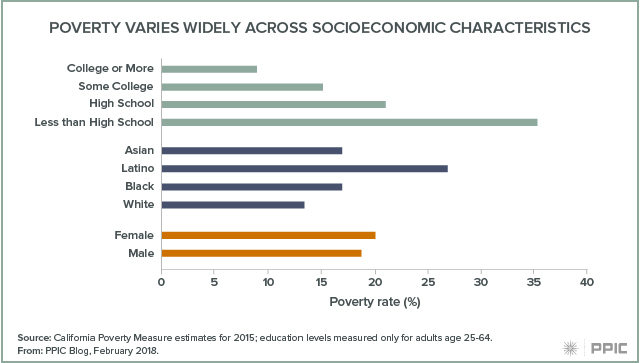
You’ll notice that the incidence of poverty varies the most across education levels (and here we’re only looking at adults age 25–64 who’ve had enough time to acquire education). Men and women are about equally likely to be in poverty. Latinos in California are twice as likely to be poor as white residents (27% vs. 13%), and black and Asian residents fall in between.

Across the state, poverty varies considerably. The highest rate is in Los Angeles, at 25% (with Santa Cruz and Santa Barbara close behind). The lowest is in Placer County at 13% (nearby Sierra counties of Alpine, Mariposa, and others have similar rates).
As we all see day to day, poverty is concentrated much more narrowly than at the county level—sometimes it varies neighborhood to neighborhood. In fact, we find that the highest and lowest rates of child poverty in the state are in neighborhoods of Los Angeles that are just 20 to 30 miles apart. Similar differences can be seen in neighborhoods across the Silicon Valley. The concentration of poverty raises concerns that there are other factors about places—beyond just income level—that diminish the chances for residents to get ahead.
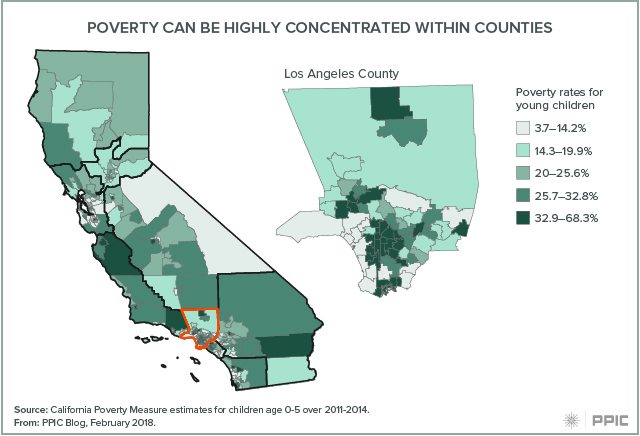
This map is surprising because it does not track one-for-one with unemployment or other economic indicators. Access to good-paying jobs is the number one factor in preventing poverty. But it is not sufficient because the cost of living (housing, child care) looms large—and those expenses tend to be higher in exactly the places where unemployment is lower and wages higher, making it hard to make ends meet even with a full-time job. High living expenses coupled with the long-term stagnation in low to middle incomes yields the high rates of poverty we see today even with very low unemployment rates.

In this context it is critically important to be aware of the role social safety net programs play in helping Californians make ends meet—as I mentioned the poverty rate would be 40% higher were it not for major means tested programs in California.  Nonetheless, California has the highest poverty rate in the country—even with a booming economy—so it is exactly the right time to discuss where the safety net falls short and what needs to be done.

Examining the Federal EITC’s Impact on Poverty

The federal Earned Income Tax Credit (EITC) plays an important role in keeping Californians out of poverty. The credit supplements earnings for low-income workers at tax time, providing $2,400 on average to qualified tax filers.

Without the EITC, we estimate an additional 814,000 Californians would live in poverty, according to the latest data from the California Poverty Measure (CPM), an ongoing collaboration between PPIC and the Stanford Center on Poverty and Inequality. This reduction in poverty makes the EITC nearly comparable to CalFresh (formerly known as food stamps), the safety net program that keeps the most Californians out of poverty. Our estimates reflect data from 2013 to 2015 and do not include the state EITC, which was introduced in 2015 and expanded in 2017. The state EITC lowers poverty by very little because the largest credits go to workers with very low earnings, whose families mostly live well below the poverty line.

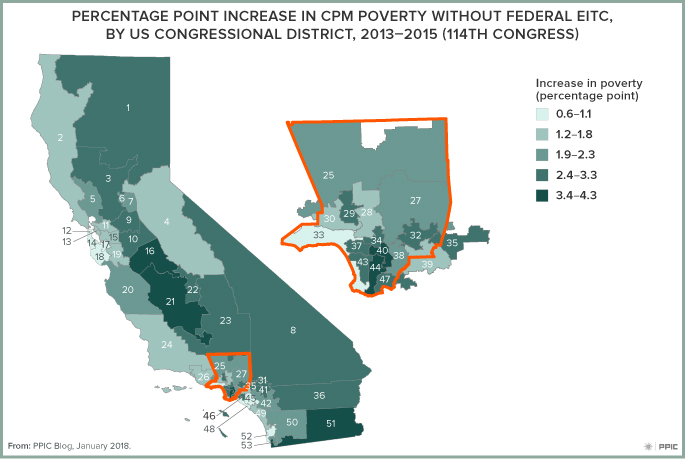
The role that the EITC plays varies widely across regions. Statewide, the poverty rate would be 2.2 percentage points higher without the EITC (22.6% instead of 20.4%). But in Lake and Mendocino Counties (combined), the poverty rate without the EITC would be 4.1 percentage points higher than it is currently, reaching 26.8%. Poverty in Marin County, on the other hand, would increase only 0.2 points, to 16.5%. Such differences could be due to several factors—for example, the share of eligible families who take advantage of the credit and the local availability of jobs.

PPIC recently released data showing poverty rates, poverty thresholds, and the effects of safety net programs not only by county, but also by state assembly and senate district and by US congressional district. These data provide an opportunity to dig more deeply into the varying roles of safety net programs across the state.

The EITC, for example, has the largest effect in some of the highest-poverty congressional districts, including District 40 (Rep. Roybal-Allard) and District 44 (Rep. Barragán). But in some relatively high-poverty districts it plays a smaller role (District 46, Rep. Correa). The data we provide can be a starting point for investigating—and potentially remedying—incomplete access to the EITC.


College Graduates Have Higher Net Worth

Compared to less educated adults, college graduates generally see much stronger labor market outcomes, including greater labor force participation, more employment, and higher wages. This holds true across every demographic group—age, gender, ethnicity, and nativity. These differences are well-measured and well-documented.

But what about wealth? Wealth is one of the most important indicators of economic well-being, but it is difficult to measure and therefore information on wealth is much less widely available. Using recently released data from the US Census Bureau’s Survey of Income and Program Participation (SIPP), PPIC has developed new estimates of wealth for Californians. We focus on household net worth, the difference in value between all assets (including retirement accounts, savings accounts, investments, and real estate) and all liabilities (including mortgages, loans, and credit card debt).

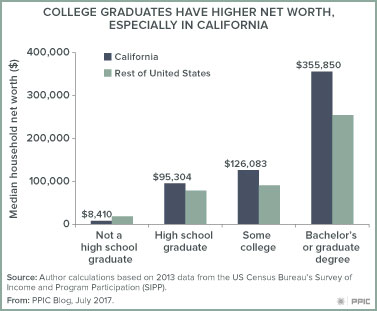
The estimates show that Californians are wealthier than adults in the rest of the nation. In 2013, median household net worth among adults age 25 and over was $135,000 in California compared to $105,000 in the rest of the United States. While many have expressed growing concern about income inequality, the distribution of wealth is even more uneven—a fact that is especially apparent when we examine wealth by educational attainment. In California, median household net worth is almost four times higher for adults with at least a bachelor’s degree ($356,000) than for high school graduates ($95,000). (In the rest of the nation, the difference is slightly more than threefold.) One in four college graduates in California is a millionaire, compared to one in fourteen high school graduates.

For most people, wealth accumulates over time. As college graduates consistently earn relatively high incomes year after year, their wealth grows. One in five young college graduates (age 25–34) in California has negative net worth—meaning they have more debt, including student loan debt, than assets. But over time, debt recedes and wealth increases. Among college graduates who recently retired (those age 65–74) in California, half are millionaires.


Higher education has long been key to economic progress for individuals and for the state. In future research, PPIC will explore the role of higher education in promoting social and economic mobility. Ensuring that higher education continues to put people on the path toward economic well-being is a central policy issue.

Learn more

Read Higher Education in California: Addressing California’s Skills Gap
Visit the PPIC Higher Education Center

Video: Pessimism about Nation’s Direction

Californians have grown more pessimistic about the direction of the nation and the US economy since the beginning of the year, the May PPIC Statewide Survey shows. Underscoring that sentiment: just 27 percent of residents approve of the way President Trump is doing his job. Only 26 percent approve of Congress—a 10 point decline from March.

Researcher David Kordus presented these and other key findings at a survey briefing in Sacramento last week. On other federal issues, the survey found that most Californians disapprove of the House health care bill, and half expect negative effects from increased immigration enforcement.

Californians are feeling better about the state of their state by some measures: a solid majority favor Governor Brown’s budget plan, and fewer adults than in past years see the state budget situation as a big problem. But the state faces important challenges. Housing is one of them, with 59 percent of all adults saying affordability is a big problem in their part of the state. And solid majorities of Californians say the gap between rich and poor is getting larger. Majorities support state action to address these issues.

Learn more

Read the PPIC Statewide Survey: Californians and Their Government
Find out more about the PPIC Statewide Survey

Video: Tom Steyer on the Issues

Tom Steyer—business leader, philanthropist, and possible Democratic candidate for governor—has invested his money and time in activism since leaving the private sector. Moving beyond his initial environmental advocacy, Steyer supported candidates and causes across the state and nation in both the 2014 and 2016 elections.

He sat down to talk to Mark Baldassare, PPIC president and CEO, about his views on policies that will affect the future of California. Steyer would not say whether or not he’s running for governor. But he had a lot to say about the current political climate.

Asked to name three issues that will affect California’s future, Steyer listed priorities that he said are inextricably linked and cut across traditional policy areas:

  • Addressing income inequality: The state has rebounded economically since 2008, Steyer noted, but it is the top 1% of residents who have benefited. While income inequality is a critical issue across the nation, its impact is heightened in California, Steyer said, affecting housing, transportation, education, and incarceration.
  • Investing in our state to rebuild the way we live together: California needs to create a more sustainable way of living that preserves the beauty of the state. “We’ve build the state around the internal combustion engine,” Steyer said. “We have to rebuild the way we live.”
  • Protecting and strengthening our democracy: “California citizens are basically losing a silent fight with special interests,” he said, noting his support for ballot measures that were “direct contests” with special interests, including oil and tobacco companies. “I think the threat to democracy that we’re seeing coming out of Washington, DC, is as profound as I’ve seen in my lifetime.”

Video: Legislative Leaders Look Ahead

Despite their political differences, California’s legislative leaders have similar views of the state’s most pressing challenges. In a conversation facilitated by PPIC this week in Sacramento, the two top legislators from both major parties provided a preview of the issues they expect to tackle this session. With the impact of federal policy changes still unclear, the legislative leaders focused on longstanding challenges.

Asked to list the top issues the legislature and governor need to work on this session, Anthony Rendon, the Democratic speaker of the state assembly, named housing and transportation—topics he heard about repeatedly as he campaigned around the state. He said he saw the impact of a housing and transportation crisis first hand when walking precincts in the Inland Empire. “If you knock on someone’s door at 7:00, 7:30 p.m., they’re not home yet. They’re still on the freeway.”

Jean Fuller, the Republican leader of the state senate, sees the top issues as affordability in California generally and jobs. “We are concerned about housing, but we are also very concerned about jobs.” She noted that in her district, which stretches from Visalia to Twenty-Nine Palms, there is double-digit unemployment.

Kevin de León, the Democratic state senate president pro tem, said the past legislative session had been particularly productive; he highlighted minimum wage, gun safety, and climate change legislation. In this session, he said, “we have to deliver on the issues of housing and transportation and the issue of economic growth.”

For Chad Mayes, Republican leader of the assembly, poverty is the number one issue in the state, which has the highest poverty rate in the nation. “If you use that as a performance measure for how well our board of directors—the state legislature—is doing, I think you’d have to say we have been failing.” He added: “We’re failing, in large part because of housing costs.”

The speakers acknowledged major policy differences. But they pointed to past successes in bridging them as a sign that they can do so again.

“Things are not broken here, in comparison to DC,” said de León.