Essential Workers and COVID-19

California is grappling with the dual threats of a public health crisis caused by the coronavirus and the additional economic fallout of necessary social distancing measures.  In the past week, we have seen unemployment claims skyrocket and policymakers forge supports for workers and businesses.

Meanwhile, there is a workforce that is tackling the public health crisis, keeping the economy going, and supporting Californians who are sheltering in place. While this essential workforce supports the state’s health and basic economic needs, many of these workers are not well equipped to weather the economic challenges of the COVID-19 crisis.

We estimate that in a typical year, roughly one-third to one-half of California’s labor force is employed in essential occupations. Essential workers fulfill a wide variety of roles in our economy, including in health care services, energy provision, food service, agriculture, and transportation. Some workers in these areas may be seeing layoffs and hours reductions depending on their industry, firm, or region.
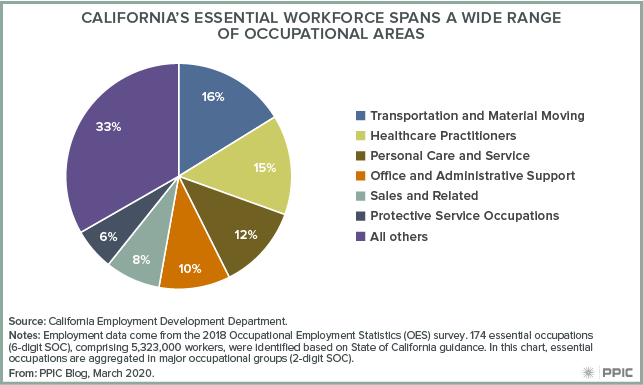
figure - California’s Essential Workforce Spans a Wide Range of Occupational Areas

Some essential jobs are obvious, as they are on the front lines of the public health crisis. For example, registered nurses (the largest occupation within the healthcare practitioner category) are essential, have two- or four-year degrees (68% have a college degree, according to our analysis of American Community Survey data), and earn relatively high wages ($52.32 an hour).

However, workers outside of the health care sector are also on the front lines. Personal care aides—those who assist the elderly and others in their homes or personal care facilities—are the single largest essential job category. These workers earn $13.50 an hour on average and 85% do not have a college degree.

Differences in skills and pay translate into notable differences in economic well-being for these workers and their families. A slightly higher share of essential workers than non-essential workers are poor or nearly poor, according to the California Poverty Measure: 14% of essential workers live in poor families compared to 11% of non-essential workers (the comparable estimates for near poverty are 19% and 14%, respectively).
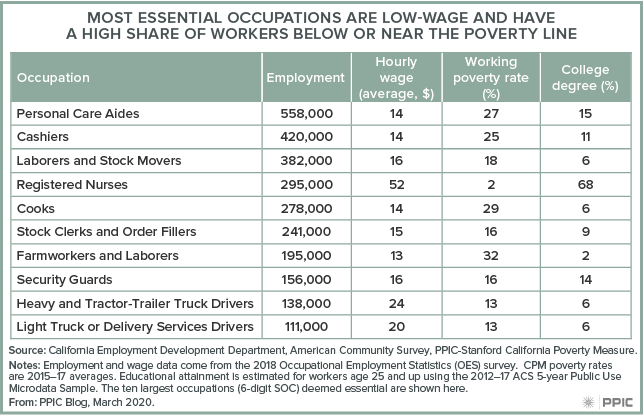
figure - Most Essential Occupations Are Low-Wage and Have a High Share of Workers Below or Near the Poverty Line

Grocery store cashiers, store clerks, farmworkers, and delivery and truck drivers make up sizeable shares of the essential workforce.  Given the low hourly wage rates for these workers, some may face hardships in caring for children or family members with schools and care facilities shuttered.

In addition, many essential workers experience the cost and risk of maintaining their own health while interacting with the public. In low wage essential jobs, access to health benefits and paid sick leave is limited, even in normal times. During the COVID-19 crisis, expanding access to personal protective gear could reduce the health risks among workers whose job requires some level of contact with the public.

Mandated lockdowns are now slated to continue through at least May 1 in some parts of the state and  may last even longer. Ensuring the ability of essential workers to continue their jobs safely and effectively will be crucial over the coming months. As policymakers implement support for unemployed Californians, it is important that they also consider ways to assist and protect the many essential workers on the front lines. Paid sick leave, adequate health coverage, income support, access to child care, and sufficient personal protective gear should all be part of the policy discussion.

Feeding Children When Schools Are Closed for COVID-19

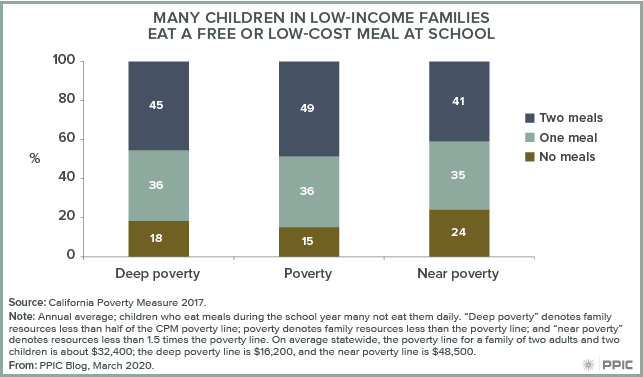
By state law, all public schools in California must provide at least one nutritionally adequate meal to students—however, many students eat more than one meal a day at school. Nearly four million students received meals from California’s public schools in the 2018–19 school year: close to 300 million breakfasts and well over 500 million lunches. With schools closed to reduce exposure to the new coronavirus, many students now lack ready access to these meals.

By federal law, low-income students (about $48,000 for a family of four in 2020) are eligible for free or low-cost school meals. Higher income students paid on average $0.98 for breakfast and $2.11 for lunch in 2017–18, according to the California Department of Education.

The vast majority of low-income students eat some or all breakfasts, lunches, or both at school. Free and reduced-price meals lower food insecurity, and according to the California Poverty Measure (CPM), meaningfully reduce poverty among families with public school students. Without school meals, the share of students living in deep poverty would be 17% higher; increases for students in less severe poverty would be 2% to 8%.

figure - Many Children in Low-Income Families Eat a Free or Low-Cost Meal at School

With school closures in place for several weeks, school districts have already designated sites where families can pick up meals for children. In higher poverty areas, all children can access meals regardless of enrollment in the local school or eligibility for meal programs because authorities have temporarily relaxed federal regulations.

During closures, Governor Newsom assured that schools will continue to receive state funds to operate and requested efforts focus on certain areas, including providing school meals. However, access remains a concern. For example, Los Angeles Unified School District lists 64 “grab-and-go” sites for its roughly 1,000 schools. San Diego Unified School District has 13 sites for 181 schools, as of March 16. Elk Grove, with 67 schools, has 34 sites for drive-through and grab-and-go meal services along with a mobile service for families with limited transportation.

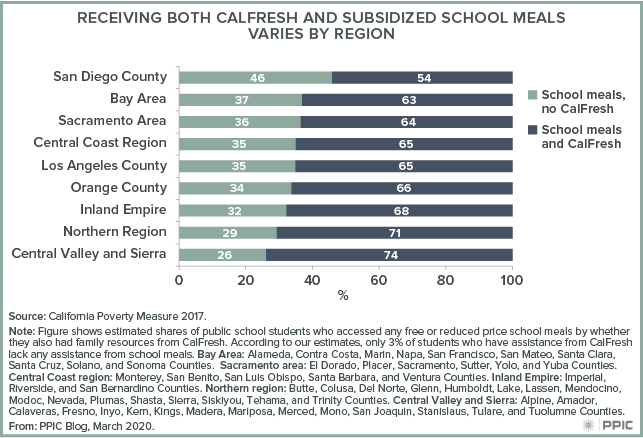
With pandemic EBT (P-EBT), ATM-like cards pre-loaded with funds for groceries, the federal government is also helping low-income students replace missed school meals. The cards will cover the expected number of days that schools will be closed. For students whose families already receive monthly CalFresh benefits on EBT cards, funds can readily be added. For low-income students who do not already receive CalFresh (34% statewide), families must complete some paperwork—mainly electronically—to obtain an EBT card.

Because the reach of CalFresh varies across the state, barriers to getting P-EBT funds to students will also vary. Fortunately, the state already matches student data with their CalFresh, CalWORKs, and Medi-Cal data to automatically determine students eligible for free and reduced-price school meals. If the state can use all existing sources of family income to provide P-EBT to students, they will reach more low-income students.

figure - Receiving Both CalFresh and Subsidized School Meals Varies by Region

Ready access to meals influences student health, learning, and economic wellbeing. Robust access to free and reduced-price meals can decrease the stress low-income families are facing as efforts to limit the spread of COVID-19 dampen economic activity.

Interactive: Many Californians Live in or Near Poverty

[vc_row][vc_column][vc_column_text]More than 7 million Californians are “near poor”: out of poverty, but within 1.5 times the poverty line, according to the California Poverty Measure. The near-poor population is slightly larger than the poor population, and many could be pushed into poverty by small expenses.

In California, a near-poor family of four who rents has annual resources that range between $32,500 and $48,800. Adults with less education and fewer work hours, renters, African Americans, and Latinos often have the highest poverty and near-poverty rates. Disparities that persist across poor and near-poor groups are reminders that the poverty threshold is not a hard line where economic hardship ends.

Among adults, full-time work does not remove the risk of poverty: 21% of people ages 25–64 working full-time, full-year jobs are in or near poverty. These full-time workers are more likely to live in near poverty (13.9%) than in poverty (7.1%). At the same time, adults in less than full-time jobs live in near poverty at about the same rate (19.7%) as those with no work (20.9%). But they are less likely to live in poverty (22.3%) than those with no work (32%).[/vc_column_text][/vc_column][/vc_row][vc_row max_width=”80″ visibility=”visible-desktop”][vc_column][vc_column_text]

[infogram id=”1p9yd5nm9kxnddf7zryd5dqnp1b3xnwkjnq?live”]

[/vc_column_text][/vc_column][/vc_row][vc_row max_width=”80″ visibility=”visible-tablet-landscape”][vc_column][vc_column_text]

[infogram id=”1p9yd5nm9kxnddf7zryd5dqnp1b3xnwkjnq?live”]

[/vc_column_text][/vc_column][/vc_row][vc_row visibility=”visible-tablet-portrait”][vc_column][vc_column_text]

[infogram id=”1p9yd5nm9kxnddf7zryd5dqnp1b3xnwkjnq?live”]

[/vc_column_text][/vc_column][/vc_row][vc_row visibility=”visible-phone”][vc_column][vc_column_text]

[infogram id=”1p9yd5nm9kxnddf7zryd5dqnp1b3xnwkjnq?live”]

[/vc_column_text][/vc_column][/vc_row][vc_row][vc_column][vc_column_text]Resources from social safety net programs play a substantial role in moving people out of poverty—2.7 million more Californians would be poor if not for the social safety net. However, many of those moved out of poverty nonetheless live in near poverty, as broader factors like the cost of housing and available jobs play key roles in the resources they have on hand.

As California policymakers address poverty through tax credits, safety net programs, and housing policies, near-poverty rates provide another view into the state’s lowest-income populations. Reducing poverty in California will require attention to how families can be lifted out of poverty and also positioned for long-term economic security.[/vc_column_text][/vc_column][/vc_row]

For Many Californians, Poverty Is One Minor Expense Away

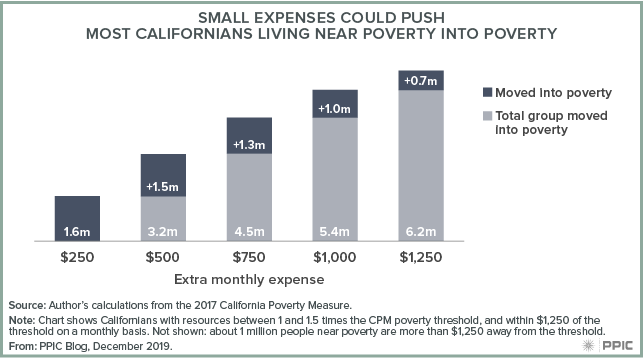
Add one extra expense and families living just above the poverty line could fall into poverty. Data from the California Poverty Measure (CPM) show that 7.2 million Californians live near poverty, that is, with just enough resources to meet their basic needs. All told, in 2017 as many Californians lived just above the poverty line as below it, or about 18% in each case. Even a small change, a monthly expense of $250 or less, could push 1.6 million people under the line.

We define “near poverty” to mean having resources worth 1 to 1.5 times the poverty threshold after taxes and necessary expenses. Since the CPM accounts for California’s varied living costs, the range for near poverty differs across regions. In Fresno County, a family of four who rents their home and has $25,900 to $38,900 in resources is near poverty, while in Santa Clara County, the same is true of a family of four with $40,000 to $60,000.

Because the poverty line is a blunt standard, “near poverty” includes families earning just a few dollars above the poverty threshold—even though a few dollars are unlikely to make it easier to make ends meet. This makes it especially important to understand how many Californians are near poverty, and how close those near poverty are to falling into it.

Californians can be pushed into poverty by the smallest expenses. Overall, people near poverty are more likely to be pushed into poverty by a small expense than a large expense. As expenses grow, the total number of people threatened climbs. Three out of four people near poverty, or 5.4 million, are pushed into poverty by an extra $1,000.

figure - Small Expenses Could Push Most Californians Living Near Poverty into Poverty

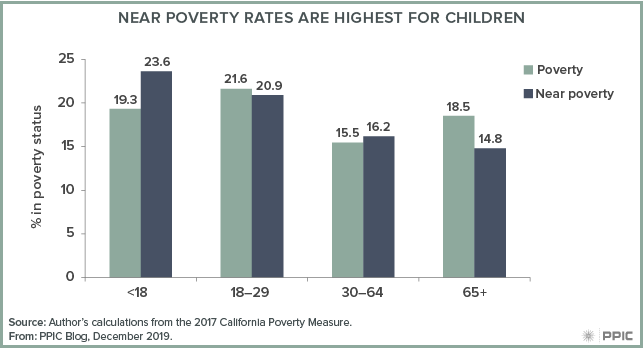
Near poverty affects young people more than it does older Californians, and children under 18 are more likely to be near poverty (23.6%) than in poverty (19.3%). Young adults and seniors, however, are more likely to be in poverty. Regional differences in living costs, opportunity levels, and the impact of existing policies and programs are key factors driving this variation.

figure - Near Poverty Rates Are Highest for Children

Without safety net programs, more people, and in particular, more families with children, would face poverty instead of near poverty: resources from programs including CalFresh and the federal and state Earned Income Tax Credits (EITCs) keep 7.1% of Californians out of poverty. Yet almost all people (93%) who move out of poverty via the safety net move into near poverty. This fact has implications for policymakers’ ongoing efforts to help ensure all Californians can meet their basic needs. As the state works to reduce poverty, strategies that promote economic mobility complement investments in programs like the CalEITC and the new Young Child Tax Credit.

Video: Poverty and Opportunity in California

Although California has seen strong job growth in recent years, poverty remains persistently high. In many inland regions, the prevalence of unemployment or low-wage work is a key driver of economic hardship, while elsewhere—especially in coastal areas—the high cost of housing and other necessities plays a major part.

At an event in Sacramento last week, PPIC researcher Tess Thorman discussed the latest findings from the PPIC-Stanford California Poverty Measure (CPM), and a panel of experts discussed the role that policymakers, community organizations, and other stakeholders can play in reducing poverty and broadening economic opportunity.

Poverty has declined—slowly—in California, Thorman said. Also, while nearly 7 million people in California (17.8%) are in poverty, a roughly equal number are living just above the CPM poverty threshold. Certain groups are more likely to be living in poverty, such as young children, Latinos, and families without any college graduates.

Panelists discussed the key role that housing stability plays in achieving financial security. Richard Raya, director of Mission Promise Neighborhood in San Francisco, said his organization connects families with a range of supports, including below-market rental housing. He explained how the city has partnered with local foundations to create “an ‘accelerator fund’ that allows affordable housing developers to identify existing apartment buildings that are rent-controlled” and purchase them in order to keep them affordable – an approach Raya says could be a model for other communities.

Kimberley Johnson, director of the California Department of Social Services (CDSS), underscored how housing and financial stability are fundamental to meeting educational and career goals. Johnson noted that the governor has boosted investments in key elements of the social safety net, such as CalFresh food assistance and the California Earned Income Tax Credit. An important focus for CDSS currently is creating linkages across “a very robust array” of programs and services to make them more accessible to those in need.

California Bridge Academies, launched in Fresno and now active in six counties, offers a voluntary, 18-month program designed to help families exit poverty. According to founder Pete Weber, each household has a “career and family navigator” who assesses needs, skills, and interests. The navigator ensures that “each client is connected to the right on-ramps” so that parents as well as their children receive all necessary services and supports.

The panel highlighted the importance of coordinating services with an eye toward improving family well-being. Caroline Danielson, PPIC policy director and senior fellow, discussed the importance of creating linkages “across different kinds of programs” because “it can be a fragmented safety net.” Danielson pointed out that California has made progress in this effort, while also noting that further efforts to “connect these dots” for children could make a substantial difference in poverty.


Video: Understanding Poverty in California

[vc_row][vc_column][vc_column_text]

Despite a booming economy, millions of Californians live in or near poverty. In this video, PPIC research associate Tess Thorman gives an overview of poverty and child poverty in the state, using the latest figures from the California Poverty Measure (CPM).

The CPM is a joint research effort by PPIC and the Stanford Center on Poverty and Inequality that provides a comprehensive look at economic well-being in our state. By accounting for cost of living differences across the state as well as earnings and other family resources—including safety net benefits—the CPM offers valuable insights into the ability of Californians to meet basic needs and be financially secure.[/vc_column_text][/vc_column][/vc_row][vc_row visibility=”hidden-phone”][vc_column][vc_video link=”https://youtu.be/tPh4xE7QLGo” el_width=”70″ align=”center”][/vc_column][/vc_row][vc_row visibility=”visible-phone”][vc_column][vc_video link=”https://youtu.be/tPh4xE7QLGo”][/vc_column][/vc_row][vc_row][vc_column][vc_column_text]To learn more about poverty in California, visit ppic.org/poverty.[/vc_column_text][/vc_column][/vc_row]

Interactive: A Look at Child Poverty across California

[vc_row][vc_column][vc_column_text]Governor Newsom’s first budget proposal included notable efforts to address poverty—especially child poverty—by increasing CalWORKs cash assistance grants, expanding assistance to low-income parents pursuing higher education, and further expanding the state’s Earned Income Tax Credit (CalEITC, which he proposed renaming the Working Families Tax Credit).

California has a troublingly high child poverty rate of 21.3%, or about 1.9 million children, according to our latest estimates from the California Poverty Measure (CPM). The CPM is a joint research effort between PPIC and the Stanford Center on Poverty and Inequality that, unlike official poverty metrics, takes into account the cost of living and benefits from social safety net programs.

While poverty rates in the state are also high, child poverty rates tend to be even higher, particularly in the most populous counties. For example, in Los Angeles County, 24.3% of all residents—but 27.8% of children—live in poverty. Altogether, 17 counties, 29 congressional districts, 21 senate districts, and 42 assembly districts have child poverty rates of more than about 20%.

State and federal policies play an important role in lowering child poverty. Our estimates indicate that over a third (35.3%) of children would be in poverty, were it not for programs like CalFresh food assistance, the federal and state Earned Income Tax Credits, and CalWORKs cash assistance. PPIC research also shows that new policies could reduce child poverty even further, although effects vary across the state. We will continue to track and analyze poverty and child poverty to provide this critical information to policymakers and stakeholders.[/vc_column_text][/vc_column][/vc_row][vc_row][vc_column][vc_raw_html]JTNDZGl2JTIwY2xhc3MlM0QlMjd0YWJsZWF1UGxhY2Vob2xkZXIlMjclMjBpZCUzRCUyN3ZpejE1NDc4MjcxODU1NTglMjclMjBzdHlsZSUzRCUyN3Bvc2l0aW9uJTNBJTIwcmVsYXRpdmUlMjclM0UlM0Nub3NjcmlwdCUzRSUzQ2ElMjBocmVmJTNEJTI3JTIzJTI3JTNFJTNDaW1nJTIwYWx0JTNEJTI3JTIwJTI3JTIwc3JjJTNEJTI3aHR0cHMlM0ElMjYlMjM0NyUzQiUyNiUyMzQ3JTNCcHVibGljLnRhYmxlYXUuY29tJTI2JTIzNDclM0JzdGF0aWMlMjYlMjM0NyUzQmltYWdlcyUyNiUyMzQ3JTNCQ2glMjYlMjM0NyUzQkNoaWxkUG92ZXJ0eWJ5Q2FsaWZvcm5pYUNvdW50eWFuZExlZ2lzbGF0aXZlRGlzdHJpY3RfMCUyNiUyMzQ3JTNCQ291bnRpZXMlMjYlMjM0NyUzQjFfcnNzLnBuZyUyNyUyMHN0eWxlJTNEJTI3Ym9yZGVyJTNBJTIwbm9uZSUyNyUyMCUyRiUzRSUzQyUyRmElM0UlM0MlMkZub3NjcmlwdCUzRSUzQ29iamVjdCUyMGNsYXNzJTNEJTI3dGFibGVhdVZpeiUyNyUyMCUyMHN0eWxlJTNEJTI3ZGlzcGxheSUzQW5vbmUlM0IlMjclM0UlM0NwYXJhbSUyMG5hbWUlM0QlMjdob3N0X3VybCUyNyUyMHZhbHVlJTNEJTI3aHR0cHMlMjUzQSUyNTJGJTI1MkZwdWJsaWMudGFibGVhdS5jb20lMjUyRiUyNyUyMCUyRiUzRSUyMCUzQ3BhcmFtJTIwbmFtZSUzRCUyN2VtYmVkX2NvZGVfdmVyc2lvbiUyNyUyMHZhbHVlJTNEJTI3MyUyNyUyMCUyRiUzRSUyMCUzQ3BhcmFtJTIwbmFtZSUzRCUyN3NpdGVfcm9vdCUyNyUyMHZhbHVlJTNEJTI3JTI3JTIwJTJGJTNFJTNDcGFyYW0lMjBuYW1lJTNEJTI3bmFtZSUyNyUyMHZhbHVlJTNEJTI3Q2hpbGRQb3ZlcnR5YnlDYWxpZm9ybmlhQ291bnR5YW5kTGVnaXNsYXRpdmVEaXN0cmljdF8wJTI2JTIzNDclM0JDb3VudGllcyUyNyUyMCUyRiUzRSUzQ3BhcmFtJTIwbmFtZSUzRCUyN3RhYnMlMjclMjB2YWx1ZSUzRCUyN3llcyUyNyUyMCUyRiUzRSUzQ3BhcmFtJTIwbmFtZSUzRCUyN3Rvb2xiYXIlMjclMjB2YWx1ZSUzRCUyN25vJTI3JTIwJTJGJTNFJTNDcGFyYW0lMjBuYW1lJTNEJTI3c3RhdGljX2ltYWdlJTI3JTIwdmFsdWUlM0QlMjdodHRwcyUzQSUyNiUyMzQ3JTNCJTI2JTIzNDclM0JwdWJsaWMudGFibGVhdS5jb20lMjYlMjM0NyUzQnN0YXRpYyUyNiUyMzQ3JTNCaW1hZ2VzJTI2JTIzNDclM0JDaCUyNiUyMzQ3JTNCQ2hpbGRQb3ZlcnR5YnlDYWxpZm9ybmlhQ291bnR5YW5kTGVnaXNsYXRpdmVEaXN0cmljdF8wJTI2JTIzNDclM0JDb3VudGllcyUyNiUyMzQ3JTNCMS5wbmclMjclMjAlMkYlM0UlMjAlM0NwYXJhbSUyMG5hbWUlM0QlMjdhbmltYXRlX3RyYW5zaXRpb24lMjclMjB2YWx1ZSUzRCUyN3llcyUyNyUyMCUyRiUzRSUzQ3BhcmFtJTIwbmFtZSUzRCUyN2Rpc3BsYXlfc3RhdGljX2ltYWdlJTI3JTIwdmFsdWUlM0QlMjd5ZXMlMjclMjAlMkYlM0UlM0NwYXJhbSUyMG5hbWUlM0QlMjdkaXNwbGF5X3NwaW5uZXIlMjclMjB2YWx1ZSUzRCUyN3llcyUyNyUyMCUyRiUzRSUzQ3BhcmFtJTIwbmFtZSUzRCUyN2Rpc3BsYXlfb3ZlcmxheSUyNyUyMHZhbHVlJTNEJTI3eWVzJTI3JTIwJTJGJTNFJTNDcGFyYW0lMjBuYW1lJTNEJTI3ZGlzcGxheV9jb3VudCUyNyUyMHZhbHVlJTNEJTI3eWVzJTI3JTIwJTJGJTNFJTNDJTJGb2JqZWN0JTNFJTNDJTJGZGl2JTNFJTIwJTIwJTIwJTIwJTIwJTIwJTIwJTIwJTIwJTIwJTIwJTIwJTIwJTIwJTIwJTIwJTNDc2NyaXB0JTIwdHlwZSUzRCUyN3RleHQlMkZqYXZhc2NyaXB0JTI3JTNFJTIwJTIwJTIwJTIwJTIwJTIwJTIwJTIwJTIwJTIwJTIwJTIwJTIwJTIwJTIwJTIwJTIwJTIwJTIwJTIwdmFyJTIwZGl2RWxlbWVudCUyMCUzRCUyMGRvY3VtZW50LmdldEVsZW1lbnRCeUlkJTI4JTI3dml6MTU0NzgyNzE4NTU1OCUyNyUyOSUzQiUyMCUyMCUyMCUyMCUyMCUyMCUyMCUyMCUyMCUyMCUyMCUyMCUyMCUyMCUyMCUyMCUyMCUyMCUyMCUyMHZhciUyMHZpekVsZW1lbnQlMjAlM0QlMjBkaXZFbGVtZW50LmdldEVsZW1lbnRzQnlUYWdOYW1lJTI4JTI3b2JqZWN0JTI3JTI5JTVCMCU1RCUzQiUyMCUyMCUyMCUyMCUyMCUyMCUyMCUyMCUyMCUyMCUyMCUyMCUyMCUyMCUyMCUyMCUyMCUyMCUyMCUyMGlmJTIwJTI4JTIwZGl2RWxlbWVudC5vZmZzZXRXaWR0aCUyMCUzRSUyMDgwMCUyMCUyOSUyMCU3QiUyMHZpekVsZW1lbnQuc3R5bGUud2lkdGglM0QlMjcxMDAlMjUlMjclM0J2aXpFbGVtZW50LnN0eWxlLmhlaWdodCUzRCUyOGRpdkVsZW1lbnQub2Zmc2V0V2lkdGglMkEwLjc1JTI5JTJCJTI3cHglMjclM0IlN0QlMjBlbHNlJTIwaWYlMjAlMjglMjBkaXZFbGVtZW50Lm9mZnNldFdpZHRoJTIwJTNFJTIwNTAwJTIwJTI5JTIwJTdCJTIwdml6RWxlbWVudC5zdHlsZS53aWR0aCUzRCUyNzEwMCUyNSUyNyUzQnZpekVsZW1lbnQuc3R5bGUuaGVpZ2h0JTNEJTI4ZGl2RWxlbWVudC5vZmZzZXRXaWR0aCUyQTEuNzclMjklMkIlMjdweCUyNyUzQiU3RCUyMGVsc2UlMjAlN0IlMjB2aXpFbGVtZW50LnN0eWxlLndpZHRoJTNEJTI3MTAwJTI1JTI3JTNCdml6RWxlbWVudC5zdHlsZS5taW5IZWlnaHQlM0QlMjc3NTBweCUyNyUzQnZpekVsZW1lbnQuc3R5bGUubWF4SGVpZ2h0JTNEJTI4ZGl2RWxlbWVudC5vZmZzZXRXaWR0aCUyQTEuNzclMjklMkIlMjdweCUyNyUzQiU3RCUyMCUyMCUyMCUyMCUyMCUyMCUyMCUyMCUyMCUyMCUyMCUyMCUyMCUyMCUyMCUyMCUyMCUyMCUyMCUyMCUyMHZhciUyMHNjcmlwdEVsZW1lbnQlMjAlM0QlMjBkb2N1bWVudC5jcmVhdGVFbGVtZW50JTI4JTI3c2NyaXB0JTI3JTI5JTNCJTIwJTIwJTIwJTIwJTIwJTIwJTIwJTIwJTIwJTIwJTIwJTIwJTIwJTIwJTIwJTIwJTIwJTIwJTIwJTIwc2NyaXB0RWxlbWVudC5zcmMlMjAlM0QlMjAlMjdodHRwcyUzQSUyRiUyRnB1YmxpYy50YWJsZWF1LmNvbSUyRmphdmFzY3JpcHRzJTJGYXBpJTJGdml6X3YxLmpzJTI3JTNCJTIwJTIwJTIwJTIwJTIwJTIwJTIwJTIwJTIwJTIwJTIwJTIwJTIwJTIwJTIwJTIwJTIwJTIwJTIwJTIwdml6RWxlbWVudC5wYXJlbnROb2RlLmluc2VydEJlZm9yZSUyOHNjcmlwdEVsZW1lbnQlMkMlMjB2aXpFbGVtZW50JTI5JTNCJTIwJTIwJTIwJTIwJTIwJTIwJTIwJTIwJTIwJTIwJTIwJTIwJTIwJTIwJTIwJTIwJTNDJTJGc2NyaXB0JTNF[/vc_raw_html][/vc_column][/vc_row]

Federal Immigration Proposal Could Have Widespread Impact

The Department of Homeland Security (DHS) has recently proposed changing how it decides whether a person is or will likely become dependent on government assistance. If implemented, this change would make it harder for immigrants to meet the government’s standard of self-sufficiency—and may deter them and others from using government services for which they are eligible. Through December 10, DHS is requesting public comments on the proposal, which could potentially have wide-ranging impacts on California and its large immigrant population.

The federal government can typically deny applications for green cards or entry into the United States to people who are or will likely become “public charges,” i.e., dependent on government assistance. Under current guidance, DHS considers an immigrant a public charge if they receive more than half of their income from cash assistance—which includes TANF (known as CalWORKs in California), General Assistance (GA), and Supplemental Security Income (SSI)—or are in government-funded, long-term institutional care (like a nursing home).

The proposed rule is much broader: it defines dependence as receiving more than about $1,800 (for 2018) in assistance from not only the current programs but also the food assistance program SNAP (CalFresh) and/or Section 8 housing vouchers and rental assistance. DHS also proposes that an income of less than 125% of the federal poverty level ($25,100 in 2018 for a family of four) would be a strong predictor of becoming a public charge and recommends length of enrollment in certain health programs as another factor to consider.

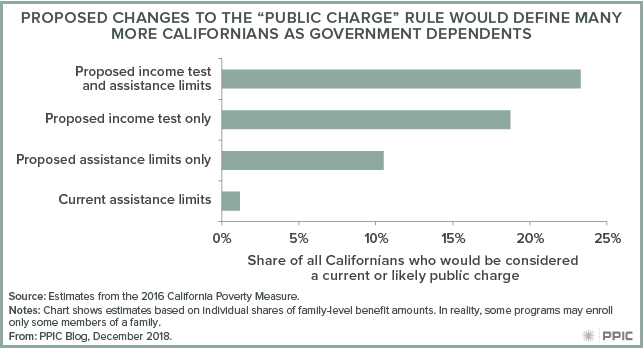
How big of a change is this? While data aren’t available to examine safety net participation among the noncitizens whose immigration cases would be affected by the rule, we estimate that even before including health programs, as many as 23% of all Californians would be considered public charges, or likely to become so—which gives a sense of how broad the proposed rule is. Some 18.7% of Californians would be considered likely to become public charges based on their income level alone. By contrast, at most 1.2% of all Californians receive more than half their income from CalWORKs, GA, and SSI, and would be considered public charges under the current rule. These calculations are based on the California Poverty Measure (CPM), a joint effort of PPIC and the Stanford Center on Poverty and Inequality.

California has more immigrants than any other state—and hence much at stake. For those on visas, the proposed rule would make it harder to qualify for a green card or extend their stay. But in practice, the largest impact would likely be on immigrants and their families who, purely out of caution, forego safety net benefits for which they are eligible. DHS cites this sort of disenrollment as a source of long-term savings—but notes that these savings are liable to be offset by worse public health outcomes and increased poverty rates. Based on studies of welfare reform in the 1990s, the UCLA Center for Health Policy Research estimates that if the rule change takes place, 15% to 35% of families with noncitizens might disenroll from safety net programs. At the high end, as many as 765,000 people could disenroll from CalFresh and Medi-Cal, leading to around $1 billion less in federal aid to California each year.

California’s attorney general and some local governments have already voiced their opposition to the proposed changes, which come at a time when the state has been expanding access to health and social safety net programs. Reduced participation in these programs, whether from reasonable or unnecessary caution, would directly counteract the state’s efforts to reduce poverty. Public comment for the proposal closes on December 10.

1 in 4 Child Care Workers in California Lives in Poverty

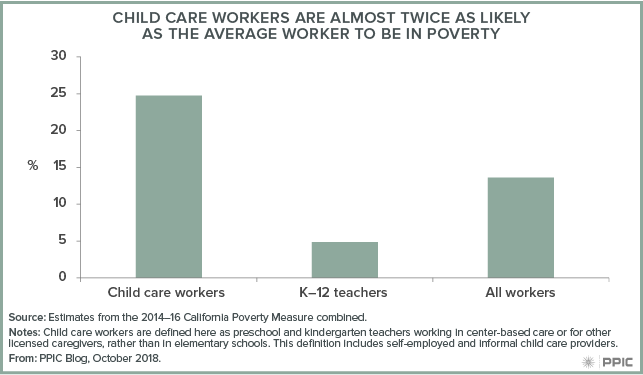
While preschools and child care providers in many parts of California are straining to fill a unmet need, the state’s child care workers are poorly paid and almost twice as likely to live in poverty than workers overall.

California’s child care workers earn significantly less than their school-based counterparts. Given that about 95% of child care workers not based in schools are women, and 53% are African American or Latina (compared with 43% of the overall workforce), women—particularly women of color—are most affected by low pay in the child care workforce.

UC Berkeley found that in 2017, the median hourly wage for child care workers in California was $12.29—just one-third the median wage for kindergarten teachers. Earnings among child care workers track more with low-wage workers across California (defined as those earning less than two-thirds of the median wage). These low wages translate to about a quarter of child care workers living in poverty as compared to 14% of all working adults (ages 18-64)—according to the California Poverty Measure, developed by PPIC and the Stanford Center on Poverty and Inequality.

Low wages are just one piece of the poverty puzzle. Relative to all working adults, child care workers are more likely to have only part-time work (more than a third, compared with less than a quarter of the overall workforce), which is associated with dramatically higher poverty rates than full-time employment. Many have completed some college credit or have an associate’s degree (44%), but just a fifth have a four-year degree, in a workforce where more than a third of working adults have four-year degrees. And while people working in child care are as likely to have children as the average working adult, those who do are more likely to be parenting alone (11%) than the average worker (6%).

The social safety net is an important part of helping child care workers make ends meet. Half of all child care workers benefit from at least one safety net program or tax credit, with the two largest being CalFresh (25%) and the federal Earned Income Tax Credit (37%). Without this assistance, poverty among child care workers would be even higher—2.5 points higher without the Earned Income Tax Credit, and 2.1 points without CalFresh. Minus all major safety net programs, one in three child care workers would live in poverty.

Recent policy changes could start to boost incomes for child care workers. Expanded eligibility for 18–24-year-olds for the state’s new Earned Income Tax Credit, starting in 2019, will specifically help the 20% of the workforce who are under 25. Steady increases in California’s minimum wage could improve earnings of child care workers employed by providers subject to minimum wage laws. Yet many workers are self-employed, providers often operate with limited incomes, and the cost of care itself is already high for low-income families. Minimum wage increases will likely result in a better-paid child care workforce only if they are accompanied by sector-wide changes aimed at making child care both affordable and accessible.

The needs of child care workers will affect efforts to improve and expand California’s complex child care system. While the state and federal governments have begun to increase access to child care with expanded programs and additional funding, improving living standards for child care workers will be a major challenge for California’s next governor.

Poverty in California Is High by Any Measure

The Census Bureau recently released updated income and poverty statistics for the years 2015–2017 combined, including information on the Supplemental Poverty Measure (SPM) for states. The SPM updates official poverty statistics, which are released annually, by accounting for the varying cost of housing across states and the impact of key social safety net programs like federal and state Earned Income Tax Credits (EITCs). According to the SPM, California continues to have one of the nation’s highest poverty rates, neck-and-neck with Florida (18.1%) and Louisiana (17.6%). While California’s poverty rate for 2015–2017 was 19%, the national poverty rate was much lower, at 14.1%.

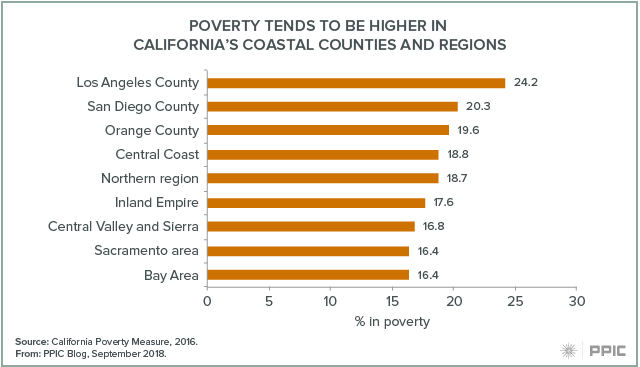
The California Poverty Measure (CPM), a collaborative effort by PPIC and the Stanford Center on Poverty and Inequality, provides additional detail needed to understand our large, complex state. It takes into account both the varying cost of living and the poverty-mitigating role of social safety net programs like the EITC and CalFresh within different regions of California. PPIC published CPM estimates in July indicating that 19.4% of Californians lived in poverty in 2016. Poverty rates are highest in certain coastal areas, including Los Angeles County, where the mix of the high cost of housing, employment opportunities for low-skilled workers, and access to large-scale social safety net programs create particularly challenging circumstances.

Blog figure: Poverty tends to be higher in coastal counties and regions

Despite the important role of social safety net programs, employment is a key factor in determining poverty status. Adults working full time and for the whole year have a poverty rate of just 8.3%, while nearly a quarter (23.5%) of those working less are in poverty. At the same time, employment does not eliminate poverty: 44.6% of working adults in poverty are actually working full time, year round.

Blog figure: Close to half of working poor adults in California are working full time, year round

What can policymakers do to improve the situation in California? The good news is that there are diverse opportunities to address poverty. Moderating housing costs, supporting proven employment and training programs, and vigorously supporting social safety net programs all offer opportunities to improve the well-being of disadvantaged Californians.