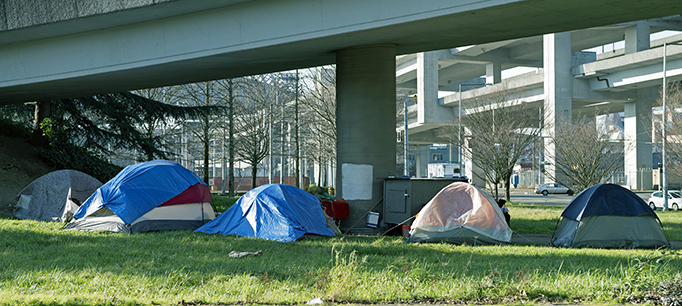
Geographic Variation in Poverty across California

Each year, when we update the data on poverty in California, we remark on how widely poverty rates vary across counties. In Los Angeles County, 24.3% of residents are poor, compared with just 11.8% of those in El Dorado County, according to the California Poverty Measure (CPM). The CPM is a collaboration between PPIC and the Stanford Center on Poverty and Inequality that adjusts for regional housing costs and incorporates resources from major social safety net programs.

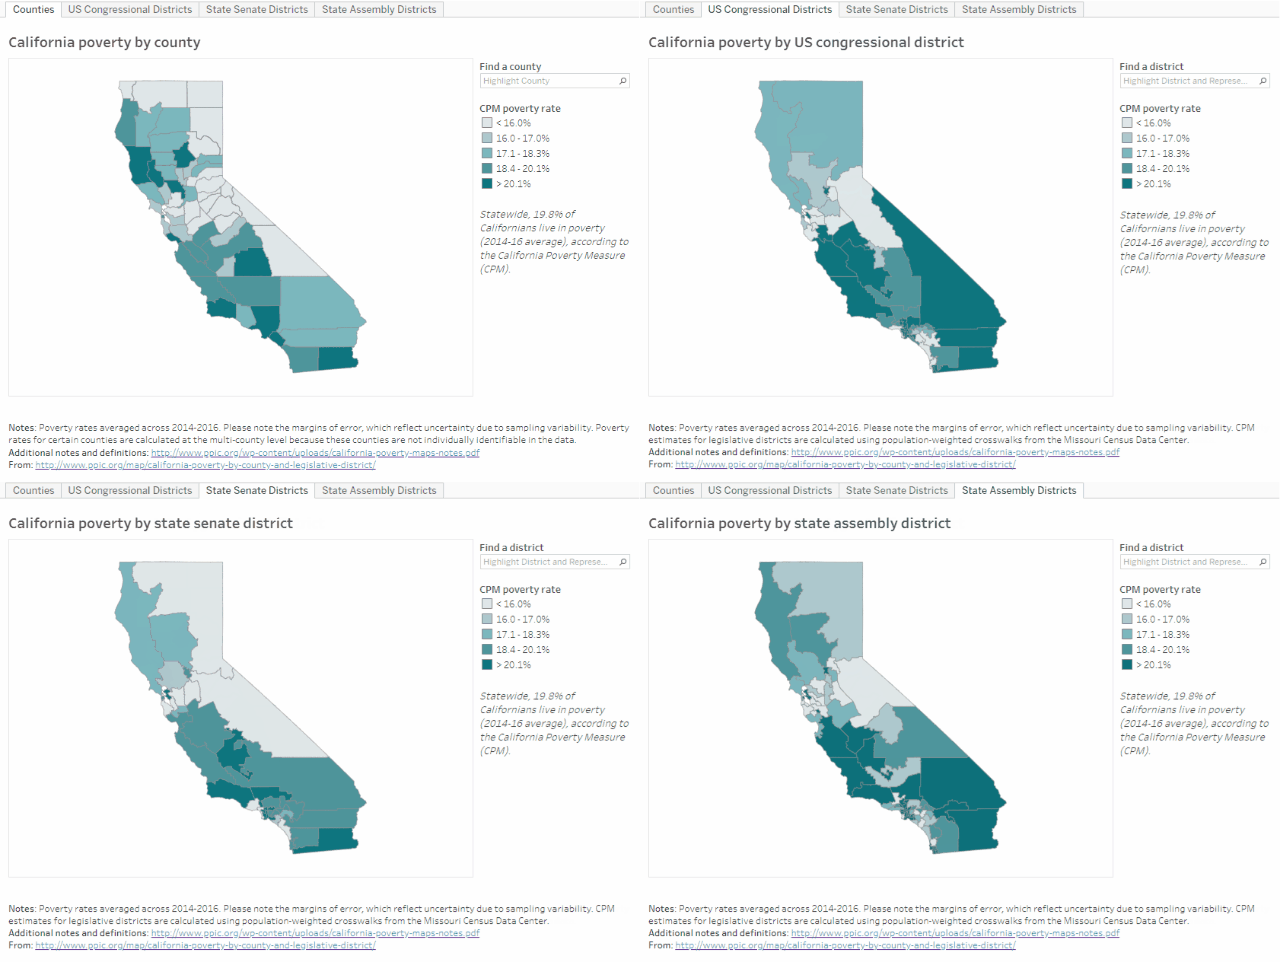
Our new interactive maps highlight the dramatic variation in poverty across counties and US congressional, state senate, and state assembly districts. Overall, the maps show high rates of poverty in coastal and southern California, and lower rates in the northern and Sierra regions. This pattern is driven by a variety of factors: poor families in coastal, urban regions can earn relatively higher incomes, but this is often outweighed by high costs of living and reduced eligibility for safety net programs. In contrast, high poverty rates inland and along the north coast are driven by low incomes and limited employment—despite substantial poverty reduction by the social safety net.

These maps allow leaders from counties—where social safety net programs are often implemented—and legislative bodies—where program funding is allocated—to learn more about poverty and the impact of the safety net in their region.

Legislative districts see even greater disparities in poverty than counties do. Across assembly districts, for example, poverty rates differ by more than 30 percentage points, ranging from 7.8% in Assembly District 16 (Baker, R) in eastern Contra Costa County to 40.7% in Assembly District 59 (Jones-Sawyer, D) in central Los Angeles. This range reflects differences in the number of counties and assembly districts, as well as the size of their populations. California has 80 assembly districts with roughly equal populations, so they represent more slices of the state—especially in urban, densely populated counties.

Comparing counties and legislative districts draws attention to the ways that boundaries can bring forth or obscure populations. In the Inland Empire (San Bernardino and Riverside) in southeastern California, county and state senate district lines show poverty rates below the state average of 19.8% from 2014–16, ranging from 18.2% to 18.9%. But state assembly and US congressional districts in that area have high poverty rates, ranging from 20.5% to 22.7%—and are adjacent to districts with much less poverty.

The maps provide a rich resource for learning about the geographic variation of poverty in California. Since the factors driving poverty vary across the state, effective approaches for reducing poverty may vary too, as our previous research on child poverty has shown. For additional detail, the maps allow users to download estimates on the impact of major social safety net programs on poverty in different regions.

Nearly Half of the Working Poor Are Working Full Time and Year Round

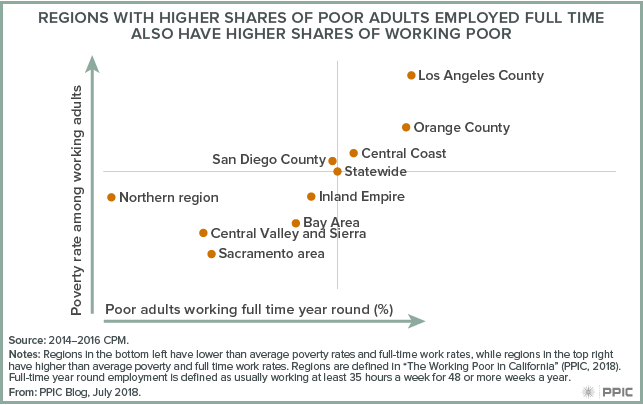
Roughly 2 million out of 16 million working Californians (ages 25‒64) live in poverty, according to California Poverty Measure (CPM) estimates—and nearly half (45%) of these workers are employed full time and year round.

We see a positive association between poverty rates and rates of full-time, year-round employment across regions. In other words, in areas of the state with higher shares of poor adults working full time—including Los Angeles and Orange Counties—the rates of poverty among working adults are also higher.

In those regions, working poverty is clearly not mainly attributable to working insufficient hours. It is driven by wage rates and other factors—measured in the CPM—like the cost of living, necessary expenses, and access to safety net resources (or lack thereof). For many of the working poor, the most promising strategies for improving wages require access to high-quality education and training.

The Federal Farm Bill Could Affect CalFresh

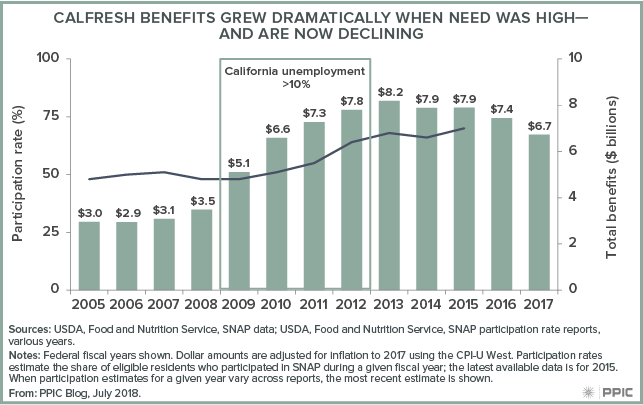
The federal Farm Bill is due for reauthorization in Congress, but its fate is still uncertain—Senate and House versions differ substantially. The largest share of spending in—and the most contentious aspect of—the bill is the Supplemental Nutrition Assistance Program (SNAP), known as CalFresh in California. CalFresh is the state’s main food assistance program, helping nearly 4 million Californians afford groceries each month. The Senate bill leaves net SNAP funding largely unchanged. The House bill would trim costs significantly, in part by revamping work requirements and limiting state flexibility in setting eligibility guidelines. These changes, which would reduce the number of program recipients, are being proposed at a time when the SNAP caseload is declining nationwide, after growing substantially during and after the Great Recession.

In California, policymakers have focused in recent years on getting more eligible Californians enrolled in CalFresh—the state had the lowest participation rate in the nation for a number of years. The share of those eligible who received benefits grew from about 50% to 70% between 2009 and 2015 (the most recent estimate)—but this improved participation rate is still near the bottom. Nonetheless, the California Poverty Measure estimates that CalFresh benefits kept more than 800,000 residents out of poverty in 2015.

Even as participation rates have been rising, decreases in demand are causing CalFresh benefit costs to fall—from $7.4 billion to $6.7 between 2016 and 2017 alone. Whether or not federal policies change, program costs are likely to continue to fall in the next year—unless the state enters a recession and the need for food assistance rises.

Testimony: Safety Net Plays Key Role in Reducing Poverty

Sarah Bohn, research fellow at the Public Policy Institute of California, testified today, February 14, 2018, before the Senate Budget and Fiscal Review Committee, Informational Hearing on Human Services. The topic of today’s hearing: poverty and social safety net programs. Here are her prepared remarks.

Poverty is high in California, and it has not improved as much as the economy has in recent years. In fact, California’s poverty rate is highest in country, according to our estimates. Throughout this presentation, I will rely on the California Poverty Measure research (a joint effort between PPIC and Stanford) that accounts not only for earnings but also for benefits from major safety net programs and the cost of housing to give a comprehensive, accurate, and state-specific account of the resources families have on hand to meet their basic needs.

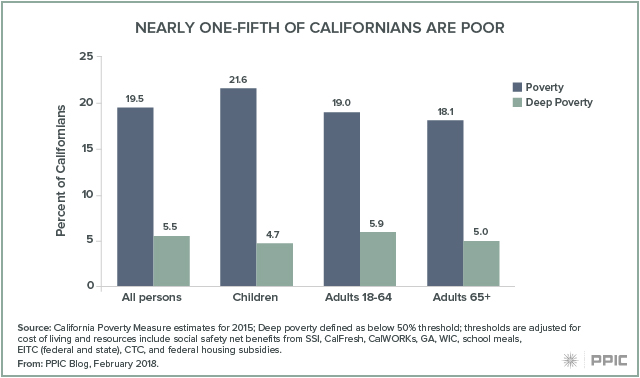
We find that 19.5% of Californians were poor as of 2015—that means 7.5 million people living below a basic needs threshold (less than $30,000 in total resources for a family of four). The poverty rate is slightly higher for children at 21.6%. In addition, 5.5% of Californians are in deep poverty—which means they have less than half of what it takes to meet basic needs, or about $15,000 annually for a family of four. Overall, the share of Californians in poverty remains higher than it was before the last recession started and is relatively high by historical standards.
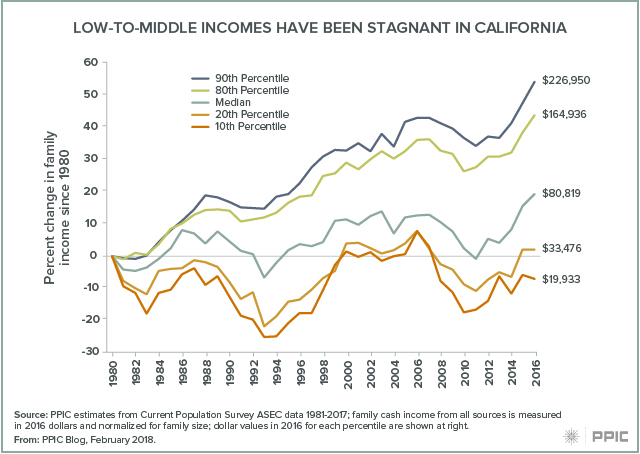
To understand why, providing a long-term picture of how all Californians have fared is helpful. For the bottom half of California families, income has been quite stagnant for at least the past three decades. The bottom 10% are earning less than they were in 1980 (about $20,000) and the bottom 20% are earning just 4% more.  Compare that to the top 10%, which are earning 54% more than they did in 1980.  Much of this is driven by how economic opportunities (especially in the labor market) have changed and polarized – generating both high rates of poverty and high income inequality.
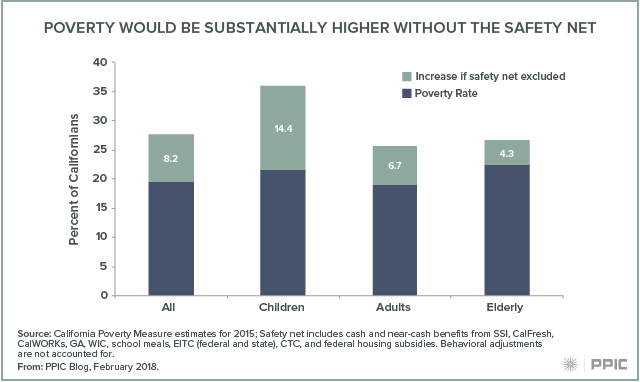
How does this relate to the safety net? With stagnant earnings since 1980, safety net resources become an even more important factor in making ends meet as cost of living increases. Our estimates show that major safety net program benefits play a critical role in mitigating poverty. The California poverty rate would be 8 points higher were it not for these programs—that means an additional 3.1 million Californians would be in poverty. The deep poverty rate would more than double were it not for the safety net.
Looking specifically at CalFresh, CalWORKs, and SSI—the programs we’re focusing on today—we estimate that a large number of Californians are moved out of deep poverty or poverty because of the program benefits they or their family members receive.
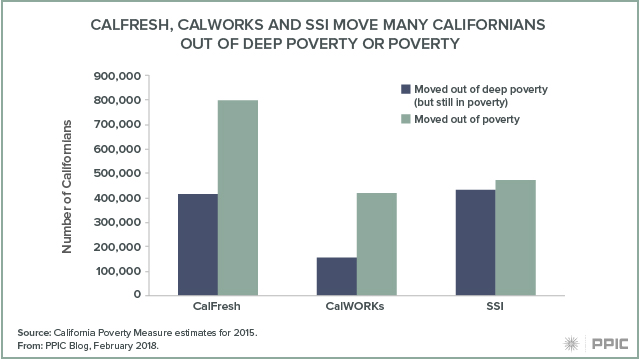
Specifically, CalFresh moves 400,000 people out of deep poverty; 800,000 are moved out of poverty.  The numbers are a bit smaller for CalWORKs families (150,000 from deep poverty and 400,000 from poverty), in part because the program reaches fewer families. And finally, SSI moves about 400,000 out of deep poverty and about the same number out of poverty. Keep in mind that families on these programs may be far from the poverty line, so even if they are not technically moved out of poverty, program resources can still be an important way for them to meet basic needs. Families may also benefit from multiple programs in combination.

The safety net plays a critical role in helping make ends meet but income from work is still the biggest component of family resources, even for families in poverty. And as we saw over the long term, the trend in income alone is not positive for families in the bottom half of the income distribution. So in addition to helping families manage in the short term, ideally social safety net programs could contribute to mobility over the long term, counteracting the trend in income inequality. However, one factor limiting the potential impact of safety net resources is the high cost of living in California, driven mostly by housing but also other living expenses like child care and medical costs.

After we consider these other expenses, we end up with poverty rates that are high compared to other states and high within and across California as well.  This is what the poverty looks like across a number of demographic characteristics.
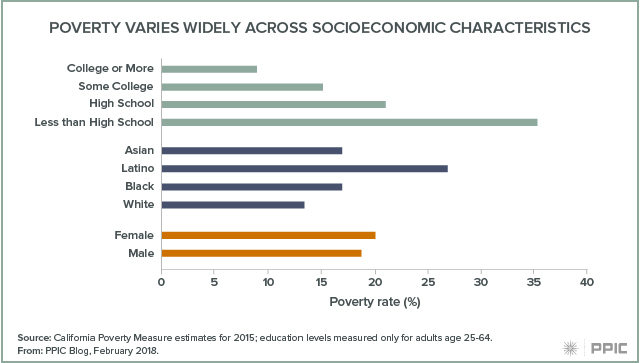
You’ll notice that the incidence of poverty varies the most across education levels (and here we’re only looking at adults age 25–64 who’ve had enough time to acquire education). Men and women are about equally likely to be in poverty. Latinos in California are twice as likely to be poor as white residents (27% vs. 13%), and black and Asian residents fall in between.

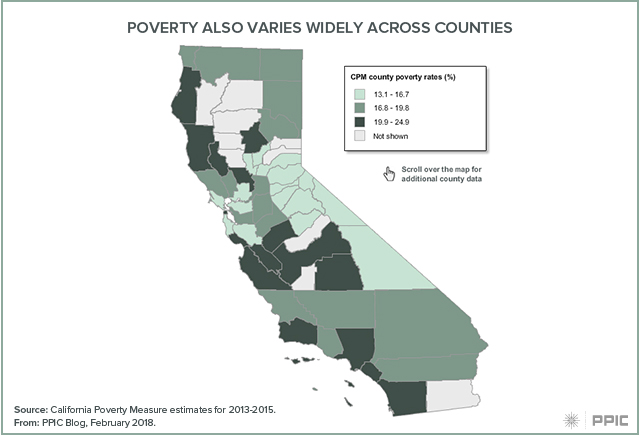
Across the state, poverty varies considerably. The highest rate is in Los Angeles, at 25% (with Santa Cruz and Santa Barbara close behind). The lowest is in Placer County at 13% (nearby Sierra counties of Alpine, Mariposa, and others have similar rates).
As we all see day to day, poverty is concentrated much more narrowly than at the county level—sometimes it varies neighborhood to neighborhood. In fact, we find that the highest and lowest rates of child poverty in the state are in neighborhoods of Los Angeles that are just 20 to 30 miles apart. Similar differences can be seen in neighborhoods across the Silicon Valley. The concentration of poverty raises concerns that there are other factors about places—beyond just income level—that diminish the chances for residents to get ahead.
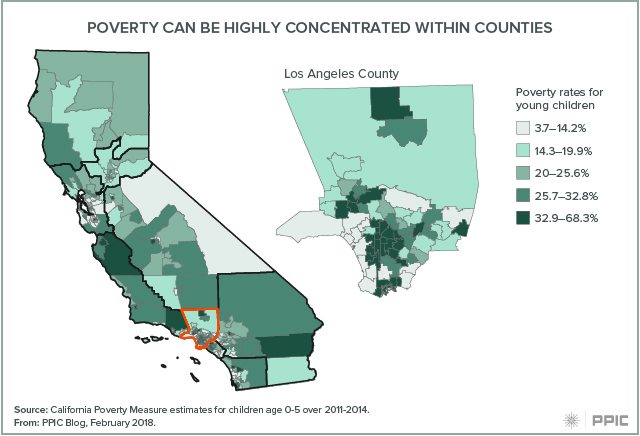
This map is surprising because it does not track one-for-one with unemployment or other economic indicators. Access to good-paying jobs is the number one factor in preventing poverty. But it is not sufficient because the cost of living (housing, child care) looms large—and those expenses tend to be higher in exactly the places where unemployment is lower and wages higher, making it hard to make ends meet even with a full-time job. High living expenses coupled with the long-term stagnation in low to middle incomes yields the high rates of poverty we see today even with very low unemployment rates.

In this context it is critically important to be aware of the role social safety net programs play in helping Californians make ends meet—as I mentioned the poverty rate would be 40% higher were it not for major means tested programs in California.  Nonetheless, California has the highest poverty rate in the country—even with a booming economy—so it is exactly the right time to discuss where the safety net falls short and what needs to be done.

Examining the Federal EITC’s Impact on Poverty

The federal Earned Income Tax Credit (EITC) plays an important role in keeping Californians out of poverty. The credit supplements earnings for low-income workers at tax time, providing $2,400 on average to qualified tax filers.

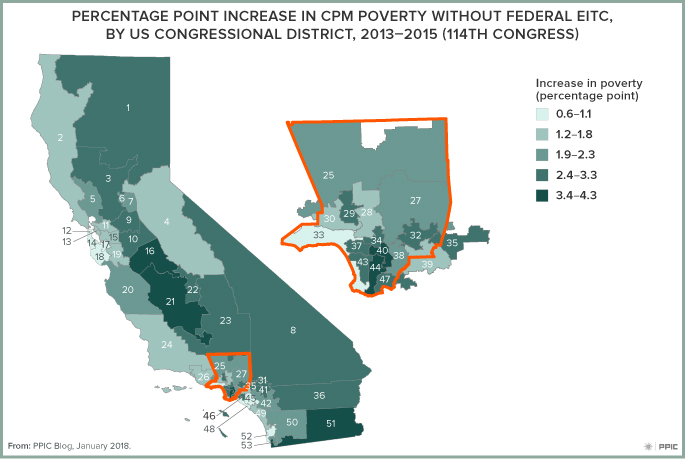
Without the EITC, we estimate an additional 814,000 Californians would live in poverty, according to the latest data from the California Poverty Measure (CPM), an ongoing collaboration between PPIC and the Stanford Center on Poverty and Inequality. This reduction in poverty makes the EITC nearly comparable to CalFresh (formerly known as food stamps), the safety net program that keeps the most Californians out of poverty. Our estimates reflect data from 2013 to 2015 and do not include the state EITC, which was introduced in 2015 and expanded in 2017. The state EITC lowers poverty by very little because the largest credits go to workers with very low earnings, whose families mostly live well below the poverty line.

The role that the EITC plays varies widely across regions. Statewide, the poverty rate would be 2.2 percentage points higher without the EITC (22.6% instead of 20.4%). But in Lake and Mendocino Counties (combined), the poverty rate without the EITC would be 4.1 percentage points higher than it is currently, reaching 26.8%. Poverty in Marin County, on the other hand, would increase only 0.2 points, to 16.5%. Such differences could be due to several factors—for example, the share of eligible families who take advantage of the credit and the local availability of jobs.

PPIC recently released data showing poverty rates, poverty thresholds, and the effects of safety net programs not only by county, but also by state assembly and senate district and by US congressional district. These data provide an opportunity to dig more deeply into the varying roles of safety net programs across the state.

The EITC, for example, has the largest effect in some of the highest-poverty congressional districts, including District 40 (Rep. Roybal-Allard) and District 44 (Rep. Barragán). But in some relatively high-poverty districts it plays a smaller role (District 46, Rep. Correa). The data we provide can be a starting point for investigating—and potentially remedying—incomplete access to the EITC.


Child Poverty and California’s High Cost of Living

A quarter of young children in California live in poverty, yet the local variation in poverty rates is dramatic. Our recent report shows, for example, that the areas with the lowest and highest rates of child poverty in the state are less than 20 miles apart: child poverty is 4% in Redondo Beach, Manhattan Beach, and Hermosa Beach in Los Angeles County and 68% near southeastern LA City. (Data is for 2011–2014 combined, the most recent available).

Families adapt to California’s high cost of living in ways that vary across the state. The interactive map that accompanies our report allows stakeholders to investigate how their local area (defined to have a population of roughly 100,000) stacks up relative to other areas, their region, and the state as a whole.

For example, Selma, Kerman, and Coalinga make up a local area just west and south of Fresno. The area has a relatively high poverty rate of 30% among young children. Most of these children’s parents have limited education: 55% lack a high school degree compared with a statewide average of 37%. But for the most part they are working full-time (62% vs. 50% statewide). They also report the lowest annual housing costs ($5,888) of any area in the state. (We standardized this cost to represent a family of four.) This means they have a relatively low housing burden. Specifically, 18% of families living in poverty in this area use over half of their family resources to pay for housing, compared to the statewide average of 32%.

At the same time, 52% of poor children in this area live in overcrowded housing—about the same as in the state as a whole (55%) and higher than the regional average in the Central Valley (46%). Also, the share of working parents in these poor families who commute 60 minutes or more each way is relatively high at 14%, compared with 10% in the state as a whole.

In sum, the picture that emerges shows families of young children in poverty in this local area tend to have low housing costs relative to other parts of the state. Nevertheless, the cost of housing in inland California is still high compared to the rest of the country, and the data suggest poor families with young children in Selma, Kerman, and Coalinga are indeed making adaptations to cope with these costs—such as living in more crowded conditions and, in some cases, commuting long distances.

Child poverty is a difficult problem, both because it is so high in California and because the family circumstances that poor children experience can differ so much. Investigating varying patterns of housing and commuting across the state can help suggest how policies aimed at reducing the incidence—or severity—of poverty can be tailored to meet local and regional needs.

Income and Inequality Vary Widely Across California

Income inequality has been growing for decades and—despite the recovery from the Great Recession—remains historically high. Today, the low end of the income spectrum (the 10th percentile) in California is 19% lower than what it was in 1980, and the upper end of the spectrum (90th percentile) is 40% higher, according to our new report. As a result of these trends, the ratio of high to low incomes—a key measure of income inequality—is nearly twice the size it was three decades ago.

In Los Angeles County, high-income families have 15 times more income than low-income families.

Both income and income inequality vary substantially across California. Looking at after-tax family incomes, we find that, in 2014, the Bay Area had the highest incomes. However, the gap between high and low incomes was biggest in Los Angeles County, the Central Valley, and northern parts of the state—places where low incomes tend to be particularly low. For example, in Los Angeles County, high-income families have 15 times more income than low-income families. At the other end, the Inland Empire and Orange County have the lowest income inequality.

Why does the gap between families across the income spectrum matter? In part because low-income families may have insufficient resources to meet their basic needs. If family incomes are widely spread (inequality is high) but even families at the low end of the economic spectrum are able to attain a sufficient level of well-being (poverty is low), income inequality may not be a big problem. But that is not the case: one in five Californians live in poverty.

Inequality itself may also raise concerns for a host of social, cultural, and political reasons. One economic consequence of inequality is that the greater spread of incomes may inhibit upward mobility. Recent research finds a correlation between income inequality in a region and the upward mobility of its children. Low-income children who grew up in areas with higher income inequality have, on average, lower incomes as adults than otherwise similar children who grew up in regions with less income inequality. In this and other ways, the consequences of growing income inequality may play out over generations, highlighting the need for policies that take this long-range view into account.

Source: Based on California Poverty Measure data, 2012–2013 (Bohn and Danielson 2016).
Notes: Dollar amounts are rounded to the nearest $1,000. Income shown includes cash from work and retirement sources net of federal and state income and payroll taxes; low-income tax credits are not included. Dollar amounts adjusted to represent a family of four. The inequality ratio shown is calculated as the ratio of the 90th percentile of income to the 10th percentile of income; higher numbers indicate greater income inequality. Regions defined as follows. Northern: Butte, Colusa, Del Norte, Glenn, Humboldt, Lake, Lassen, Mendocino, Modoc, Nevada, Plumas, Shasta, Sierra, Siskiyou, Tehama, and Trinity Counties; Sacramento area: El Dorado, Placer, Sacramento, Sutter, Yolo, and Yuba Counties; Bay Area: Alameda, Contra Costa, Marin, Napa, San Francisco, San Mateo, Santa Clara, Santa Cruz, Solano, and Sonoma Counties; Central Valley and Sierra: Alpine, Amador, Calaveras, Fresno, Inyo, Kern, Kings, Madera, Mariposa, Merced, Mono, San Joaquin, Stanislaus, Tulare, and Tuolumne Counties; Central Coast: Monterey, San Benito, San Luis Obispo, Santa Barbara, and Ventura Counties; Inland Empire: Imperial, Riverside, and San Bernardino Counties. Los Angeles, Orange, and San Diego Counties are shown separately.

Learn more

Read the report Income Inequality and the Safety Net in California

Testimony: Measuring Poverty

The Assembly Human Services Committee held a hearing on Tuesday, July 14, to consider a joint resolution regarding official poverty measurement tools. PPIC research fellow Sarah Bohn provided background on official poverty statistics and explained how different measurement tools affect our understanding of poverty in California. Here are her prepared remarks.


My name is Sarah Bohn, I am a research fellow at the Public Policy Institute of California. PPIC is a nonpartisan, independent research institute and as such does not take positions on bills before the legislature. I am here today to inform the committee on facts related to Assembly Joint Resolution 22 (AJR 22). As some of you know, PPIC, in collaboration with the Stanford Center on Poverty and Inequality, has been deeply involved in research on alternative poverty measurement for the past three years. I will provide background on the shortcomings of official poverty statistics and offer an updated view of poverty measurement—and poverty in California.

According to official statistics, poverty is significantly higher (50% higher) than it was 50 years ago, when the War on Poverty began. As we shall see, this finding should be taken with a big grain of salt. Poverty status, as you know, is based on how family income compares to the “federal poverty line.” This was developed in the early 1960s as the first working definition of poverty in the U.S. It is based on family budgets of that time, when a typical family spent one-third of its income on food. So the threshold was (to simplify a bit) three times the cost of food a family would need to meet basic needs. While this was a novel use of the facts and information available then and was hugely important in creating a standard metric to inform policy, it’s hard to apply the same metric to modern families and derive a clear understanding of how families—and policy—are doing. There are two main reasons for this: (1) the cost of living and family budgets have shifted considerably, with families spending more on housing, work expenses (like commuting and child care), and medical care and less on food overall (2) several government programs have changed and expanded, but are not counted in family income data in the official poverty measure. For these reasons, official poverty statistics are hard to interpret; they essentially compare a part of family resources to an outdated benchmark.

Two current measures—the Census Bureau’s “Supplemental Poverty Measure” and the PPIC-Stanford “California Poverty Measure” (which uses a similar methodology)—update and realign the basic poverty concept that is now more than 50 years old. There is quite a lot of momentum and agreement around the benefits of these “supplemental” measures. In summary, the methodology aims to improve on official poverty measurement in the following ways. First, both measures use detailed data on what families actually spend to meet basic needs, rather than relying on a 1960s-era approximation. Second, these metrics allow for the cost of living to vary (conservatively), depending on where one lives. Third, they make use of a comprehensive estimate of resources families have on hand, which includes cash income, program benefits, taxes paid or credited, net of medical and work expenses.

The Supplemental and California Poverty Measures provide new insights to poverty. I’ll highlight a couple that are especially related to the impact of policy. First, I’ll return to the effects of the War on Poverty. Using supplemental measures, researchers find a clear downward trend in poverty—specifically, that government programs reduced poverty by 15 percentage points since the mid-1960s. These are facts that cannot be uncovered by official poverty data, which, you may recall, suggests that poverty rates rose 50 percent despite policy efforts. Second, poverty in California today would be much higher were it not for the safety net. Without major programs like CalWORKs, CalFresh, the federal Earned Income Tax Credit, and housing subsidies (among others) nearly 40 percent of children in California would be poor—or 30 percent of state residents overall.

It’s possible that the safety net in California could have an even longer reach than it already does. For one, increasing program participation among eligible families could reduce poverty. Also, because many poverty programs are not scaled to cost of living, their ability to materially affect families in poverty varies substantially across the state. In high-cost areas, safety net benefits reduce poverty by about 30 percent, but they reduce it by 50 percent in the Central Valley and far north. Poor families in coastal (and the most populous) parts of the state face costs $7,000 to $12,000 higher than the federal poverty line accounts for. Although we find that poor families in high cost areas are more likely to be working—and earning more—than their counterparts elsewhere, their earnings are not enough to boost them above the more realistic cost-adjusted supplemental poverty threshold. But their slightly higher earnings (which are still low by California standards) make them less likely to qualify for some safety net programs.

These examples scratch the surface of what is possible using the tools of improved measures like the Supplemental and California Poverty Measure. We also hope to use our research to assess how proposed changes to programs could move families out of poverty. But beyond these efforts, I would argue that simply tracking poverty in and across California and the U.S.—using truly comprehensive and accurate metrics—should be a regular contribution to the policymaking process. For those of us at PPIC and for other researchers involved in poverty research across the country, including those at the Census Bureau, alternative measures of poverty are still in their early phases, and, as such, rely on policymaker awareness and on funding to continue to produce. Thank you for your interest in the topic and your time today.


High Poverty Rate Persists

Although the state’s economy has rebounded, the latest poverty statistics suggest there’s been little improvement in the share of Californians struggling to make ends meet.

More than 1 in 5 Californians—or 8.1 million people—were living in poverty in 2012, the most recent year for which we have data. This is according to the California Poverty Measure, a comprehensive metric developed by PPIC and the Stanford Center on Poverty and Inequality. This share is about the same as it was in 2011. Rates were highest among children, with about 1 in 4, or 2.3 million, living in poverty—virtually unchanged from 2011.

Why? Although California’s overall economy is growing, not all have shared equally in the recovery. The reasons for this are both specific to this economic recovery and true more generally of economic upturns. The unemployment rate remains higher than it has been since 2004 and a high share of workers—by historical standards—have given up looking for work or are underemployed (working part time when they would prefer full time, for example). As is typical of past patterns of recession and recovery, high-income families tend to rebound most quickly, followed by middle-income and finally low- income families. This means that improvements in poverty metrics tend to lag behind other indicators of how the economy is faring.

The good news is that the social safety net—programs like CalFresh and the federal Earned Income Tax Credit—helped many families through the recession and still plays an important role in keeping families out of poverty. Without it, more families—including 1.3 million children—would be poor. We estimated that without these and other safety net programs, poverty would be roughly a third higher in the state as a whole. This cushioning effect of the safety net decreases swings in poverty, meaning that a slowly changing poverty rate is partly an indication that the safety net is working.

Measuring Child Poverty

At a well-attended briefing in Sacramento this week, PPIC research fellow Sarah Bohn described the findings in a newly released report, Child Poverty and the Social Safety Net in California, that she co-authored with PPIC research fellow Caroline Danielson, who also attended.

The authors found that about a quarter of California children live in poverty and an additional 26% live in “near poverty,” a threshold defined by incomes between 100 and 150% of the official poverty threshold (up to $46,000 annually for a family of four on average). The poverty analysis was based on the California Poverty Measure, developed by researchers at PPIC and the Stanford Center on Poverty and Inequality. Unlike the traditional federal measure, the new analysis considers regional cost-of-living differences, as well as assistance from government social programs, in measuring poverty.

Bohn also talked about the report and related issues today at an event titled Attacking Poverty by Connecting College Education & Workforce Development, hosted in Los Angeles by state senator Holly Mitchell.