Poverty in California Is High by Any Measure

The Census Bureau recently released updated income and poverty statistics for the years 2015–2017 combined, including information on the Supplemental Poverty Measure (SPM) for states. The SPM updates official poverty statistics, which are released annually, by accounting for the varying cost of housing across states and the impact of key social safety net programs like federal and state Earned Income Tax Credits (EITCs). According to the SPM, California continues to have one of the nation’s highest poverty rates, neck-and-neck with Florida (18.1%) and Louisiana (17.6%). While California’s poverty rate for 2015–2017 was 19%, the national poverty rate was much lower, at 14.1%.

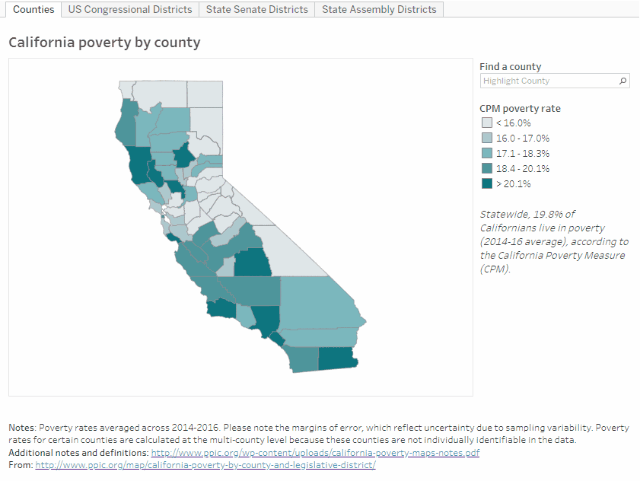
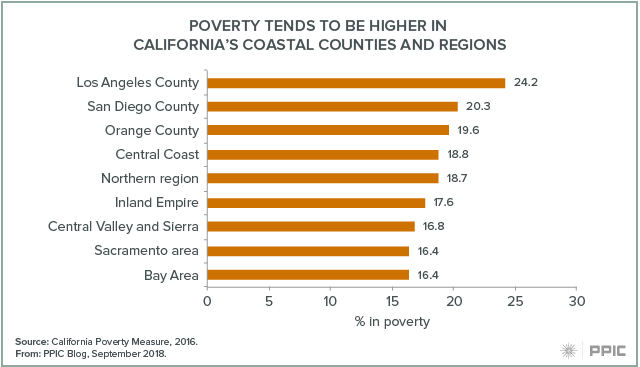
The California Poverty Measure (CPM), a collaborative effort by PPIC and the Stanford Center on Poverty and Inequality, provides additional detail needed to understand our large, complex state. It takes into account both the varying cost of living and the poverty-mitigating role of social safety net programs like the EITC and CalFresh within different regions of California. PPIC published CPM estimates in July indicating that 19.4% of Californians lived in poverty in 2016. Poverty rates are highest in certain coastal areas, including Los Angeles County, where the mix of the high cost of housing, employment opportunities for low-skilled workers, and access to large-scale social safety net programs create particularly challenging circumstances.

Blog figure: Poverty tends to be higher in coastal counties and regions

Despite the important role of social safety net programs, employment is a key factor in determining poverty status. Adults working full time and for the whole year have a poverty rate of just 8.3%, while nearly a quarter (23.5%) of those working less are in poverty. At the same time, employment does not eliminate poverty: 44.6% of working adults in poverty are actually working full time, year round.

Blog figure: Close to half of working poor adults in California are working full time, year round

What can policymakers do to improve the situation in California? The good news is that there are diverse opportunities to address poverty. Moderating housing costs, supporting proven employment and training programs, and vigorously supporting social safety net programs all offer opportunities to improve the well-being of disadvantaged Californians.

Geographic Variation in Poverty across California

Each year, when we update the data on poverty in California, we remark on how widely poverty rates vary across counties. In Los Angeles County, 24.3% of residents are poor, compared with just 11.8% of those in El Dorado County, according to the California Poverty Measure (CPM). The CPM is a collaboration between PPIC and the Stanford Center on Poverty and Inequality that adjusts for regional housing costs and incorporates resources from major social safety net programs.

Our new interactive maps highlight the dramatic variation in poverty across counties and US congressional, state senate, and state assembly districts. Overall, the maps show high rates of poverty in coastal and southern California, and lower rates in the northern and Sierra regions. This pattern is driven by a variety of factors: poor families in coastal, urban regions can earn relatively higher incomes, but this is often outweighed by high costs of living and reduced eligibility for safety net programs. In contrast, high poverty rates inland and along the north coast are driven by low incomes and limited employment—despite substantial poverty reduction by the social safety net.

These maps allow leaders from counties—where social safety net programs are often implemented—and legislative bodies—where program funding is allocated—to learn more about poverty and the impact of the safety net in their region.

Legislative districts see even greater disparities in poverty than counties do. Across assembly districts, for example, poverty rates differ by more than 30 percentage points, ranging from 7.8% in Assembly District 16 (Baker, R) in eastern Contra Costa County to 40.7% in Assembly District 59 (Jones-Sawyer, D) in central Los Angeles. This range reflects differences in the number of counties and assembly districts, as well as the size of their populations. California has 80 assembly districts with roughly equal populations, so they represent more slices of the state—especially in urban, densely populated counties.

Comparing counties and legislative districts draws attention to the ways that boundaries can bring forth or obscure populations. In the Inland Empire (San Bernardino and Riverside) in southeastern California, county and state senate district lines show poverty rates below the state average of 19.8% from 2014–16, ranging from 18.2% to 18.9%. But state assembly and US congressional districts in that area have high poverty rates, ranging from 20.5% to 22.7%—and are adjacent to districts with much less poverty.

The maps provide a rich resource for learning about the geographic variation of poverty in California. Since the factors driving poverty vary across the state, effective approaches for reducing poverty may vary too, as our previous research on child poverty has shown. For additional detail, the maps allow users to download estimates on the impact of major social safety net programs on poverty in different regions.