When we use water, we’re also using energy—sometimes a little, sometimes a lot. Overall, water use accounts for about 20 percent of California’s electricity use and 30 percent of natural gas used by businesses and homes. This energy is used to supply, convey, treat, and heat water.
Where does it all go, and more importantly, how can we best save both water and energy?
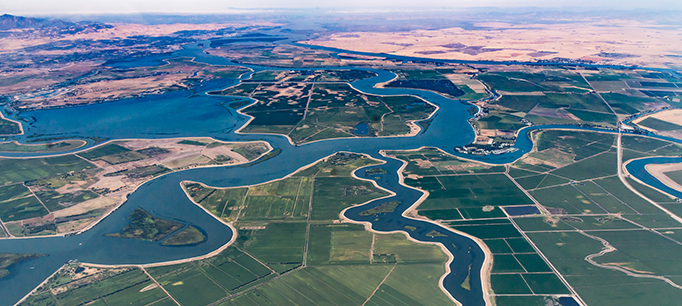
You might guess that our long-distance transport of water through the state’s network of canals and pumping stations is a big energy hog. The federal and state water projects combined move about a quarter of all water used in California. The State Water Project—which conveys water from the Sacramento–San Joaquin Delta to cities and farms in the San Joaquin Valley, the Central Coast, and Southern California—is the largest single user of electricity. But even so, the state’s water conveyance system is something of an energy sipper, accounting for just 4 percent of the sector’s total energy use.
Or maybe you’d assume that California farmers—who use about four times more water than the state’s urban areas—use the most water-related energy. But even though farmers pump some 10 million acre-feet of water in an average year, they use just 5 percent of California’s water-related energy.
Have you guessed it yet? Hint: The state’s cities, especially California households and industries, use by far the most water-related energy—and much of it goes down the drain.
Heating water is the most energy-intensive water-related activity. Some residential “end uses” of water—faucets, showers, and clothes washers—are energy hogs, accounting for 42 percent of all energy used in the water cycle. And in total, the residential, industrial, and commercial end uses of water account for more than 85 percent of energy used in the water sector. By comparison, supplying, pumping, and treating urban water make up about 5 percent.
Reducing the energy footprint of the state’s water cycle will require more reductions in hot water use.
A recent study, which looked at the energy use of supplying, pumping, and treating water, estimated that the energy savings resulting from drought-related urban water conservation to date has equaled the combined savings of all energy efficiency programs offered by the state’s major energy utilities. The study did not account for water heating or other energy-intensive uses of water.
California has been a leader in energy efficiency for many years. Its efforts include reducing energy use of washing machines and dishwashers—which together still use less energy than showers. Last year, the state’s energy commission adopted new standards (which went into effect this summer) that will cut water flow in showerheads by 20 percent. The move is expected to save more than 2.4 billion gallons a year in the first year—and enough energy to power more than 200,000 homes for a year.
To further reduce the energy footprint of the state’s water cycle, it would be most effective to continue to target reductions in hot water use. This can be done by changing our habits (such as decreasing water heater temperatures), improving water-heating efficiency, and reducing the energy intensity of some industrial processes.
Saving energy in the water sector also reduces greenhouse gas emissions—nearly 10 percent of the state’s emissions are directly associated with water use. California plans to reduce its emissions 40 percent below 1990 levels by 2030, and the water sector can provide some of the most cost-effective ways to meet that goal.
But as always in California’s water management, there is no one-size-fits-all solution. Local assessments—with state agencies’ support—are needed to evaluate cost-effectiveness of various solutions locally and across regions. The state could then use these assessments to devise a statewide plan for reducing the water sector’s energy consumption and greenhouse gas emissions.

Read California’s Water: Energy and Water (from the California’s Water briefing kit, October 2016)
Visit the PPIC Water Policy Center

 In fact, while low turnout in the 2014 general election put California farther behind other states, this year’s turnout almost brought the state up to the national average. As the graph shows, turnout in presidential elections has been climbing in all states since about 2000. But this is the first time that the upward trend has been stronger in California than elsewhere.
 One of the most historic turnarounds in California initiative history has been largely overlooked in the wake of the stunning presidential election results. Californians passed a recreational marijuana initiative this fall after rejecting a similar effort six years ago. The 2010 initiative, Proposition 19, failed with 46.5 percent of the vote. This year, Proposition 64 passed with 57.1 percent. How did support grow by 10.6 points, allowing this controversial policy to move into the victory column? The answers are found in both national and state trends.
 California public opinion mirrors these changing national attitudes. PPIC surveys have been repeating the Pew Research Center’s question for six years. In our surveys, the percent of adults saying “yes” to legalizing marijuana was below 50 percent before November 2010, when Proposition 19 failed. Support for legalization edged up to the majority in 2013. Some Californians apparently changed their minds about marijuana legalization after other states passed initiatives.
 The only majority supporters of Proposition 19 in 2010 were Democrats, liberals, and Californians under 35 years old. This fall, there were double-digit increases in the yes vote for Proposition 64 among Democrats, liberals, and residents under age 35. The consolidation of support in these groups was important in the 2016 California election context. This presidential election attracted a larger electorate with liberal leanings than the 2010 gubernatorial election did. That is reflected in the passage of several progressive reform and tax initiatives this November, as noted in an
  Proposition 64 still did not win by a landslide even with these impressive gains in the depth and breadth of support. Fewer than 50 percent in key demographic groups supported the initiative. They include Republicans (33%), conservatives (31%), Californians age 55 and older (45%), Latinos (47%), women (48%), and the non-college educated (49%). Obviously, many Californians did not jump on the bandwagon and vote for marijuana legalization this year.
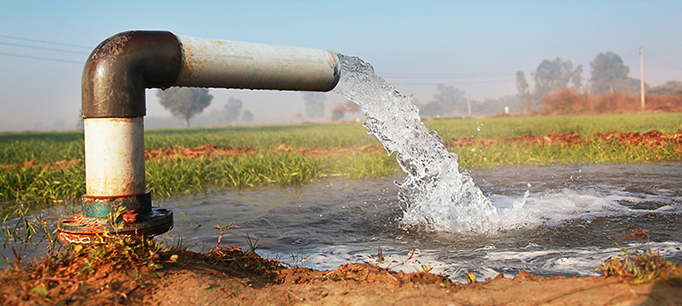
 PPIC:
PPIC: