California Community Colleges Are Transforming Developmental Education

With the passage of AB 705 in October 2017, California community colleges are in the midst of a major transformation of developmental education. The new law requires that community colleges restructure developmental education to maximize the likelihood that students will enter and complete transfer-level coursework in English and mathematics/quantitative reasoning in a one-year time frame.

Full implementation of AB 705 is expected no later than fall 2019. As colleges replace standardized test scores with high school records as their primary placement criteria, it is likely that the majority of entering students will enroll in transfer-level courses. To improve the likelihood of success, especially among students with the lowest high school performance levels, colleges are being encouraged to implement curricular reforms as well. Co-requisite remediation is an essential component of these reforms: it allows students who would otherwise be deemed underprepared to enroll directly in transfer-level math or English courses with concurrent remedial support.

While the vast majority of the state’s 114 community colleges have not yet implemented co-requisite models, a few colleges began experimenting with co-requisites and other reforms before the passage of AB 705. According to a recent PPIC report that looks at the efforts of these “early implementers,” co-requisites in English are more common than those in math. Nine California community colleges provided co-requisite courses in English to about 3,000 students in 2016–17 (the latest year of available data), and at least seven additional colleges began offering English co-requisite models in 2017–18.

Early implementer colleges have seen dramatic gains in the completion of transfer-level English courses. Results for the fall 2016 cohort show that 78% of all co-requisite students completed a college composition course within a year; this metric, known as throughput rate, will be used to measure success under AB 705. The throughput rate of co-requisite students is 50 percentage points higher than the throughput rate of students who started in traditional remedial courses (27%); it is 36 percentage points higher than the throughput rate of students who took one-term accelerated developmental English courses (42%), and similar to the throughput rate of students who enrolled in transfer-level English without co-requisite support.

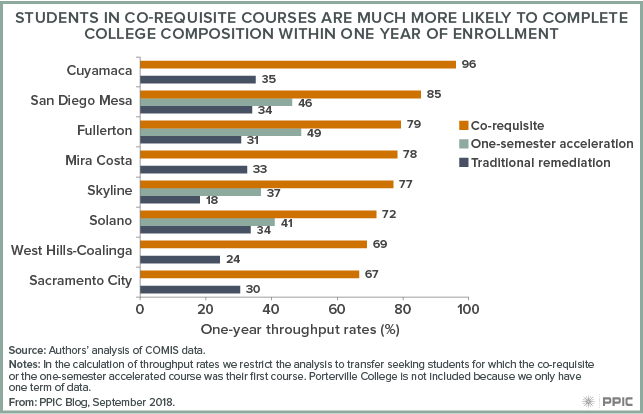
Throughput rates ranged from 67% to 96% across this group of colleges; rigorous research is needed to understand which factors are driving this variation. However, this early evidence—while not causal—does shed light on what we can expect to see in terms of student outcomes as more colleges move toward compliance with AB 705 requirements.

2020 Census: Counting the Bay Area

The decennial census plays an essential role in American democracy. Our series of blog posts examines what’s at stake for California and the challenges facing the 2020 Census, including communities that are at risk of being undercounted.  

PPIC’s interactive census maps are an important tool for Californians working to ensure an accurate census count. Using estimates from the Census Bureau and the Federal Communications Commission, they highlight hard-to-count communities across the state and pinpoint reasons why certain areas may be hard to reach.

Home to about 20% of the state’s population—some 8 million people—the Bay Area has clusters of hard-to-reach places throughout the region. Of the 10 counties bordering the San Francisco, San Pablo, and Suisun Bays, including neighboring Santa Cruz County, Alameda has the highest share of very hard-to-count areas (14% of census tracts) and Napa the lowest (3%). Households in these very hard-to-count areas are less likely to respond initially to census forms and are therefore at risk of being undercounted, according to Census Bureau estimates that draw on historical trends and local demographic characteristics (e.g., race/ethnicity, age, citizenship, and housing conditions). Compared to some of California’s central and southern counties, the Bay Area has lower shares of very hard-to-count places, but there are still several areas of concern.

Some highlights:

  • East Bay legislative districts have the highest concentrations of very hard-to-count neighborhoods in the region. In three East Bay legislative districts, 20% or more of census tracts are considered very hard to count: Congressional District 13 (Lee), State Senate District 9 (Skinner), and State Assembly District 18 (Bonta). Each of these districts represents Oakland and other parts of the East Bay.
  • But there are hard-to-reach neighborhoods throughout the Bay Area. In addition to Oakland, residents in the East Bay cities of Richmond, Berkeley, and Hayward are likely to be hard to reach, with around 30% of households in many neighborhoods predicted not to respond initially to the census. In San Francisco, particularly hard-to-reach neighborhoods include SoMa, the Mission District, and Bayview/Hunters Point. Other cities with many hard-to-count census tracts include Santa Cruz, San Jose, East Palo Alto, and Redwood City on the Peninsula, and Antioch, Santa Rosa, and Vallejo in the North Bay. It is important to keep in mind that communities may be hard to count for multiple reasons.
  • Understanding local population trends can help guide effective outreach. Compared to the rest of the state, Bay Area counties tend to have lower-than-average shares of young children, African Americans, Latinos, and Native Americans—populations that are typically undercounted in the census. Nevertheless, many neighborhoods have relatively high concentrations of young children and people of color—and are still at risk of being undercounted. For example, undercounting people of color in 2020 could significantly misrepresent communities in Richmond, Oakland, East Palo Alto, and Bayview/Hunters Point.
  • Low responses from noncitizens could lead to an undercount, especially in the South Bay.
    Noncitizens may be less likely to respond to the 2020 Census due to the planned addition of a citizenship question and concerns about deportation and privacy. Nearly 18% of people in Santa Clara County are noncitizens, compared to just under 14% statewide. Noncitizens make up about 15% of residents in Alameda and San Mateo Counties as well. In many neighborhoods—including parts of Fremont, Sunnyvale, Cupertino, and Redwood City—more than 30% of residents are noncitizens.
  • Housing conditions may make some Bay Area residents particularly hard to reach. Several neighborhoods in the East Bay, San Jose, Redwood City, and Santa Cruz have relatively large shares of housing units that are rentals, overcrowded rentals, and/or mobile homes—a reflection of how residents are coping with some of the most expensive housing markets in the country. These conditions can make it harder for the Census Bureau to find and count residents. In some parts of San Jose, for example, one in four rentals is overcrowded. Reaching homeless residents during the three-day window for counting people at shelters, tent camps, and other places will also be critical to an accurate count in the region.

We hope these maps serve as a starting point to help local, regional, and state leaders think about which activities, resources, and partnerships—including language assistance, awareness raising, and community outreach—might be most effective for accurately counting different parts of California. Stay tuned for more posts that examine hard-to-count communities in other regions of the state.


Improving Special Education in California

What are the most significant challenges in California’s K–12 school system today? A new report, Getting Down to Facts II, recently released comprehensive findings. PPIC was asked to weigh in on the topic of special education.

We contributed an update to our 2016 report, Special Education Finance in California. This report concluded that state funding for services to students with disabilities is inequitable, inadequate, and lacks transparency. It also fails to provide the same level of local control as other state funding programs. In addition, preschool services to infants and toddlers with disabilities are lacking.

Our new report, Revisiting Finance and Governance Issues in Special Education, expands the analysis of these issues. Overall, we suggest that weaving greater accountability into governance and finance of special education has the potential to improve equity for students with special needs.

Specifically, we find:

  • The state has several good options for revising the special education funding formula so that it better reflects district costs. However, we find that basing funding on the number of disabled students in each district could create negative incentives for districts.
  • Better funding for services to infants and toddlers with disabilities would encourage districts to increase the number of children receiving early services, which would improve behavioral and cognitive skills in some children.
  • Current accountability measures for student success do not acknowledge the unique program factors that can affect district performance data. We find the growth of individual student outcomes is a better measure of progress than the average group scores for all students with disabilities.

We also revisit the role of regional Special Education Local Plan Areas (SELPAs) in special education finance. SELPAs provide support to districts and students in a number of ways, including in the allocation of state and federal funds. We find that district superintendents strongly support their local SELPA, although they provided numerous suggestions for improvement. And we discuss ways that SELPAs could give districts greater autonomy when districts determine that SELPA financial arrangements do not meet local needs.

What Motivates People to Use Less Water?

During a drought, households can be inundated by messages to conserve water. We talked to Katrina Jessoe—an economist at UC Davis and a member of the PPIC Water Policy Center’s research network―about new research on what motivates people to conserve water.

PPIC: Talk about your recent research on water conservation messaging. What did you learn?

Katrina Jessoe: We partnered with a municipally owned water and electric utility to see how people would respond to additional water conservation messaging during summer 2015―at the height of the latest drought. These households were already receiving statewide and utility messages and incentives to conserve water. Our focus was to gauge if social comparisons would lead to additional conservation.

The utilities sent bi-monthly home water reports to a random sample of households. These reports compared a household’s water use to that of neighbors, gave recommendations on how to conserve water, and provided information on particular conservation programs being used by that utility.

We looked at how people responded and found that households that got these reports saved more water than those that didn’t. The reports prompted a reduction in water use of 3 to 4.5%, on top of water savings already prompted by other conservation programs. Interestingly, these water reports led to reduced electricity use as well—participating households used 1.3% to 2.3% less electricity that summer.

Similar home energy reports, which are being deployed throughout the US, are typically cited as leading to 1.3% to 2.5% reduction in energy use. These home water reports reduced electricity use by similar amounts as the energy reports while also reducing water use—even though electricity use wasn’t the target.

We were also able to see that people reduced their electricity use during peak hours—which is when electricity is most expensive and less likely to be produced from clean energy sources like renewables. This has ramifications for greenhouse gas emissions and the cost of providing energy. So this program was providing more bang for the buck than just water conservation.

Why should policy makers care? If you think about this from a cost effectiveness angle, saving water alone may not justify these kinds of interventions. But with the additional electricity savings, it increases the net benefit of these reports by almost two-thirds. We talk a lot about the water-energy nexus, but typically it’s about “embedded” energy savings—if you reduce water use by a gallon, what is the energy savings from treating and moving that water. This research documents the end-use savings in electricity from a water conservation instrument.

PPIC: What other tools show promise for encourage conservation?

KJ: We’ve looked at the City of Modesto, which moved from a flat fee type of billing to charging per unit of water. The utility took a unique approach to rolling out its pricing change. About every six months the utility switches a number of households to the new volumetric pricing system. Households receive a letter informing them when they will be switched to volumetric prices. For two billing periods they also receive a hypothetical bill informing them what their bills would be under the new system, though they continue to pay a flat rate for water.

We find that households reduce water use in response to both the actual price change and the earlier message with the hypothetical price change. The reduction in water use persists for more than two years after the switch to volumetric pricing. While still preliminary, these results highlight that when customers are informed about price changes, they respond to them. This suggests that price may be an effective tool to manage water use, if customers are well informed about the change.

Poverty in California Is High by Any Measure

The Census Bureau recently released updated income and poverty statistics for the years 2015–2017 combined, including information on the Supplemental Poverty Measure (SPM) for states. The SPM updates official poverty statistics, which are released annually, by accounting for the varying cost of housing across states and the impact of key social safety net programs like federal and state Earned Income Tax Credits (EITCs). According to the SPM, California continues to have one of the nation’s highest poverty rates, neck-and-neck with Florida (18.1%) and Louisiana (17.6%). While California’s poverty rate for 2015–2017 was 19%, the national poverty rate was much lower, at 14.1%.

The California Poverty Measure (CPM), a collaborative effort by PPIC and the Stanford Center on Poverty and Inequality, provides additional detail needed to understand our large, complex state. It takes into account both the varying cost of living and the poverty-mitigating role of social safety net programs like the EITC and CalFresh within different regions of California. PPIC published CPM estimates in July indicating that 19.4% of Californians lived in poverty in 2016. Poverty rates are highest in certain coastal areas, including Los Angeles County, where the mix of the high cost of housing, employment opportunities for low-skilled workers, and access to large-scale social safety net programs create particularly challenging circumstances.

Blog figure: Poverty tends to be higher in coastal counties and regions

Despite the important role of social safety net programs, employment is a key factor in determining poverty status. Adults working full time and for the whole year have a poverty rate of just 8.3%, while nearly a quarter (23.5%) of those working less are in poverty. At the same time, employment does not eliminate poverty: 44.6% of working adults in poverty are actually working full time, year round.

Blog figure: Close to half of working poor adults in California are working full time, year round

What can policymakers do to improve the situation in California? The good news is that there are diverse opportunities to address poverty. Moderating housing costs, supporting proven employment and training programs, and vigorously supporting social safety net programs all offer opportunities to improve the well-being of disadvantaged Californians.

Could Wildfires Affect the 2020 Census?

The decennial census plays an essential role in American democracy. The stakes are huge for California, and 2020 is fast approaching. This series of blog posts takes a detailed look at California communities that may be at risk of being undercounted.

Wildfires in California have burned millions of acres and destroyed or threatened thousands of homes, displacing families around the state. Among their many devastating long-term effects, disasters may elevate the risk of undercounting some communities in the upcoming census.

The Census Bureau’s goal is to “count everyone, only once, and in the right place.” In practice, this means that people are counted where they reside as of “Census Day” (April 1, 2020), even if this is not their permanent residence. Given that Californians who lose their homes in disasters must then find housing in a notoriously difficult market, housing conditions alone could pose a hurdle to accurately counting communities that have been displaced by wildfires.

Hurricane Katrina presented similar issues for the 2010 Census. While some people displaced from the Gulf Coast moved away permanently, many others were counted in counties or states they intended to leave once their homes were again habitable. Still others stayed in accommodations closer to home, which—depending on resources—were sometimes shared, non-standard, or even not yet considered habitable. These families proved difficult to reach by mail, with just 45% of New Orleans households returning forms at first (compared with 61% in 2000). On-the-ground staff were ultimately responsible for hand-delivering questionnaires to the majority of New Orleans homes. Even though the Census Bureau can request a funding contingency for such costly efforts, it will have many competing demands for resources in 2020.

In the aftermath of California’s recent fires, local areas face unique challenges to getting an accurate census count—particularly in terms of housing. Here we look at three of those areas across the state. Current estimates show that 20,000 residents were affected by the Carr fire (Redding, 2018) and that the Thomas fire (Ventura County, 2017) and the Tubbs fire (Santa Rosa, 2017) each affected about 40,000 residents. Before the fires, none of these areas stood out in terms of having large populations of hard-to-count residents, but the loss of housing could create new obstacles.

Even in normal times, housing plays a key role in getting an accurate census count. Rental units and mobile homes are less likely to appear on official census address lists. Moreover, their residents tend to move more often, making them hard to reach. Wildfire displacement heightens these challenges, especially in places where housing was already hard to count. For example, mobile homes made up 6% of housing in the Thomas fire area—double the statewide average. In the Carr fire area, they constituted 10%.

Before the fires, the share of renters in all three fire areas was lower than the statewide share, but the loss of homes likely changed this picture. CalFire reports that the Thomas fire destroyed 775 homes—and subsequent mudslides in the area demolished at least another 100. The Carr fire destroyed 1,079 homes, and the Tubbs fire razed 3,000. Displaced residents are more likely to rent, reside in non-standard arrangements, and/or struggle with poverty, creating new challenges for the census count.

Blog figure: Housing conditions in fire zones varied widely

In 2020, given the likelihood that families will continue to be displaced by wildfires or other natural disasters, it will be important for state and local leaders to coordinate with the Census Bureau to ensure that all Californians are counted accurately—regardless of their housing situation. For more on areas with hard-to-count housing and other challenges, visit PPIC’s interactive census maps.

Career Technical Education: Funding & New State Oversight

President Donald Trump recently signed the Strengthening Career and Technical Education for the 21st Century Act, or Perkins V, which reauthorized $1.2 billion dollars in federal funds for career and technical educational (CTE) programs. The new law gives states more flexibility to set their own goals for CTE programs, along with reporting progress toward those goals. Who might benefit from these changes, and what new challenges do they present to the state?

Perkins V supports programs that integrate career skills and prepare students at the secondary, postsecondary, and adult education level for the workforce—for such careers as IT technician, accountant, or nurse. Funding is based on student enrollment, and each year California receives more than $110 million in Perkins dollars, the vast majority (85%) of which go to CTE programs in high schools and community colleges. During the 2017–18 school year, close to 780,000 (40%) high school students and 420,000 (35%) full-time community college students participated in CTE.

California’s CTE students generally reflect the demographics of the overall student population, though Asian American, Latino, and female students are slightly underrepresented. Over time, the overall number of students participating in CTE has decreased, but the percentage of low-income students who do so has increased. Today, low-income students account for more than half of CTE participants. Benefits associated with CTE programs include decreased high school dropout rates (for low-income students in particular), increased high school graduation rates, and higher wage returns (particularly in health fields).

Figure: Low-income students account for more than half of CTE participants in California

Although the new law provides states with greater flexibility, some of the provisions may present a challenge for those hoping to measure the impact of Perkins dollars in California. For example, under the new requirements performance indicators follow only students deemed to be “concentrators,” or those who complete a substantial number of courses in a single CTE program of study. Currently, concentrators account for less than half of CTE participants, so the indicators may not capture the outcomes of all who are served by Perkins funding. In addition, some of the core indicators—such as student placement in postsecondary CTE education—require the use of a comprehensive longitudinal database on student outcomes, a tool that California does not yet have. Furthermore, performance indicators are not broken down by industry sector, which makes it difficult to evaluate state-specific sectors, such as fashion and interior design or energy and utilities, which are unique to California’s economy.

Going forward, the Perkins reauthorization ushers in a new form of CTE program accountability at the state level. If California wants to continue to close the gap of 1.5 million workers with “some” college education, it needs to make inroads on designing, improving, and scaling up effective CTE programs—and on improving the quality of data on CTE programs and students.

Hurricanes Are Getting Worse. California Should Take Note

As Hurricane Florence ground its way through the Carolinas this past weekend, climate watchers couldn’t help but notice that the size and behavior of the storm have been eerily reminiscent of Hurricane Harvey, which devastated Houston last year. What made these two hurricanes so destructive was their slow pace and the fact that they were supercharged with moisture from bathtub-warm oceans. It’s a deadly combination that leads to epic, record-setting amounts of rainfall and unprecedented flooding, amplifying damage from the high winds and storm surge typically associated with hurricanes.

Once Florence leaves the Carolinas and the floods have receded, the nation will rally to clean up what will likely be of one of its top five most destructive hurricanes. Florence will add to this century’s staggering storm damage, caused by 22 hurricanes or tropical storms that led to more than $700 billion in damages in the United States (adjusted for inflation).

Is this part of a trend? Most certainly. The National Oceanic and Atmospheric Administration has a detailed analysis of billion-dollar US weather disasters since 1980. Clearly, weather impacts are getting much more expensive—and much more frequent.

What does this mean for California? First, like all other states in the nation, California relies upon the federal government to help with disaster preparedness, response, and recovery. The increase in the number of natural disasters and their growing costs affect the ability of federal agencies to respond. And the most important tool in mitigating flood risk—flood insurance—relies on an insolvent National Flood Insurance Program that will surely be hit hard by Florence.

Second, while it is tempting for Californians to write off Florence as a weather problem that affects the Gulf Coast and Atlantic states, this would be a mistake. We have our own hurricane-equivalents here, called atmospheric rivers. These can produce rainfall rates similar to those found in hurricanes, and they are responsible for most of our floods.

California is no stranger to extreme floods that rival hurricanes in terms of damages. The Great Flood of 1861‒62 affected the entire state and turned the Central Valley into a lake. If that same flood were to happen today, studies by the US Geological Survey suggest that more than $700 billion in damages would occur (equal to all the damages from all hurricanes nationwide in the past 18 years) and more than 1.5 million Californians would be displaced. Research by Daniel Swain, a climate scientist at UCLA, suggests that the risk of this scale of flooding is increasing as global warming intensifies. Indeed, his work has shown that the probability of a flood similar to the 1861‒62 flood occurring in California by mid-century is greater­ than the probability that it won’t.

Florence is a sobering hurricane that will likely be one of the worst in history. California would do well to heed some of its key lessons. As discussed in our recent report and highlighted by California’s Fourth Climate Assessment, flood risk is increasing due to climate warming. The 2017 crisis at Oroville Dam is an expensive reminder that California needs to upgrade its aging water management infrastructure. This will require finding new and innovative ways to fund flood management improvements.

California should also expand its efforts to steer new development away from high flood-risk areas through better land-use planning that incorporates increasing risk.

No matter how well California prepares, there will always be floods that overwhelm defenses, damage homes and businesses, and threaten lives. The state needs to continue to improve emergency preparations for floods and to encourage those who live in areas at risk of flooding to purchase insurance.

California has been a leader in reducing its contribution of greenhouse gases. But more work is needed to ensure its water supply and flood management systems are able to withstand a more volatile climate. California must act now to weather floods of the future.

Video: Managing Drought in a Changing Climate

As San Francisco began welcoming visitors arriving for this week’s Global Action Climate Summit, the PPIC Water Policy Center hosted an event on the impact of climate change on California’s water system.

The Monday event brought together a panel of experts to discuss reforms that could improve resilience and galvanize action to prepare for future droughts. The panelists were Maria Herrera, who works on water issues for Self-Help Enterprises and is a member of the California Water Commission; Felicia Marcus, chair of the State Water Board; Cannon Michael, president of Bowles Farming Company; and Tim Ramirez, a member of the Central Valley Flood Protection Board. The panel was moderated by Greg Dalton, founder and host of Climate One.

Ellen Hanak, director of the center, kicked off the evening with a summary of new research by PPIC on managing drought in a changing climate. After noting that California is already seeing changes from a warming climate, she said that “a lot of things we’re recommending are going to be very important and very useful as soon as we can do them.” She reviewed the report’s four main suggested areas of reform: plan ahead, modernize the water grid, update water allocation rules, and find the money to pay for these reforms. “It’s a plan that would be great for the next governor,” she said.

Dalton launched the panel discussion with a question about the need to modernize the state’s water grid—the network of above- and below-ground storage and conveyance systems that connects most water uses in the state. Ramirez said that the conveyance system needs updating because it is “totally insufficient for the precipitation we have now.” For example, the San Joaquin River system “was plumbed for snowmelt―very predictable, slow runoff―but that’s not what happens anymore.” He discussed the need for expanded floodplain capacity to help absorb floods.

Marcus said, “The answer is to maximize every drop—figuring out how every molecule of water … can be used over and over again and used for multiple things.” She said improved information and modernizing our thinking about infrastructure are steps toward achieving this goal.

Herrera noted that disadvantaged rural communities, which are most likely to face drought-related water shortages, find it difficult to engage in discussions about the water system. She called for ensuring that local communities are included in decision making about water grid upgrades, and added that they should have a say in “where to place storage, how water that is stored gets used and allocated, and for what benefits.”

Other topics of discussion included addressing growing wildfire risk; ensuring safe, reliable drinking water for the most vulnerable communities; advice for the next governor on managing climate volatility (Marcus: “the key is to pick up the baton and run with it.… [Water] is an issue on which leadership can make a difference on so many things”), and ways to reduce conflict over water.

Cannon Michael seconded the need for leadership to tackle climate change—and urged all Californians to heed that call. “We need to think about the California we have, what an amazing state this is, and lead from that. We’ve got to push past the voices that are trying to drag us apart, and work on solutions from the middle. We can solve any problem that we all put our minds together on.”

Steven Merksamer Named Chair of PPIC Board

I am very pleased to share the news that PPIC’s board of directors elected attorney Steven Merksamer, a leading expert in government and administrative law and the initiative and referendum process, chair at our annual meeting yesterday. Steve’s distinguished record of public service and deep knowledge of the forces shaping our state make him an ideal leader for PPIC at this important time. He will take over from acclaimed author and farmer Mas Masumoto, who will remain on the board. On behalf of the board and staff, I want to thank Mas for his extraordinary leadership.

Photo of Steven MerksamerSteve joined PPIC’s board of directors in 2009. He is the senior partner in the Northern California law firm of Nielsen, Merksamer, Parrinello, Gross & Leoni, LLP. He served as the chief of staff to Governor George Deukmejian, a position he held from 1982 to 1987. Before that, he was the special assistant attorney general of the State of California, serving as the attorney general’s senior counselor and policy advisor. He has also served as a California deputy attorney general, assistant to the lieutenant governor of California, and assistant to the Speaker of the California State Assembly.

Notably, Steve chaired and directed the transition between the Brown and Deukmejian administrations. He will be an important advisor to me and my colleagues as we seek to provide essential facts and analysis to California’s decision makers during a significant gubernatorial transition.

Steve is currently a member of the board of directors of the California Chamber of Commerce and a trustee of the Stevenson School.  He is an honors graduate of Claremont McKenna College, and received his law degree from the University of the Pacific, McGeorge School of Law.

The other members of the board are myself; Ruben Barrales, president and CEO of GROW Elect; María Blanco, executive director of the Immigrant Legal Services Center at the University of California; Louise Henry Bryson, chair emerita of the Board of Trustees of the J. Paul Getty Trust; A. Marisa Chun, partner at McDermott Will & Emery LLP; Chet Hewitt, president & CEO of the Sierra Health Foundation; Phil Isenberg, former chair of the Delta Stewardship Council; Donna Lucas, chief executive officer of Lucas Public Affairs; Mas Masumoto, author and farmer; Leon E. Panetta, chairman of the Panetta Institute for Public Policy; Gerald L. Parsky, chairman of the Aurora Capital Group; Kim Polese, chair of ClearStreet, Inc.; and Gaddi H. Vasquez, senior vice president of government affairs for Edison International and Southern California Edison.