Video: Understanding Poverty in California

[vc_row][vc_column][vc_column_text]

Despite a booming economy, millions of Californians live in or near poverty. In this video, PPIC research associate Tess Thorman gives an overview of poverty and child poverty in the state, using the latest figures from the California Poverty Measure (CPM).

The CPM is a joint research effort by PPIC and the Stanford Center on Poverty and Inequality that provides a comprehensive look at economic well-being in our state. By accounting for cost of living differences across the state as well as earnings and other family resources—including safety net benefits—the CPM offers valuable insights into the ability of Californians to meet basic needs and be financially secure.[/vc_column_text][/vc_column][/vc_row][vc_row visibility=”hidden-phone”][vc_column][vc_video link=”https://youtu.be/tPh4xE7QLGo” el_width=”70″ align=”center”][/vc_column][/vc_row][vc_row visibility=”visible-phone”][vc_column][vc_video link=”https://youtu.be/tPh4xE7QLGo”][/vc_column][/vc_row][vc_row][vc_column][vc_column_text]To learn more about poverty in California, visit ppic.org/poverty.[/vc_column_text][/vc_column][/vc_row]

Interactive: A Look at Child Poverty across California

[vc_row][vc_column][vc_column_text]Governor Newsom’s first budget proposal included notable efforts to address poverty—especially child poverty—by increasing CalWORKs cash assistance grants, expanding assistance to low-income parents pursuing higher education, and further expanding the state’s Earned Income Tax Credit (CalEITC, which he proposed renaming the Working Families Tax Credit).

California has a troublingly high child poverty rate of 21.3%, or about 1.9 million children, according to our latest estimates from the California Poverty Measure (CPM). The CPM is a joint research effort between PPIC and the Stanford Center on Poverty and Inequality that, unlike official poverty metrics, takes into account the cost of living and benefits from social safety net programs.

While poverty rates in the state are also high, child poverty rates tend to be even higher, particularly in the most populous counties. For example, in Los Angeles County, 24.3% of all residents—but 27.8% of children—live in poverty. Altogether, 17 counties, 29 congressional districts, 21 senate districts, and 42 assembly districts have child poverty rates of more than about 20%.

State and federal policies play an important role in lowering child poverty. Our estimates indicate that over a third (35.3%) of children would be in poverty, were it not for programs like CalFresh food assistance, the federal and state Earned Income Tax Credits, and CalWORKs cash assistance. PPIC research also shows that new policies could reduce child poverty even further, although effects vary across the state. We will continue to track and analyze poverty and child poverty to provide this critical information to policymakers and stakeholders.[/vc_column_text][/vc_column][/vc_row][vc_row][vc_column][vc_raw_html]JTNDZGl2JTIwY2xhc3MlM0QlMjd0YWJsZWF1UGxhY2Vob2xkZXIlMjclMjBpZCUzRCUyN3ZpejE1NDc4MjcxODU1NTglMjclMjBzdHlsZSUzRCUyN3Bvc2l0aW9uJTNBJTIwcmVsYXRpdmUlMjclM0UlM0Nub3NjcmlwdCUzRSUzQ2ElMjBocmVmJTNEJTI3JTIzJTI3JTNFJTNDaW1nJTIwYWx0JTNEJTI3JTIwJTI3JTIwc3JjJTNEJTI3aHR0cHMlM0ElMjYlMjM0NyUzQiUyNiUyMzQ3JTNCcHVibGljLnRhYmxlYXUuY29tJTI2JTIzNDclM0JzdGF0aWMlMjYlMjM0NyUzQmltYWdlcyUyNiUyMzQ3JTNCQ2glMjYlMjM0NyUzQkNoaWxkUG92ZXJ0eWJ5Q2FsaWZvcm5pYUNvdW50eWFuZExlZ2lzbGF0aXZlRGlzdHJpY3RfMCUyNiUyMzQ3JTNCQ291bnRpZXMlMjYlMjM0NyUzQjFfcnNzLnBuZyUyNyUyMHN0eWxlJTNEJTI3Ym9yZGVyJTNBJTIwbm9uZSUyNyUyMCUyRiUzRSUzQyUyRmElM0UlM0MlMkZub3NjcmlwdCUzRSUzQ29iamVjdCUyMGNsYXNzJTNEJTI3dGFibGVhdVZpeiUyNyUyMCUyMHN0eWxlJTNEJTI3ZGlzcGxheSUzQW5vbmUlM0IlMjclM0UlM0NwYXJhbSUyMG5hbWUlM0QlMjdob3N0X3VybCUyNyUyMHZhbHVlJTNEJTI3aHR0cHMlMjUzQSUyNTJGJTI1MkZwdWJsaWMudGFibGVhdS5jb20lMjUyRiUyNyUyMCUyRiUzRSUyMCUzQ3BhcmFtJTIwbmFtZSUzRCUyN2VtYmVkX2NvZGVfdmVyc2lvbiUyNyUyMHZhbHVlJTNEJTI3MyUyNyUyMCUyRiUzRSUyMCUzQ3BhcmFtJTIwbmFtZSUzRCUyN3NpdGVfcm9vdCUyNyUyMHZhbHVlJTNEJTI3JTI3JTIwJTJGJTNFJTNDcGFyYW0lMjBuYW1lJTNEJTI3bmFtZSUyNyUyMHZhbHVlJTNEJTI3Q2hpbGRQb3ZlcnR5YnlDYWxpZm9ybmlhQ291bnR5YW5kTGVnaXNsYXRpdmVEaXN0cmljdF8wJTI2JTIzNDclM0JDb3VudGllcyUyNyUyMCUyRiUzRSUzQ3BhcmFtJTIwbmFtZSUzRCUyN3RhYnMlMjclMjB2YWx1ZSUzRCUyN3llcyUyNyUyMCUyRiUzRSUzQ3BhcmFtJTIwbmFtZSUzRCUyN3Rvb2xiYXIlMjclMjB2YWx1ZSUzRCUyN25vJTI3JTIwJTJGJTNFJTNDcGFyYW0lMjBuYW1lJTNEJTI3c3RhdGljX2ltYWdlJTI3JTIwdmFsdWUlM0QlMjdodHRwcyUzQSUyNiUyMzQ3JTNCJTI2JTIzNDclM0JwdWJsaWMudGFibGVhdS5jb20lMjYlMjM0NyUzQnN0YXRpYyUyNiUyMzQ3JTNCaW1hZ2VzJTI2JTIzNDclM0JDaCUyNiUyMzQ3JTNCQ2hpbGRQb3ZlcnR5YnlDYWxpZm9ybmlhQ291bnR5YW5kTGVnaXNsYXRpdmVEaXN0cmljdF8wJTI2JTIzNDclM0JDb3VudGllcyUyNiUyMzQ3JTNCMS5wbmclMjclMjAlMkYlM0UlMjAlM0NwYXJhbSUyMG5hbWUlM0QlMjdhbmltYXRlX3RyYW5zaXRpb24lMjclMjB2YWx1ZSUzRCUyN3llcyUyNyUyMCUyRiUzRSUzQ3BhcmFtJTIwbmFtZSUzRCUyN2Rpc3BsYXlfc3RhdGljX2ltYWdlJTI3JTIwdmFsdWUlM0QlMjd5ZXMlMjclMjAlMkYlM0UlM0NwYXJhbSUyMG5hbWUlM0QlMjdkaXNwbGF5X3NwaW5uZXIlMjclMjB2YWx1ZSUzRCUyN3llcyUyNyUyMCUyRiUzRSUzQ3BhcmFtJTIwbmFtZSUzRCUyN2Rpc3BsYXlfb3ZlcmxheSUyNyUyMHZhbHVlJTNEJTI3eWVzJTI3JTIwJTJGJTNFJTNDcGFyYW0lMjBuYW1lJTNEJTI3ZGlzcGxheV9jb3VudCUyNyUyMHZhbHVlJTNEJTI3eWVzJTI3JTIwJTJGJTNFJTNDJTJGb2JqZWN0JTNFJTNDJTJGZGl2JTNFJTIwJTIwJTIwJTIwJTIwJTIwJTIwJTIwJTIwJTIwJTIwJTIwJTIwJTIwJTIwJTIwJTNDc2NyaXB0JTIwdHlwZSUzRCUyN3RleHQlMkZqYXZhc2NyaXB0JTI3JTNFJTIwJTIwJTIwJTIwJTIwJTIwJTIwJTIwJTIwJTIwJTIwJTIwJTIwJTIwJTIwJTIwJTIwJTIwJTIwJTIwdmFyJTIwZGl2RWxlbWVudCUyMCUzRCUyMGRvY3VtZW50LmdldEVsZW1lbnRCeUlkJTI4JTI3dml6MTU0NzgyNzE4NTU1OCUyNyUyOSUzQiUyMCUyMCUyMCUyMCUyMCUyMCUyMCUyMCUyMCUyMCUyMCUyMCUyMCUyMCUyMCUyMCUyMCUyMCUyMCUyMHZhciUyMHZpekVsZW1lbnQlMjAlM0QlMjBkaXZFbGVtZW50LmdldEVsZW1lbnRzQnlUYWdOYW1lJTI4JTI3b2JqZWN0JTI3JTI5JTVCMCU1RCUzQiUyMCUyMCUyMCUyMCUyMCUyMCUyMCUyMCUyMCUyMCUyMCUyMCUyMCUyMCUyMCUyMCUyMCUyMCUyMCUyMGlmJTIwJTI4JTIwZGl2RWxlbWVudC5vZmZzZXRXaWR0aCUyMCUzRSUyMDgwMCUyMCUyOSUyMCU3QiUyMHZpekVsZW1lbnQuc3R5bGUud2lkdGglM0QlMjcxMDAlMjUlMjclM0J2aXpFbGVtZW50LnN0eWxlLmhlaWdodCUzRCUyOGRpdkVsZW1lbnQub2Zmc2V0V2lkdGglMkEwLjc1JTI5JTJCJTI3cHglMjclM0IlN0QlMjBlbHNlJTIwaWYlMjAlMjglMjBkaXZFbGVtZW50Lm9mZnNldFdpZHRoJTIwJTNFJTIwNTAwJTIwJTI5JTIwJTdCJTIwdml6RWxlbWVudC5zdHlsZS53aWR0aCUzRCUyNzEwMCUyNSUyNyUzQnZpekVsZW1lbnQuc3R5bGUuaGVpZ2h0JTNEJTI4ZGl2RWxlbWVudC5vZmZzZXRXaWR0aCUyQTEuNzclMjklMkIlMjdweCUyNyUzQiU3RCUyMGVsc2UlMjAlN0IlMjB2aXpFbGVtZW50LnN0eWxlLndpZHRoJTNEJTI3MTAwJTI1JTI3JTNCdml6RWxlbWVudC5zdHlsZS5taW5IZWlnaHQlM0QlMjc3NTBweCUyNyUzQnZpekVsZW1lbnQuc3R5bGUubWF4SGVpZ2h0JTNEJTI4ZGl2RWxlbWVudC5vZmZzZXRXaWR0aCUyQTEuNzclMjklMkIlMjdweCUyNyUzQiU3RCUyMCUyMCUyMCUyMCUyMCUyMCUyMCUyMCUyMCUyMCUyMCUyMCUyMCUyMCUyMCUyMCUyMCUyMCUyMCUyMCUyMHZhciUyMHNjcmlwdEVsZW1lbnQlMjAlM0QlMjBkb2N1bWVudC5jcmVhdGVFbGVtZW50JTI4JTI3c2NyaXB0JTI3JTI5JTNCJTIwJTIwJTIwJTIwJTIwJTIwJTIwJTIwJTIwJTIwJTIwJTIwJTIwJTIwJTIwJTIwJTIwJTIwJTIwJTIwc2NyaXB0RWxlbWVudC5zcmMlMjAlM0QlMjAlMjdodHRwcyUzQSUyRiUyRnB1YmxpYy50YWJsZWF1LmNvbSUyRmphdmFzY3JpcHRzJTJGYXBpJTJGdml6X3YxLmpzJTI3JTNCJTIwJTIwJTIwJTIwJTIwJTIwJTIwJTIwJTIwJTIwJTIwJTIwJTIwJTIwJTIwJTIwJTIwJTIwJTIwJTIwdml6RWxlbWVudC5wYXJlbnROb2RlLmluc2VydEJlZm9yZSUyOHNjcmlwdEVsZW1lbnQlMkMlMjB2aXpFbGVtZW50JTI5JTNCJTIwJTIwJTIwJTIwJTIwJTIwJTIwJTIwJTIwJTIwJTIwJTIwJTIwJTIwJTIwJTIwJTNDJTJGc2NyaXB0JTNF[/vc_raw_html][/vc_column][/vc_row]

1 in 4 Child Care Workers in California Lives in Poverty

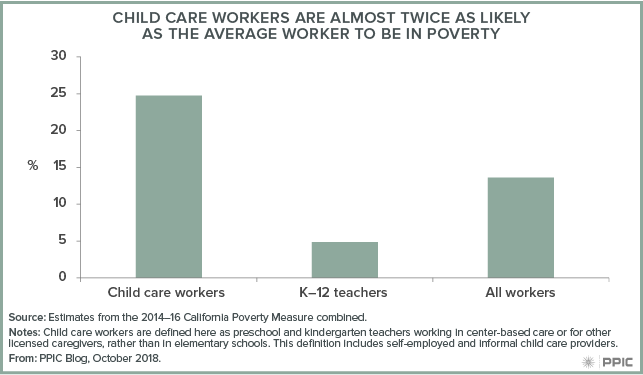
While preschools and child care providers in many parts of California are straining to fill a unmet need, the state’s child care workers are poorly paid and almost twice as likely to live in poverty than workers overall.

California’s child care workers earn significantly less than their school-based counterparts. Given that about 95% of child care workers not based in schools are women, and 53% are African American or Latina (compared with 43% of the overall workforce), women—particularly women of color—are most affected by low pay in the child care workforce.

UC Berkeley found that in 2017, the median hourly wage for child care workers in California was $12.29—just one-third the median wage for kindergarten teachers. Earnings among child care workers track more with low-wage workers across California (defined as those earning less than two-thirds of the median wage). These low wages translate to about a quarter of child care workers living in poverty as compared to 14% of all working adults (ages 18-64)—according to the California Poverty Measure, developed by PPIC and the Stanford Center on Poverty and Inequality.

Low wages are just one piece of the poverty puzzle. Relative to all working adults, child care workers are more likely to have only part-time work (more than a third, compared with less than a quarter of the overall workforce), which is associated with dramatically higher poverty rates than full-time employment. Many have completed some college credit or have an associate’s degree (44%), but just a fifth have a four-year degree, in a workforce where more than a third of working adults have four-year degrees. And while people working in child care are as likely to have children as the average working adult, those who do are more likely to be parenting alone (11%) than the average worker (6%).

The social safety net is an important part of helping child care workers make ends meet. Half of all child care workers benefit from at least one safety net program or tax credit, with the two largest being CalFresh (25%) and the federal Earned Income Tax Credit (37%). Without this assistance, poverty among child care workers would be even higher—2.5 points higher without the Earned Income Tax Credit, and 2.1 points without CalFresh. Minus all major safety net programs, one in three child care workers would live in poverty.

Recent policy changes could start to boost incomes for child care workers. Expanded eligibility for 18–24-year-olds for the state’s new Earned Income Tax Credit, starting in 2019, will specifically help the 20% of the workforce who are under 25. Steady increases in California’s minimum wage could improve earnings of child care workers employed by providers subject to minimum wage laws. Yet many workers are self-employed, providers often operate with limited incomes, and the cost of care itself is already high for low-income families. Minimum wage increases will likely result in a better-paid child care workforce only if they are accompanied by sector-wide changes aimed at making child care both affordable and accessible.

The needs of child care workers will affect efforts to improve and expand California’s complex child care system. While the state and federal governments have begun to increase access to child care with expanded programs and additional funding, improving living standards for child care workers will be a major challenge for California’s next governor.

Poverty in California Is High by Any Measure

The Census Bureau recently released updated income and poverty statistics for the years 2015–2017 combined, including information on the Supplemental Poverty Measure (SPM) for states. The SPM updates official poverty statistics, which are released annually, by accounting for the varying cost of housing across states and the impact of key social safety net programs like federal and state Earned Income Tax Credits (EITCs). According to the SPM, California continues to have one of the nation’s highest poverty rates, neck-and-neck with Florida (18.1%) and Louisiana (17.6%). While California’s poverty rate for 2015–2017 was 19%, the national poverty rate was much lower, at 14.1%.

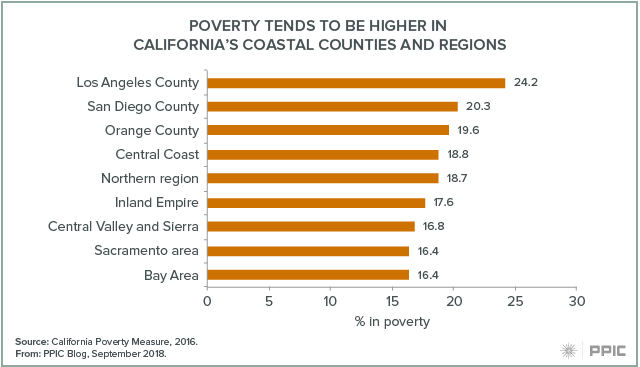
The California Poverty Measure (CPM), a collaborative effort by PPIC and the Stanford Center on Poverty and Inequality, provides additional detail needed to understand our large, complex state. It takes into account both the varying cost of living and the poverty-mitigating role of social safety net programs like the EITC and CalFresh within different regions of California. PPIC published CPM estimates in July indicating that 19.4% of Californians lived in poverty in 2016. Poverty rates are highest in certain coastal areas, including Los Angeles County, where the mix of the high cost of housing, employment opportunities for low-skilled workers, and access to large-scale social safety net programs create particularly challenging circumstances.

Blog figure: Poverty tends to be higher in coastal counties and regions

Despite the important role of social safety net programs, employment is a key factor in determining poverty status. Adults working full time and for the whole year have a poverty rate of just 8.3%, while nearly a quarter (23.5%) of those working less are in poverty. At the same time, employment does not eliminate poverty: 44.6% of working adults in poverty are actually working full time, year round.

Blog figure: Close to half of working poor adults in California are working full time, year round

What can policymakers do to improve the situation in California? The good news is that there are diverse opportunities to address poverty. Moderating housing costs, supporting proven employment and training programs, and vigorously supporting social safety net programs all offer opportunities to improve the well-being of disadvantaged Californians.

Geographic Variation in Poverty across California

Each year, when we update the data on poverty in California, we remark on how widely poverty rates vary across counties. In Los Angeles County, 24.3% of residents are poor, compared with just 11.8% of those in El Dorado County, according to the California Poverty Measure (CPM). The CPM is a collaboration between PPIC and the Stanford Center on Poverty and Inequality that adjusts for regional housing costs and incorporates resources from major social safety net programs.

Our new interactive maps highlight the dramatic variation in poverty across counties and US congressional, state senate, and state assembly districts. Overall, the maps show high rates of poverty in coastal and southern California, and lower rates in the northern and Sierra regions. This pattern is driven by a variety of factors: poor families in coastal, urban regions can earn relatively higher incomes, but this is often outweighed by high costs of living and reduced eligibility for safety net programs. In contrast, high poverty rates inland and along the north coast are driven by low incomes and limited employment—despite substantial poverty reduction by the social safety net.

These maps allow leaders from counties—where social safety net programs are often implemented—and legislative bodies—where program funding is allocated—to learn more about poverty and the impact of the safety net in their region.
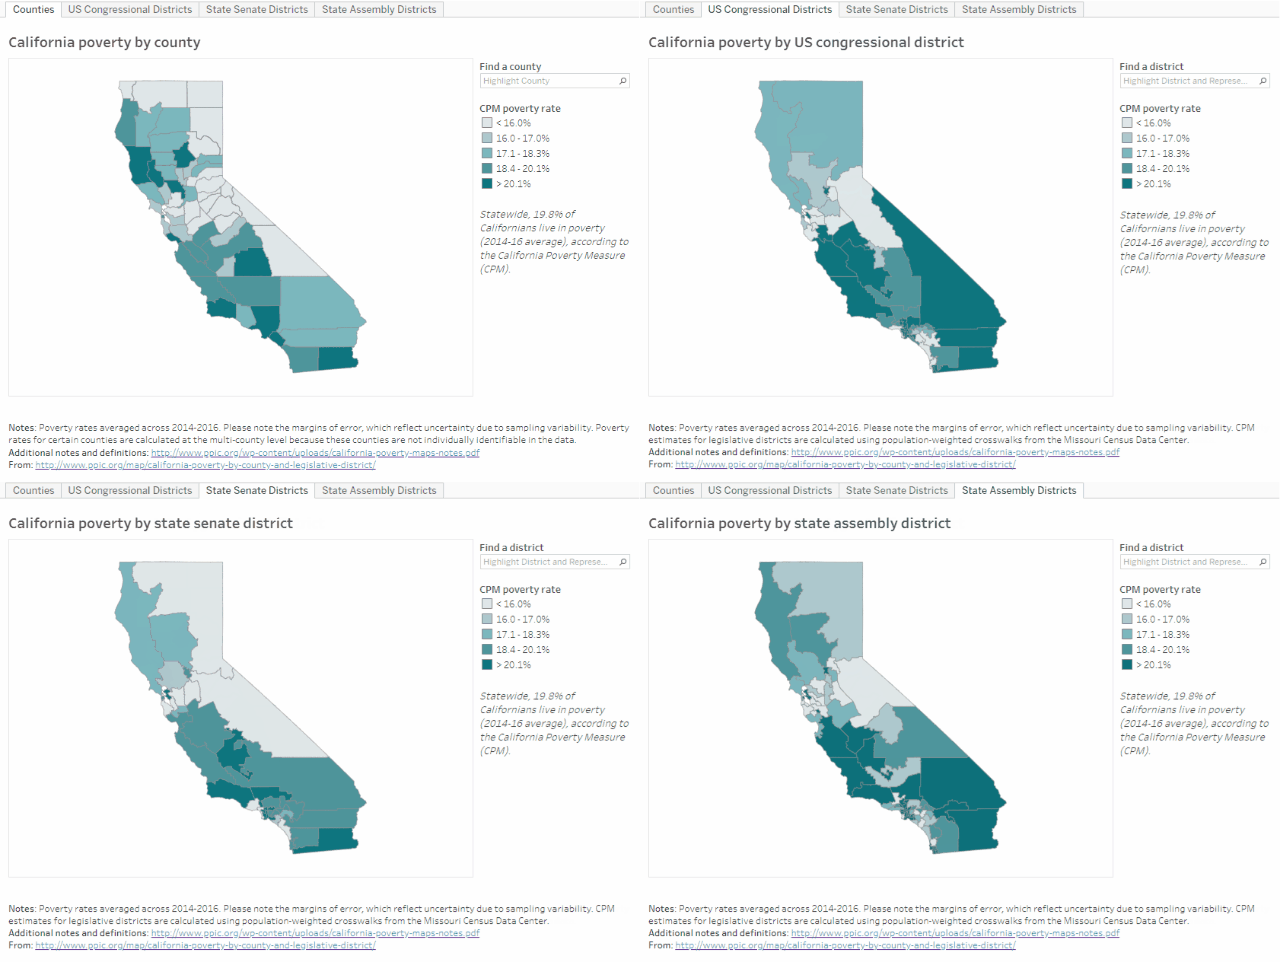
Legislative districts see even greater disparities in poverty than counties do. Across assembly districts, for example, poverty rates differ by more than 30 percentage points, ranging from 7.8% in Assembly District 16 (Baker, R) in eastern Contra Costa County to 40.7% in Assembly District 59 (Jones-Sawyer, D) in central Los Angeles. This range reflects differences in the number of counties and assembly districts, as well as the size of their populations. California has 80 assembly districts with roughly equal populations, so they represent more slices of the state—especially in urban, densely populated counties.

Comparing counties and legislative districts draws attention to the ways that boundaries can bring forth or obscure populations. In the Inland Empire (San Bernardino and Riverside) in southeastern California, county and state senate district lines show poverty rates below the state average of 19.8% from 2014–16, ranging from 18.2% to 18.9%. But state assembly and US congressional districts in that area have high poverty rates, ranging from 20.5% to 22.7%—and are adjacent to districts with much less poverty.

The maps provide a rich resource for learning about the geographic variation of poverty in California. Since the factors driving poverty vary across the state, effective approaches for reducing poverty may vary too, as our previous research on child poverty has shown. For additional detail, the maps allow users to download estimates on the impact of major social safety net programs on poverty in different regions.


Nearly Half of the Working Poor Are Working Full Time and Year Round

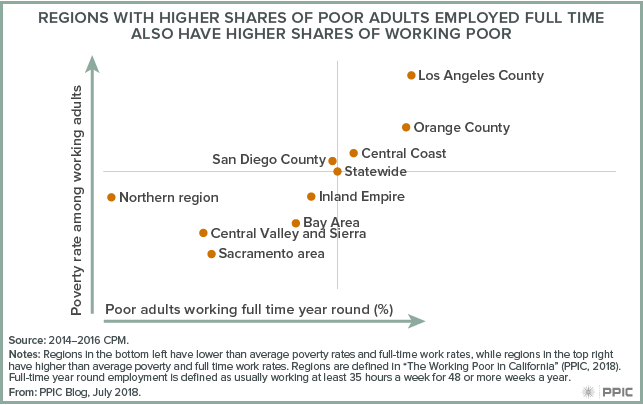
Roughly 2 million out of 16 million working Californians (ages 25‒64) live in poverty, according to California Poverty Measure (CPM) estimates—and nearly half (45%) of these workers are employed full time and year round.

We see a positive association between poverty rates and rates of full-time, year-round employment across regions. In other words, in areas of the state with higher shares of poor adults working full time—including Los Angeles and Orange Counties—the rates of poverty among working adults are also higher.

In those regions, working poverty is clearly not mainly attributable to working insufficient hours. It is driven by wage rates and other factors—measured in the CPM—like the cost of living, necessary expenses, and access to safety net resources (or lack thereof). For many of the working poor, the most promising strategies for improving wages require access to high-quality education and training.

The Federal Farm Bill Could Affect CalFresh

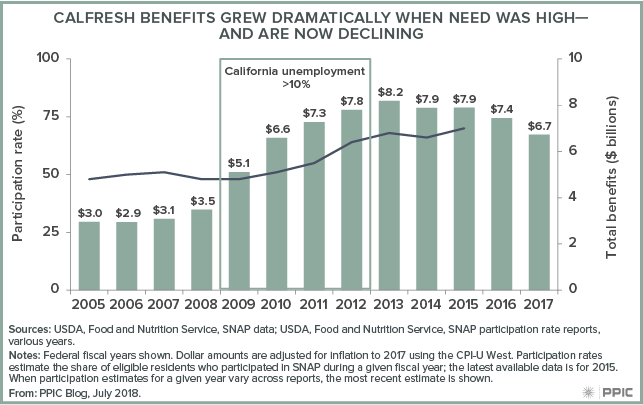
The federal Farm Bill is due for reauthorization in Congress, but its fate is still uncertain—Senate and House versions differ substantially. The largest share of spending in—and the most contentious aspect of—the bill is the Supplemental Nutrition Assistance Program (SNAP), known as CalFresh in California. CalFresh is the state’s main food assistance program, helping nearly 4 million Californians afford groceries each month. The Senate bill leaves net SNAP funding largely unchanged. The House bill would trim costs significantly, in part by revamping work requirements and limiting state flexibility in setting eligibility guidelines. These changes, which would reduce the number of program recipients, are being proposed at a time when the SNAP caseload is declining nationwide, after growing substantially during and after the Great Recession.

In California, policymakers have focused in recent years on getting more eligible Californians enrolled in CalFresh—the state had the lowest participation rate in the nation for a number of years. The share of those eligible who received benefits grew from about 50% to 70% between 2009 and 2015 (the most recent estimate)—but this improved participation rate is still near the bottom. Nonetheless, the California Poverty Measure estimates that CalFresh benefits kept more than 800,000 residents out of poverty in 2015.

Even as participation rates have been rising, decreases in demand are causing CalFresh benefit costs to fall—from $7.4 billion to $6.7 between 2016 and 2017 alone. Whether or not federal policies change, program costs are likely to continue to fall in the next year—unless the state enters a recession and the need for food assistance rises.

Examining the Federal EITC’s Impact on Poverty

The federal Earned Income Tax Credit (EITC) plays an important role in keeping Californians out of poverty. The credit supplements earnings for low-income workers at tax time, providing $2,400 on average to qualified tax filers.

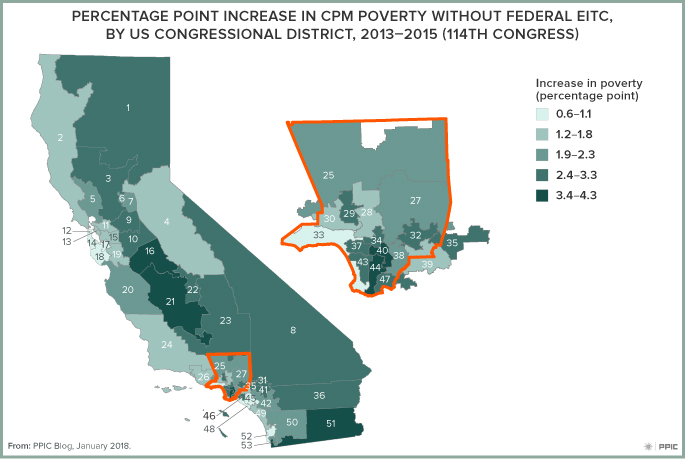
Without the EITC, we estimate an additional 814,000 Californians would live in poverty, according to the latest data from the California Poverty Measure (CPM), an ongoing collaboration between PPIC and the Stanford Center on Poverty and Inequality. This reduction in poverty makes the EITC nearly comparable to CalFresh (formerly known as food stamps), the safety net program that keeps the most Californians out of poverty. Our estimates reflect data from 2013 to 2015 and do not include the state EITC, which was introduced in 2015 and expanded in 2017. The state EITC lowers poverty by very little because the largest credits go to workers with very low earnings, whose families mostly live well below the poverty line.

The role that the EITC plays varies widely across regions. Statewide, the poverty rate would be 2.2 percentage points higher without the EITC (22.6% instead of 20.4%). But in Lake and Mendocino Counties (combined), the poverty rate without the EITC would be 4.1 percentage points higher than it is currently, reaching 26.8%. Poverty in Marin County, on the other hand, would increase only 0.2 points, to 16.5%. Such differences could be due to several factors—for example, the share of eligible families who take advantage of the credit and the local availability of jobs.

PPIC recently released data showing poverty rates, poverty thresholds, and the effects of safety net programs not only by county, but also by state assembly and senate district and by US congressional district. These data provide an opportunity to dig more deeply into the varying roles of safety net programs across the state.

The EITC, for example, has the largest effect in some of the highest-poverty congressional districts, including District 40 (Rep. Roybal-Allard) and District 44 (Rep. Barragán). But in some relatively high-poverty districts it plays a smaller role (District 46, Rep. Correa). The data we provide can be a starting point for investigating—and potentially remedying—incomplete access to the EITC.


Legislative District Data Offers Close-Up View of Poverty

Poverty varies widely across California’s 58 counties—from 13.1% in Placer County to 24.9% in Los Angeles County—according to data from the California Poverty Measure (CPM). The CPM is an ongoing collaboration between PPIC and the Stanford Center on Poverty and Inequality that adjusts for differing housing costs across counties and incorporates major social safety net programs like CalFresh food assistance and the Earned Income Tax Credit (EITC).

For the first time, PPIC recently released CPM data showing poverty rates and the effects of safety net programs not just for counties, but also for state assembly and senate districts and US congressional districts.

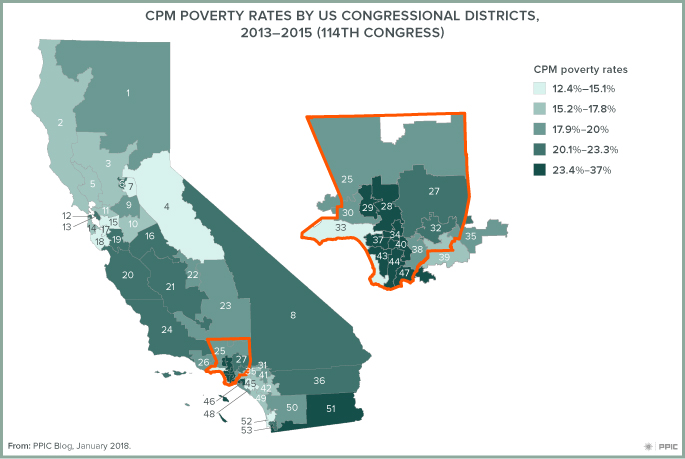
Congressional districts provide a more detailed view of densely populated areas. While counties have static geographic boundaries, California’s congressional districts are adjusted after every decennial census to equalize their populations (in 2010, each of the 53 districts contained 702,905 people). This means that Los Angeles County’s 9.9 million residents, for example, vote in 18 different congressional districts. The county’s average poverty rate of 24.9% reflects both the 13.4% in poverty in District 33 and the 37.0% in District 40, a stark difference illustrated in the map below.

As might be expected, district-level data show even wider geographic variations in poverty than county-level data, from 12.4% in District 15, which includes parts of Alameda and Contra Costa Counties, to 37.0% in District 40, in Los Angeles County. The CPM also shows that without safety net programs, the variation would be even more extreme, ranging from 16.2% in District 33 to 50.3% in District 40.

While counties often take the lead in implementing programs that mitigate poverty, many funding decisions related to social safety net programs are made at the state and federal levels. Understanding the distribution of poverty can help policymakers at all levels develop short- and long-run strategies to alleviate it in every area of the state.

Video: John Cox’s Priorities

Businessman John Cox, candidate for governor in 2018, was asked in a San Francisco forum last week to name the top three issues that will have major consequences in California’s future. Mark Baldassare, PPIC president and CEO, posed the question, which has been answered by all gubernatorial candidates appearing before PPIC audiences.

Cox said his top priorities are:

  • Removing the “corruptive” influence of special interest money. “The idea that special interests fund the campaigns of people they are looking to to get things done—it’s an indefensible system,” he said. “I don’t necessarily think that we send a whole bunch of corrupt people to Sacramento,” he said. “The trouble is, it’s a corrupt structure.” Legislators, he said, “are almost required to be professional fundraisers.”
  • Making the state more affordable and improving the business climate. The cost of housing, electricity, gasoline—the essentials to quality of life—are pushing the middle class into “almost-poverty situations,” Cox said, adding that improving the business climate is also essential so that the state can grow.
  • Addressing state employee pension debt. Cox said an overly generous legislature as well as governors and special interests have created a “debt bomb.” Our unfounded pension debt is a “sword of Damocles hanging over our economy,” he said.

How would Cox diminish the influence of special interests? He is sponsoring the Neighborhood Legislature Reform Act, which he hopes to qualify for the statewide ballot. The initiative calls for carving up each assembly and state senate district into 100 neighborhoods, each with its own representative. The 100 representatives in each neighborhood district would meet to choose one to go to Sacramento. In other words, there would still be just 120 legislators meeting in the Capitol. With districts that number just a few thousand households, candidates could run campaigns with a few hundred dollars, Cox said. The idea, he said, is that “you don’t need money to run a race.”

The conversation with Cox is part of the PPIC Speaker Series on California’s Future. PPIC is inviting all major candidates for governor to participate if they reach a certain threshold in the polls. The goal is to give Californians a better understanding of how the candidates intend to address the challenges facing our state.

Watch all candidate videos.