Video: Californians and Their Government

As Governor-Elect Gavin Newsom prepares for his first term, half of Californians think he should take a different policy direction than Governor Brown. Four in ten approve of Newsom’s plans and priorities—while three in ten don’t yet know enough to have an opinion. These and other key findings of the latest PPIC Statewide Survey were outlined by Dean Bonner at a Sacramento briefing last week.

The survey asked Californians about four major policy areas that were highlighted in the governor’s campaign. Most see universal health coverage and free community college as top priorities, while fewer see universal preschool as a high or very high priority and only one in four prioritize high-speed rail.

The survey also asked how the state should use the projected surplus in the next budget year. A majority of Californians say they would prefer to use the surplus to increase funding for education and health and human services. Far fewer prefer to use it to pay down debt and build up a reserve or to spend on one-time funding for transportation, water, and infrastructure.

When asked to identify the state government’s highest priority in planning for the future, 39% name improving jobs and the economy, 20% say protecting the environment, and 15% say updating water and transportation infrastructure. Improving jobs and the economy is the highest priority across all parties and demographic groups.

Other survey highlights:

  • Two-thirds of Californians say the state is divided into two economic groups: the “haves” and the “have nots.” Four in ten characterize themselves as haves and 45% say they are have nots.
  • While more than half of Californians think the state is generally headed in the right direction, only about a third are satisfied with the way things are going in the nation. Half have no confidence that President Trump will make the right decisions for the country’s future.
  • Only two in ten likely voters approve of Congress; more than half see the shift in control of the US House from the Republicans to the Democrats as a good thing.
  • Two-thirds of state residents continue to see immigrants as a benefit, and there is still bipartisan support for allowing undocumented immigrants to stay in the US legally if certain requirements are met.

What Approval Ratings Say about Jerry Brown’s Legacy

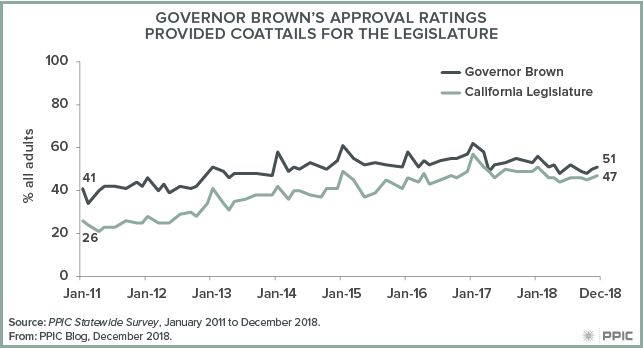
Perhaps Governor Jerry Brown’s most important contribution—rooted in the higher approval ratings for the executive and legislative branches—was to restore public confidence in state government.

That’s my conclusion after we at the Public Policy Institute of California have taken 64 surveys since Brown took office in January 2011 asking the same question: “Overall, do you approve or disapprove of the way that Jerry Brown is handling his job as governor of California?”

For most of the time since 2011, political gridlock stymied Barack Obama, Donald Trump, and Congress.

But in California, Brown and the state legislature were solving problems. Survey results show that the public responded. Brown’s latest (and our final) approval rating stands at 51 percent. That’s 10 points higher than his approval rating in our January 2011 survey. Brown’s approval rating surpassed 60 percent twice—after his 2014 reelection and after Trump’s election, when our January 2017 survey had the governor at a 62 percent approval rating. Not surprisingly, Brown’s highest approval ratings today are among Democrats and self-identified liberals, 68 percent and 69 percent, respectively, and is least popular among Republicans at 18 percent and self-identified conservatives at 36 percent.

Notably, his canoe theory of politics—paddle to the left, and then paddle to the right—seems to have worked well. About half of independents and moderates approve of the governor. Brown’s approval rating has never dipped below 47 percent since the voters passed his Proposition 30 tax increase in October 2012. The recent campaign for the Proposition 6 gas tax repeal and the race for his successor apparently had no effect on Brown’s popularity.

Brown steered through troubled fiscal waters that damaged other political careers. The approval rating for Gray Davis hit 31 percent in the September 2003 PPIC survey as he faced the recall that ended his time in office. His replacement, Arnold Schwarzenegger, had a 25 percent approval rating in the November 2010 PPIC survey, as the state suffered from massive budget deficits and he and the legislature struggled with unpopular spending and tax decisions.

The state legislature had been mired in low approval ratings for years. Perhaps the legislature rode the coattails of Brown’s success—its approval rating increased by 21 points, from 26 percent in the January 2011 PPIC survey to 47 percent in December. California’s fiscal recovery was certainly tied to more positive views of the governor and legislature. The perception that the state budget situation “is a big problem” fell by 25 points, from 68 percent in January 2011 to 43 percent in January 2018. At the same time, during Brown’s time in office, the belief that the state is generally going in the right direction grew by 16 points to 54 percent in December 2018.

Brown and the legislature took the drama out of the annual budget process, passed popular laws on education funding and climate change, responded to crises such as drought and wildfire, and maintained a united front against Trump’s unpopular policies.

Will Brown be be a hard act to follow for Gavin Newsom?

Maintaining fiscal stability and an effective partnership with the state legislature will be the key ingredients. Jerry Brown will be leaving office with Californians in a better state of mind than they were in eight years ago. His tenure offers a successful model for governing the state in the future.

Election Takeaways: Golden State of Mind

With the release of California’s official Statement of the Vote, the state’s final tally is in for the November 2018 election. This midterm election will mostly be remembered for California’s role in changing party control of Congress. But several other statewide results also stand out:

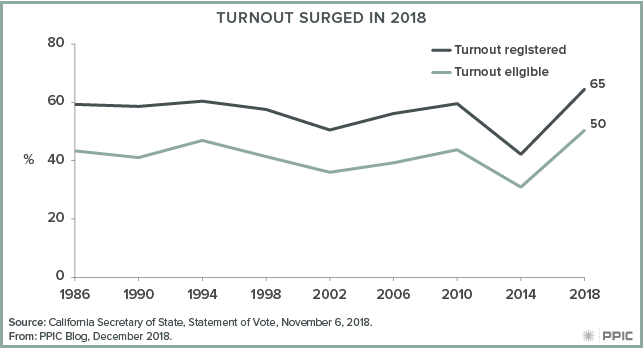
  • High turnout. A record-setting 19,696,371 Californians—78% of eligible adults—were registered to vote by the deadline for the general election. An increase of 1,892,548 registered voters since the 2014 general election represents the biggest surge in voter registration between midterm elections in the past 20 years, according to California’s Secretary of State. The 12,712,542 voters who cast ballots is an all-time high for a midterm and, at 65% of registered voters and 50% of eligible adults, this is the highest midterm turnout in the past 30 years. These increases follow record low turnout in 2014. Many factors were at work in heightening political engagement this fall, including intense media interest in California congressional races that carried over from the June primary; voter participation that was stoked by disapproval of President Trump and dislike of his immigration, environment, and tax policies; and new state laws that are being implemented to make it easier for Californians to register to vote and cast ballots.

  • Blue wave. Democratic candidates won every statewide race and gained enough state legislative seats to have well over a two-thirds majority in the state assembly (60 Democrats, 20 Republicans) and state senate (29 Democrats, 11 Republicans). Democrats also increased their grip on the California congressional delegation (46 Democrats, 7 Republicans). What accounts for this one-party dominance? Midterm elections are often described as a referendum on the president, and President Trump’s approval rating was at 39 percent in the October PPIC survey. PPIC surveys also found an “enthusiasm gap” in voting for congressional candidates, which further skewed the partisan turnout in favor of Democrats. But the difficulties facing Republican candidates go beyond this fall’s political headwinds. The November ballot did not even include Republican candidates for US senator, lieutenant governor, or insurance commissioner—no Republicans made it past the top-two June primary for these offices. The Republicans have not won a statewide race since 2006 and, in this time, their share of the electorate has declined by 10 points (34% to 24%) while their ranks have also diminished (5.4 million to 4.7 million), according to the Secretary of State.
  • Diverse officeholders. Gavin Newsom was elected governor in the only statewide race featuring two white men. California’s other statewide winners were four women, three Latinos, two Asian Americans, one African American, and one openly gay man. Notably, women candidates won all their races while all those who lost—five Republican candidates, the sole No Party Preference candidate, and a nonpartisan candidate—were white men. However, regional diversity was missing, with six successful candidates from the San Francisco Bay Area and three from the Los Angeles region. There were none representing the populous regions of the Central Valley, the Inland Empire, and the South Coast (Orange/San Diego)—or the more sparsely settled central coast and far north.
  • Words matter. Propositions 1 and 2, placed on the November ballot by the legislature, passed—consistent with the historically high pass rate for legislative ballot measures. However, just three of the eight citizens’ initiatives passed, consistent with the historically low pass rate for these types of initiatives. Among the most notable failures were the Proposition 6 gas tax repeal and the Proposition 10 rent control measure. The September PPIC Survey found that about half of likely voters favored the general idea of both the gas tax repeal (50%) and rent control (52%), but only four in ten said they would vote yes when they were read the ballot titles and labels. The defeat of Proposition 6 (56.8% no) and Proposition 10 (59.4% no) once again demonstrates that the devil is in the details when it comes to voter support for citizens’ initiatives on the ballot.

It’s no coincidence—given what PPIC studies say about the profiles of likely voters and nonvoters—that rising political participation in California means that the Democratic Party is becoming more dominant and that statewide officeholders are more likely to reflect the state’s diversity. And it is important to note that Californians continue to be highly selective about making public policy at the ballot box as more and more voters engage with the citizens’ initiative process. Still, millions of Californians are not registered to vote and don’t cast ballots. These residents tend to identify as “have nots” and are often most in need of government services. For this reason, the PPIC Statewide Survey will continue to provide a voice—for all adults in addition to likely voters—on state and national issues. Tracking policy preferences across the broadest swath of Californians is especially critical today, as newly elected state officeholders and state and federal legislators switch from campaign mode to policymaking.

Money Measures and the November Ballot

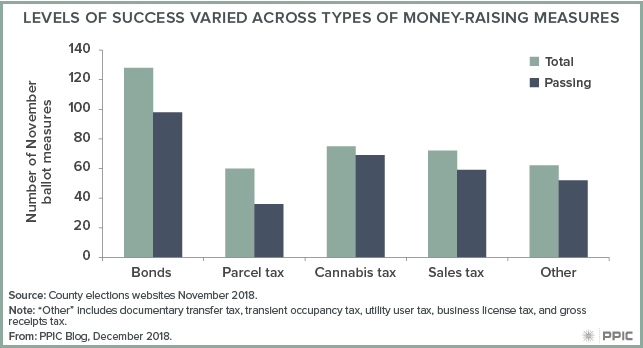
Earlier this year, we looked at how voters responded to the 107 money measures on the June ballot. The November election featured a considerably larger number of taxes, bonds, and fees: local governments asked voters to make decisions on 397 money-related questions, by our count. Most of these measures passed (314 or 79%), though success rates varied across types of taxation or borrowing.

Overall, most bonds passed (98 of 128), but the share of successful bonds for K–12 schools and community colleges (92 of 116, or 79%) was higher than the share of general obligation bonds in other spending areas (6 of 12, or 50%). Since Proposition 39 (which passed in 2000) lowered the passage threshold for school bond measures to 55%, more than 1,400 school bonds have been placed on ballots, and voters have approved more than 80% of them. Of the 92 school bonds that passed this year, 65 met the 55% threshold but fell short of a two-thirds majority.

Parcel taxes, California’s unique way of increasing property taxes in the Proposition 13 era, were the least successful type of taxes on the November ballot. However, voters did approve 60% of these measures (36 of 60), which is in line with their historical success rate. Most parcel taxes proposed by school districts passed (11 of 16, or 69%), while those placed on the ballot by fire districts were less successful (9 of 19, or 47%).

Through 2017, local governments had proposed 80 measures to tax cannabis businesses, generally based on gross receipts, size (measured in square footage), or some combination of the two. On the November ballot, there were 75 cannabis tax measures. As has been the case historically, voters approved the vast majority (69, or 92%).

Is California shedding its reputation as an anti-tax state? The fact that local measures have been successful nearly 80% of the time does not necessarily reflect voter support for taxes in general. According to recent PPIC Statewide Surveys, a majority of Californians feel that their tax burden is greater than it should be and see Proposition 13 as “mostly a good thing.” Also, savvy local leaders put money measures on the ballot only when polling or canvassing suggests the probability of passage is high.

A more precise interpretation of recent results might be that local governments have been very successful at identifying the type of taxes and purposes around which they can mount successful campaigns. Moreover, recent local measures have been put before voters during a period of economic growth. It will be interesting to see if they continue to succeed going forward.

Californians’ Priorities for the Next Governor

Mark Baldassare, PPIC president and CEO and director of the PPIC Statewide Survey, spoke to the Sacramento Press Club on November 19, 2018 in a post-election discussion with Mark DiCamillo, director of the Berkeley IGS Poll. Here are his prepared remarks.

While we are still counting votes in California, the 2018 election can be called a sweeping success for Democratic candidates in the statewide races. Democrats also won the coveted two-thirds majorities in the state senate and state assembly, and increased their dominance of the California congressional delegation. The Republican Party’s efforts to stem their losses by getting behind what they hoped would be a popular gasoline tax repeal stalled as Proposition 6 fell short (57% no).

In the governor’s race, Democrat Gavin Newsom defeated Republican John Cox by a double-digit margin that was similar to the re-election win of Governor Jerry Brown over Neil Kashkari in 2014 (60% to 40%). Newsom was the leader in eight PPIC Statewide Surveys on the governor’s race conducted since last December. Cox surged to second place after President Trump endorsed him in the June primary, but he was unable to expand his base much beyond the president’s approval rating (39%, October PPIC survey).

What are Californians’ priorities for Governor-elect Newsom? California voters mentioned health care, immigration, the economy, the environment, and gun policy when asked to choose the most important issues facing the country in the exit polls (CNN poll, Fox poll). This list covers most, though not all, of the most important state issues mentioned in 2018 PPIC surveys. It also offers a good starting point for identifying issues that will shape the Newsom era. Here is what the 2018 PPIC surveys have to say about each one:

Health Care. A record-high 59 percent of Californians have a favorable view of the Affordable Care Act (ACA) in the October PPIC survey. While 65 percent think it is the responsibility of the federal government to make sure that all Americans have health coverage, just 34 percent say it should be provided via a single government program instead of the current mix of private and public programs. While 64 percent of adults favor a single-payer state government health plan, support drops to 41 percent if it means raising taxes, according to the May PPIC survey. In the wake of ACA repeal and replace efforts, California’s health insurance exchange and MediCal expansion seem to be generating more public support, while the desire for wholesale change are tempered by concerns about choices and costs.

Immigration. Seventy-four percent of Californians believe that immigrants are a benefit to the state, while 85 percent say that there should be a way for undocumented immigrants to stay in the country legally, according to the May PPIC survey. About three in four (74%) oppose building a wall along the border with Mexico in the October PPIC survey. Nearly six in 10 (58%) favor state and local governments taking action, separate from the federal government, to protect the legal rights of undocumented immigrants in California in the October PPIC survey. Given the large immigrant population and strongly held public views, the next governor will be expected to lead the resistance against federal policies.

The Economy. About half of Californians say they expect good times financially for the state (48%) and the nation (48%) over the next 12 months, according to the October PPIC survey. Still, jobs and the economy tops their list when asked to name the most important issue facing the state in the September PPIC survey. Related to this concern, 60 percent say that the state government should be doing more to reduce the gap between the rich and the poor in California. At least half across demographic groups and regions say the state should do more. The next governor’s challenge in meeting this expectation will be the ambivalence about footing the bill. Fifty percent say they prefer to pay higher taxes and have a state government that provides more services, and 77 percent of them say the state should do more. But of the 44 percent of Californians who would rather pay lower taxes and have fewer services, just 42 percent hold this view.

Environment. A record-high 56 percent of likely voters say that the gubernatorial candidates’ positions on the environment are very important in determining their vote, according to the July PPIC survey. Many Californians say they are concerned about the personal impact of global warming in the wake of a prolonged drought and in the face of growing evidence that extreme weather from climate change is resulting in more severe wildfires. As the federal government has dramatically changed course on environmental issues, most Californians say they want the state government to make its own policies to address global warming, and many say that it is important for California to act as a world leader in fighting climate change. Californians will be looking to the next governor to build on the work in progress, while dealing with environmental crises like the wildfires this fall and with legal challenges from the Trump Administration.

Gun Policy. Most Californians (64%) say the laws covering the sale of guns should be made stricter, according to the October PPIC survey. The belief that gun laws should be stricter was at a record-high 73 percent in the March PPIC survey, shortly after the devastating high school shooting in Parkland, Florida. In the wake of the recent tragic shooting in a bar in Thousand Oaks, California, the public’s belief that gun laws should be made stricter may climb higher. And with the absence of new federal legislation to address gun violence, the governor-elect will be asked to find ways to improve the current laws restricting guns in California.

Californians’ priorities also include big-ticket items such as universal preschool and tuition-free community college that would add up to “cradle to career” education, initiatives to tackle housing affordability and homelessness, and adequate water and transportation infrastructure. The next governor will also be tested by a Democratic-controlled legislature with pent-up demand for spending after eight years of fiscal caution under Governor Brown. The October PPIC survey offers this guidance if voter approval is needed: a majority of California adults prefer a bigger government with more services to a smaller government with fewer services (54% to 39%); however, a majority of likely voters prefer a smaller government with fewer services to a bigger government with more services (53% to 41%).

As the priorities, plans, and programs of the new governor take shape in the next year, the mission of the PPIC Statewide Survey—­­ to provide a voice for all adults and likely voters— is one that we take very seriously during this critical moment of policy development. And as we look to 2020, it’s important to remember that California will be playing an early and outsized role in the presidential election, with an early March 3 primary. PPIC will host a series of one-on-one public forums next year with state and national leaders, to discuss their leadership style and to explore their vision for the state’s and nation’s future.

New Term Limits Add Stability to the State Legislature

California Democrats are on track to add two seats to their majorities in both the state assembly and the state senate. Combined with Democrat Gavin Newsom’s win in the governor’s race, these flips give Democrats the supermajorities they need for unfettered pursuit of their legislative agenda. While this partisan shift is certainly important, the impact of a recent change in term limits tells a larger story of remarkable stability.

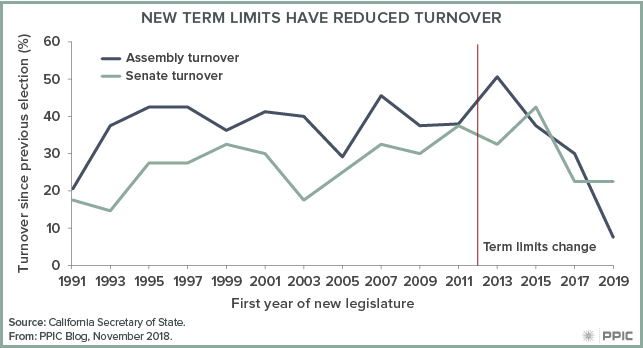
In 2012, California voters passed Proposition 28, which relaxed term limits by allowing legislators to serve up to 12 years in either or both chambers of the legislature. Under the previous rules, term limits for each chamber required anyone who wanted to spend the maximum 14 years in the legislature to move from one chamber to the other. And because the senate has half as many seats as the assembly, no more than half could serve the full 14 years.

Proposition 28 applies to legislators who were elected for the first time in 2012 or later. Most of these legislators have been sticking with the seats they originally won, where incumbency makes reelection most certain.

There has been a gradual adjustment to the new limits as the last few legislators covered by the old regime move through the system. Most of these members started in the assembly and moved to the senate, and their assembly seats were filled by legislators subject to the new limits. By 2018, only one assembly incumbent was covered under the old regime, down from 14 in 2016 and 37 in 2014. This incumbent, Anna Marie Caballero, was termed out and ran for the senate.

The impact of Proposition 28 has been significant, particularly in the assembly, where turnover has plummeted from a peak of 50% in the 2012 election to just 8% this cycle—a 30-year low. Senate terms are twice as long as assembly terms and only half of the chamber is up for reelection each cycle, so there is naturally less turnover there. Nonetheless, turnover in the senate shows signs of decline.

Proposition 28 has also led to a gradual increase in assembly expertise. The average member of the assembly next year will have spent almost five years in the legislature, longer than in any legislative term since the original term limits first began to force members out. Senate expertise, on the other hand, has declined from 18 years in 1995 to just 6.5 after the 2018 election, and may never increase much again. Under the old regime, most senators served a full 14 years by moving over from the assembly; though more will now spend their whole career in the senate, they can serve 12 years at most.

The growth in assembly expertise helps bring the two chambers closer to equality in the policymaking process. But this expertise necessarily comes at the price of lower turnover in some elections. Partisan changes may rightly receive most of the attention this election cycle, but broader changes in membership are the exception not the rule.

How Strong Is the Trump Effect in California?

Was the 2016 presidential election a sign of things to come—presaging an ever-bluer California? Or was it a one-off result driven by the personalities of the candidates?  These are important questions in California, which voted more Democratic for president in 2016 than it had in 2012, even as the rest of the country moved in the opposite direction.  Even more important, parts of the state that had been reliably Republican—most notably Orange County—suddenly shifted Democratic. Based in part on this result, California’s Democratic candidates fought hard in yesterday’s midterm for several US House seats held by Republicans.

Did the anti-Trump/pro-Clinton vote reliably predict the 2018 outcome? To answer this question, the figure below compares California’s 2016 presidential vote to the 2018 US House vote in all districts with both a Democrat and a Republican running. The solid black diagonal line marks the point where the 2016 presidential vote perfectly matches the 2018 US House vote. Points above the line mark seats where the Democrats outperformed the 2016 presidential vote, and points below show where they underperformed. The competitive seats mentioned above are identified in orange.

The first thing to note is that the 2016 presidential vote predicts the 2018 US House vote quite well.  Higher Democratic presidential votes reliably translate into higher Democratic House votes, so knowing the presidential vote tells us a lot about how a district is going to vote for other offices. This is true even for the competitive races in which the 2016 presidential vote was a surprise.

At the same time, virtually every seat falls below the solid diagonal line. That means the Democratic House candidates in these districts consistently failed to match the support shown for Hillary Clinton in 2016. Though the Democrats are poised to pick up at least three House seats in California, support for the Democratic Party is softer in these races than it was two years ago.

On balance, however, the 2016 outcome was not a one-off:  the areas that voted more Democratic than expected are continuing to vote more Democratic.  At the same time, Democrats would have picked up more seats in the midterm had the US House vote this cycle matched the 2016 presidential vote exactly. Despite what was generally a good Democratic night, the overall outcome fell short of the 2016 benchmark.

Election Day Matters

It’s Election Day, and voters across the nation are choosing their leaders at a divided and contentious time. Although Californians are divided on many issues today, majorities of voters across party lines say they are more enthusiastic about voting than usual this year (October PPIC survey: 72% Democrats, 64% Republicans, 53% independents). This is welcome news after a 2014 statewide election that set a new record for the lowest voter turnout. It will be interesting to see how many Californians will actually follow through and cast their ballots for governor, state constitutional officers, and state legislators.

Who will vote in the California election will be closely watched on election night since a handful of House races may well determine the party in control of the next US Congress. Democrats seem more energized than Republicans in voting for Congress this year (October PPIC survey: extremely/very enthusiastic: 57% Democrats, 40% Republicans, 35% independents). However, we also find an “enthusiasm gap” that favors white, older, and more affluent Californians who tend to be conservative voters. This raises questions about whether there will be a “blue wave” or merely a ripple this year.

In addition to electing their leaders, California voters play an outsize role in policymaking in our state. In another striking area of agreement across party lines, most Californians say that they like the initiative process and feel they make good decisions at the ballot box—despite reservations about the number and complexity of ballot measures. Because of the central role the initiative process plays in California policymaking, voters have a special obligation to weigh in on important choices facing the state. This election, Californians will vote on 11 state propositions, in addition to numerous local measures.

Still, many Californians who are eligible do not vote. We’ve found significant gaps between voters and non-voters in the state. Voters are much more likely to be older, white, and own their homes. They have higher education and income levels. And they are more likely to identify as one of the “haves” than the “have nots.” This means that important policy choices that affect the entire population are determined by voters who do not necessarily reflect the state’s social, political, or economic diversity.

The state has implemented several reforms to ease access to registration and voting, many of them quite recently. The jury is still out on the long-term effects of these efforts, but one thing is sure: voting matters. Elections have the power to change the direction of history.

So on this Election Day, it is critical for all eligible Californians to exercise their right to vote. For anyone in need of last-minute help on ballot choices, solid nonpartisan information is available in the state’s voter guide.

PPIC is keeping a close eye not only on the immediate outcome of the vote, but also on long-term trends and implications. Stay tuned to the PPIC blog for post-election thoughts and analysis of this year’s important midterms.

Video: Californians and Their Government

In the last weeks of the fall campaign, Democrat Gavin Newsom remains ahead of Republican John Cox in the race for governor. In the US Senate race, Dianne Feinstein continues to lead fellow Democrat Kevin de León. Two closely watched ballot measures—Proposition 6, which would repeal the recent gas tax increase, and Proposition 10, which would expand local authority to enact rent control—are still trailing. These and other key findings of the latest PPIC Statewide Survey were outlined by PPIC researcher Alyssa Dykman at a Sacramento briefing last week.

Democrats are more likely than Republicans to be very or extremely enthusiastic about voting in congressional races, and a majority of likely voters favor the Democratic candidate in their US House district. However, most likely voters have negative views of both major parties.

Other survey highlights:

  • Approval ratings for Governor Jerry Brown and the state legislature continue to be much higher than those for President Trump and the US Congress.
  • A majority of likely voters disapprove of the Senate vote to confirm Brett Kavanaugh’s appointment to the Supreme Court.
  • A majority of likely voters favor the Affordable Care Act, and a solid majority say the federal government is responsible for making sure all Americans have health care coverage.
  • Two-thirds of likely voters oppose building a wall along the entire border with Mexico; a slim majority favor the state making its own policies to protect the rights of undocumented immigrants.

Is California Turning Even Bluer?

California is already a fairly Democratic state, but in the last two years many have wondered if it has become even more so. In the 2016 presidential election, California was one of a few states that did not shift away from the Democrats. In most of the country, Hillary Clinton garnered a smaller share of the vote than Obama received in either of his campaigns for president—but in California, Clinton improved on Obama’s 2012 vote share by 1.3%, while Donald Trump fell short of Mitt Romney’s share by 5.6%.

Some areas of the state, such as Orange County, have experienced long-term demographic trends that favor the Democrats, yet the swing to Clinton in these places outpaced these trends. Seven of California’s congressional districts are held by Republicans but were won by Clinton in 2016. Just two years earlier, five of those seats favored Republican Neel Kashkari for governor by at least 10 points—in a race that Democrat Jerry Brown won by 20 points statewide.

The 2016 presidential vote therefore marked a big change of fortune for California Democrats, particularly in some districts. Does this mean that these districts have become more Democratic for good, or was the 2016 result a reaction to the personalities on the ballot?

One way to answer this question is to compare the change in the Democratic presidential vote in each congressional district to the change in party registration. Party registration indicates a more enduring attachment—something closer to a permanent change in allegiance. If party registration changed to match the latest presidential vote, it might indicate that something longer-term is afoot.

The figure below compares the change in the Democratic presidential vote between 2012 and 2016 to the change in party registration in the state’s 53 congressional districts from 2014 to 2018. The blue dots indicate Democratic registration change, and the red dots indicate Republican change.

Statewide, the Democratic Party has mostly held steady in registration while the Republican Party has lost ground. We can see this pattern above: the blue Democratic dots are clustered around zero on the vertical axis, indicating little average change, while all the red dots are below zero, indicating a decline in Republican registration. However, our question is whether a larger 2016 surge led to a larger change in party registration by 2018. If this has happened, the blue dots should be higher toward the right side of the graph and the red dots should be lower. We can see such a pattern, but it is weak. Districts on the left have indeed seen both smaller increases in Democratic registration and smaller decreases in Republican registration. Likewise, those on the right have seen larger Democratic gains and larger Republican losses. But the difference is modest.

The districts with the largest Democratic shifts—seen on the far right of the graph—display the expected pattern more clearly. In fact, most of the competitive congressional races mentioned above are represented here. Of the seven races considered most competitive by the Cook Political Report, four are in districts that shifted more than 6 percent toward the Democrats in the 2016 presidential race. All four districts are in or around Orange County: 39 (outgoing incumbent Ed Royce), 45 (incumbent Mimi Walters), 48 (incumbent Dana Rohrabacher), and 49 (outgoing incumbent Darrell Issa). Each of these districts also saw a Democratic registration gain of at least 1.4% and a Republican registration loss of at least 4.4%. So the districts with the most surprising results in 2016 are generally also the places with the biggest Democratic gains in registration.

Overall, these results do provide some support for the idea that the 2016 election marked a more permanent change in the state’s politics. But party registration tends to change slowly, and the patterns we are seeing suggest there may be years to go before any transition is complete.