Will California’s Red Districts Turn Blue in November?

One of the important questions hanging over California politics this election cycle is the impact of Donald Trump. In the 2016 presidential race, support for Trump was soft, with some parts of the state voting Democratic for the first time in more than a generation.

This shift encouraged Democrats to target congressional seats that had previously been considered out of reach for the party. The seven Republican-held US House seats considered most competitive all voted for Clinton over Trump. Yet many of these places haven’t voted Democratic for higher office in decades. Is this Democratic optimism warranted, or was 2016 a fluke?

Tuesday’s primary can help answer this question. California’s top-two system—in place since 2012—offers a view into the partisan sentiment in these districts in a year when Donald Trump is not on the ballot. It’s more like a first-stage general election because it lets voters choose any candidate they like regardless of party.

The figure below compares the share of the two-party primary vote for Democratic candidates to the 2016 two-party presidential vote in the same district (primaries without at least one candidate from each major party have been omitted). Each point is a state legislative or US House seat. The more the points cluster in the shape of a line, the stronger the correlation between the two votes. But any point above the line has a 2018 primary vote that is more Democratic than its 2016 presidential vote, while any point below is more Republican.
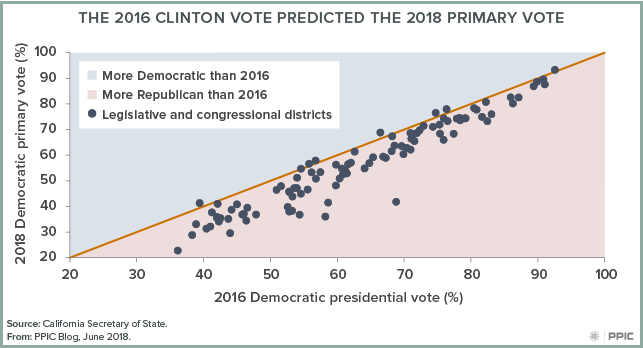
This figure tells us two things. First, the 2016 presidential vote predicts the 2018 results quite well. As the Democratic presidential vote increases, the Democratic primary vote in 2018 climbs as well. Moreover, the slippage in this relationship (and there is some) is about as large as in previous top-two years.

Second, the Democrats underperformed Clinton’s 2016 vote in almost every district. This too is consistent with the past. Democrats have underperformed the presidential vote in every primary under the top-two system. In fact, the underperformance was actually a little smaller this year than the average. This suggests it’s normal for Democrats to look bad in the primary season, and that it’s no reason for Democrats to be worried or Republicans to be excited.

However, this tells us less about the fall outcome than it might appear. The party vote in the general election usually shifts Democratic, but the magnitude of this shift varies a great deal. It was quite large in 2012: a seat with a 50 percent Democratic outcome in the primary on average voted 56 percent Democratic in the general. But in 2014 there was almost no change at all, and in 2016 the fall outcome was slightly more Republican.

Thus, for Democrats these results are a mixed bag. On the one hand, there are signs that the Trump effect in California has staying power. On the other hand, the consequences for this fall’s election are not altogether clear. The Democrats probably won’t do much worse on average than they did on Tuesday. But beyond that it’s difficult to say, and the consequences for individual seats will have to wait until Election Day.

A Preview of the California Governor’s Election

The people have spoken and the November election for governor has been decided: Democrat Gavin Newsom will face off against Republican John Cox. Let’s look at recent PPIC surveys to help us understand the determining factors of this outcome and the political dynamics that will surface in this fall’s matchup.

In the weeks before the June primary, the May PPIC survey found that Newsom was his party’s favorite in a race with the four major Democratic contenders, while Cox was his party’s top choice in a contest between the two major Republican contenders. The election results confirmed these trends in the voting patterns of red and blue counties. What is it about these candidates that was attractive to their bases?

The primary results were foreshadowed in a January PPIC survey. When likely voters were asked about the qualifications that they are looking for in a candidate for governor, most Democrats (84%) said they wanted a candidate with experience in office, while most Republicans (65%) preferred a candidate with experience running a business. The party faithful chose the person who arguably fit their profile best—Lieutenant Governor Newsom and businessman Cox. While California likely voters favor elected experience to business experience by a wide margin (62% to 31%), the fall election will focus on issues where opinions are more divided. This suggests a more competitive race than one might expect in deep blue California.

The November gubernatorial election is set in a midterm-election context perceived as a referendum on President Donald Trump and the Republican-led Congress. John Cox is endorsed by President Trump while Gavin Newsom is a vocal member of the Trump resistance. Democrats hope to flip several of the House seats held by California Republicans so that their party can take control of Congress. This election comes at a time when independents are now the second largest voter group at 4.9 million (SOS, June 1).

Slim majorities of California likely voters also say they would vote for the Democratic candidate over the Republican candidate in their House district races in both the March PPIC survey (53% to 39%) and in the May PPIC survey (52% to 38%). Democrats strongly preferred the Democratic candidate (92% March, 91% May) and Republicans strongly favored the Republican candidate (87% March, 86% May) while, again, independents are divided (Democrats: 37% March, 43% May). The independents’ turnout and leanings will thus be a focal point in House races—another reason this voter group is the wildcard in November.

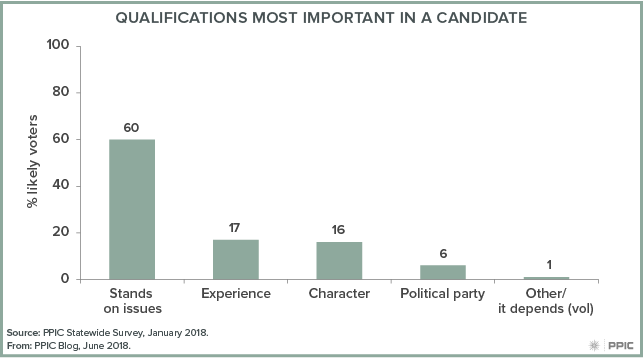
What else will Californians need to know about the two candidates? In the PPIC January survey, 60% of likely voters rank the candidates’ stands on the issues above several traits: experience (17%), character (16%), and political party (6%). Likely voters most often name the economy, immigration, and housing costs as their top issues in the May PPIC survey. Eighty-two percent of likely voters say that the candidates’ performances in public debates will be important in determining their vote for governor.

PPIC has invited the two gubernatorial candidates to participate in a public conversation with me about the issues, their leadership, and vision for California. Stay tuned for more information about when and where it will take place, and how you can attend or watch this special PPIC event.

Single-Payer Health Care and the Governor’s Race

One issue that may prove decisive for Democrats in the 2018 governor’s race is single-payer health care. With the leading Democratic candidates supporting a single-payer system—and the leading Republican candidates in opposition—the race has shed light on the financial, political, and regulatory challenges associated with expanding health coverage across the state.

Last year, the state senate passed a bill (SB 562) that would establish a single-payer health insurance program to cover all Californians. However, the bill was shelved in the state assembly until further notice. According to estimates by the nonpartisan Legislative Analyst’s Office, the bill’s total annual costs would be about $400 billion. Democratic gubernatorial candidates Gavin Newsom and Delaine Eastin have been the most vocal proponents of single-payer health care and have publicly backed the bill. Democratic candidates Antonio Villaraigosa and John Chiang, while supportive of the idea, have expressed concerns over financing and implementation. Both the leading Republican candidates, John Cox and Travis Allen, strongly oppose single-payer health care and have emphasized the need for more competition in the marketplace.

With candidates’ differing positions, how are Californians feeling about single-payer health care today?

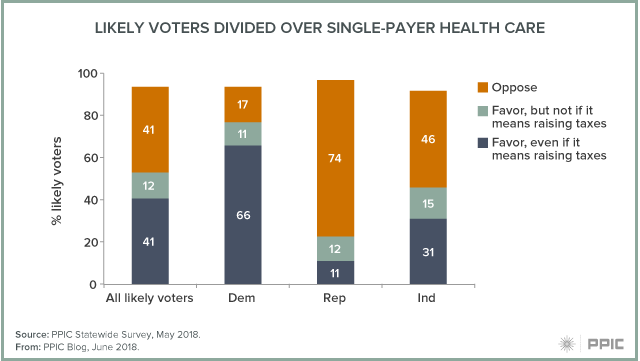
The May PPIC Statewide Survey found a majority of California’s likely voters (53%) favor a single-payer state plan. However, if this plan requires raising taxes, support declines to 41%. Across parties, an overwhelming majority of Democratic likely voters (77%) are in favor, while an overwhelming majority of Republicans (74%) are opposed; independent likely voters are divided (46% favor, 46% oppose). Notably, 66% of Democratic likely voters would favor a single-payer system—even if it means higher taxes.

The issue has become a litmus test for Democrats—pitting progressives against pragmatists—but, overall, Democrats express strong support for a single-payer system. Among likely voters who call themselves strong Democrats, 81% are in favor, compared to 69% who say they are not very strong Democrats. Among likely voters who call themselves strong Republicans, 83% are opposed to a single-payer system (the sample size for those calling themselves not very strong Republicans is too small for analysis).

Given partisan divides, the next governor may face significant political hurdles moving forward with single-payer health care. Coupled with statewide challenges, California would need to collaborate with the federal government to implement such a system. In consideration of these factors, the June primary is an opportunity for Californians to determine their future leadership and the state’s policy directions—including a possible step toward single-payer coverage.

The Gender Gap in California Politics

In the past year, women have led large-scale political protests nationwide and an increasing number are running for elected office. In California, likely women voters have a numeric edge over men (53% to 47%), according to PPIC’s analysis. With the midterm elections quickly approaching, will women make a pivotal difference?

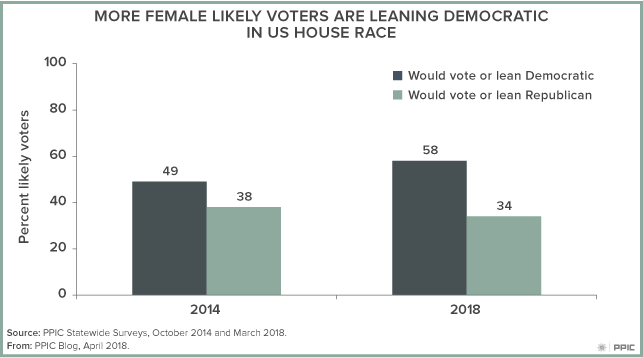
PPIC’s March 2018 survey offers some insight: nearly six in ten women (58%) support the Democratic candidate on the generic ballot for the U.S. House of Representatives—a 9-point increase since 2014. Preferences among men are unchanged.

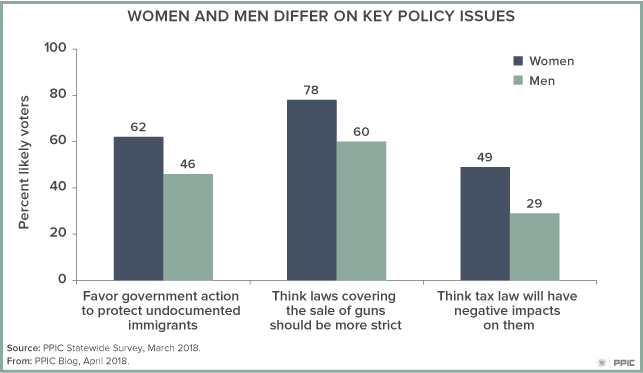
Although PPIC surveys show female likely voters are much more likely than their male counterparts to disapprove of President Trump (67% to 52%), issues like immigration policy, gun control, and taxes also reveal degrees of a gender gap. Examples include:

  • Immigration policy. Six in ten female (62%) likely voters are in favor of state and local governments making their own policies—separate from the federal government—to protect the rights of undocumented immigrants; fewer than half of men (46%) are in favor.
  • Gun control. While solid majorities of men and women think laws covering the sale of guns should be stricter, more women (78%) than men (60%) hold that view.
  • Federal tax law. Differences are also apparent between women (49%) and men (29%) who believe that the tax laws will have a negative impact on their families in the coming years.

However, it is important to note the role that party plays in policy preferences. For each of the aforementioned issues, there are sizable differences between Democratic women and Republican women. It’s also notable that among Republican likely voters, more women (54%) than men (38%) think gun laws should be stricter.

California is often mentioned as a battleground state in the 2018 elections, and tension between the federal and state governments is palpable. California’s government stands in opposition to many policies coming out of Washington and several of its congressional seats could be up for grabs—potentially determining the party that will lead the next US Congress. As a result, the nation will be watching California. And the PPIC Statewide Survey will continue to follow the perceptions and preferences of California’s likely voters, with particular interest in the gender gap.

California’s Immigrants and the 2018 Election Context

This piece is excerpted from a presentation at the USC Annenberg School for Communication and Journalism given on March 30, 2018, in Los Angeles.

Many eyes will be on California in this midterm election year, especially since control of Congress may hinge on the outcome of 10 competitive House races in the Golden State. Currently, more than a quarter of the state’s residents are born outside the US—and one in five immigrants make up what we consider likely voters in California elections. With federal immigration policy playing a lead role in today’s polarized political discussions, will California’s immigrants have an impact—and to who’s advantage—in the 2018 election?

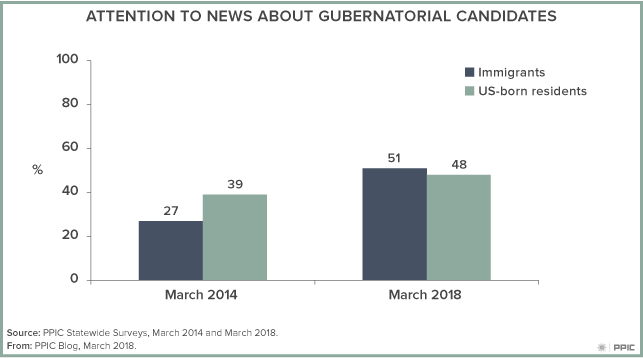
Typically, California’s immigrants are less interested in politics than their US born counterparts. But not when it comes to the 2018 election cycle. Among likely voters in our current survey, immigrants and nonimmigrants are similarly likely to be following the news about gubernatorial candidates “very” or “fairly” closely (51% immigrants, 48% US born). Both groups say that voting this year is more important than in past midterm elections (47% immigrants, 51% US born). Perhaps most telling for this year, both likely voter groups mention immigration and illegal immigration when asked about the issue that they would most like to hear the gubernatorial candidates talk about before the June primary (23% immigrants, 23% US born).

When it comes to current candidate choices, we do see some divergence between immigrant and US-born likely voters:

  • Democrat Gavin Newsom slightly trails Democrat Antonio Villaraigosa among immigrants (17% to 23%), while he is favored by three to one over Villaraigosa among nonimmigrants (30% to 9%).
  • Republican John Cox does equally well with both groups (15% immigrants, 14% US born).
  • Democrat Dianne Feinstein is favored by large margins over Democrat Kevin de León both among immigrants (50% to 18%) and nonimmigrants (40% to 16%). She has a higher approval rating among immigrants than nonimmigrants (68% to 51%).
  • Immigrants are more likely than nonimmigrants to favor the Democratic candidates in their local House races (63% to 51%) and less likely to favor the Republican candidates (30% to 41%). Immigrants also give higher approval ratings than nonimmigrants to their current local House member (59% to 51%).

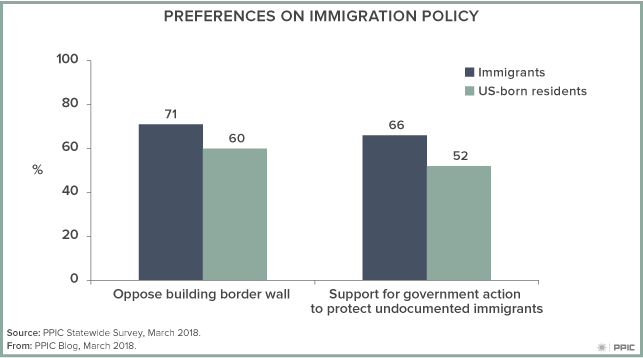
Despite these differences, immigrant and nonimmigrant Californians are aligned in their views of the current policy landscape. Majorities in both likely voter groups disapprove of President Donald Trump (63% immigrants, 60% US born), oppose the new federal tax law (65% immigrants, 56% US born), want gun laws to be stricter (82% immigrants, 67% US born), and oppose building a wall along the entire border with Mexico (71% immigrants, 60% US born). When it comes to state and local governments making their own policies and taking action separate from the federal government, majorities in both likely voter groups say they are in favor of protecting the legal rights of undocumented immigrants (66% immigrants, 52% US born).

One of the political wildcards in this California mid-term election is whether the strong opposition to federal immigration policy will motivate more naturalized citizens to vote and more noncitizens to become citizens and register to vote. As noted earlier, immigrants make up a larger share of the state’s population than is reflected in the likely voter group—leaving much room for growth that could transform the state’s electorate. The PPIC Statewide Survey will be closely monitoring the trends in political engagement and ballot choices in this consequential election for California and the nation.

The President’s Popularity and the Midterm Election

California is a battleground state in the 2018 midterm election. When it comes to determining the party that will lead the next US Congress, all eyes are on the 14 US House seats that are currently held by Republicans in the deep-blue state of California. Democrats would need to “flip” several of these seats if they have any chance of taking control of the US House, where Republicans currently now have a 26-vote margin. The party in power has typically lost some of its congressional seats in national midterm elections. Whether it is a few seats or many is closely tied to the president’s popularity. So, how is Donald Trump viewed in California at the end of his first-year anniversary in office?
The PPIC Statewide Survey has been tracking President Trump’s popularity, asking the following question in six monthly surveys in 2017, “Overall, do you approve or disapprove of the way that Donald Trump is handling his job as president of the United States?” We found majority disapproval of President Trump among California likely voters in each survey. In the January 2017 PPIC survey, conducted in his early days in office, 34% approved and 55% disapproved of his job performance. In the 2017 December PPIC survey, which is our most recent poll, 34% approved and 63% disapproved of President Trump. In the course of 2017, disapproval of the president increased as more likely voters formed opinions about his leadership.

By the end of the first year, we also found that disapproval of President Trump increased by double digits in several likely voter groups. In comparing the January 2017 PPIC survey to the December 2017 PPIC survey, disapproval increased

  • 21 points for those younger than 35 (63% to 84%)
  • 15 points among independent (i.e. no party preference) voters (50% to 65%)
  • 12 points among college graduates (62% to 74%)
  • 12 points among those who earn under $40,000 a year (57% to 69%)
  • 11 points for those who earn $80,000 or more (55% to 66%)
  • 10 points among Latinos (72% to 82%)

Moreover, from January to December 2017 disapproval became the majority response among men (49% to 58%), those age 55 and older (49% to 57%), and those with some college education (50% to 58%).

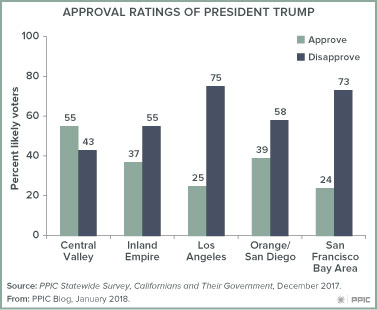
Regional trends in presidential disapproval ratings also point to a challenging environment for Republicans running in House elections this year. Predictably, there is overwhelming disapproval of President Trump in the Democratic strongholds of Los Angeles (75%) and San Francisco (73%) in the December 2017 PPIC survey. More surprisingly, over the course of 2017 disapproval of Trump’s performance increased to majority levels in Orange/San Diego (50% to 58%) and the Inland Empire (39% to 55%), where several of the House seats that are now held by Republicans are located. Coincidentally, two Republican House members in Orange/San Diego decided not to run for reelection.

There are two bright spots for Republicans in the president’s approval ratings. First, President Trump has held a solid base of support among Republican likely voters, according to a comparison of the January 2017 PPIC survey (76% approve) and the December 2017 PPIC survey (78% approve). Second, his approval increased to a majority in the Central Valley according to a comparison of the January 2017 PPIC survey (40%) and the December 2017 PPIC survey (55%). Importantly, several of the House seats now held by Republicans are in the Central Valley.

Finally, in placing the 2018 midterm election in recent historical context, it is especially noteworthy that the level of disapproval of President Trump at the end of his first year in office is relatively high compared to the past two US presidents. The December 2009 PPIC survey found that a majority of California likely voters approved of President Barack Obama (54% approve, 40% disapprove) in the midst of the Great Recession. The December 2001 PPIC survey found that overwhelming majorities approved of President George W. Bush (78% approve, 20% disapprove) in the wake of the 9/11 terrorist attack.

In California, the combination of presidential disapproval ratings (63%) and voter registration trends (45% Democrat to 26% Republican) sets the stage for the Republicans’ efforts to hold on to House seats to maintain control of the US Congress. However, the wildcard in the 2018 California election is the size and composition of the voter turnout—and in the 2014 midterm election, turnout hit a record low.

The PPIC Statewide Survey will be closely monitoring President Trump’s approval ratings, as well as indicators of the voters who are motivated to cast ballots in what will be a consequential election for California and the nation.

Video: John Cox’s Priorities

Businessman John Cox, candidate for governor in 2018, was asked in a San Francisco forum last week to name the top three issues that will have major consequences in California’s future. Mark Baldassare, PPIC president and CEO, posed the question, which has been answered by all gubernatorial candidates appearing before PPIC audiences.

Cox said his top priorities are:

  • Removing the “corruptive” influence of special interest money. “The idea that special interests fund the campaigns of people they are looking to to get things done—it’s an indefensible system,” he said. “I don’t necessarily think that we send a whole bunch of corrupt people to Sacramento,” he said. “The trouble is, it’s a corrupt structure.” Legislators, he said, “are almost required to be professional fundraisers.”
  • Making the state more affordable and improving the business climate. The cost of housing, electricity, gasoline—the essentials to quality of life—are pushing the middle class into “almost-poverty situations,” Cox said, adding that improving the business climate is also essential so that the state can grow.
  • Addressing state employee pension debt. Cox said an overly generous legislature as well as governors and special interests have created a “debt bomb.” Our unfounded pension debt is a “sword of Damocles hanging over our economy,” he said.

How would Cox diminish the influence of special interests? He is sponsoring the Neighborhood Legislature Reform Act, which he hopes to qualify for the statewide ballot. The initiative calls for carving up each assembly and state senate district into 100 neighborhoods, each with its own representative. The 100 representatives in each neighborhood district would meet to choose one to go to Sacramento. In other words, there would still be just 120 legislators meeting in the Capitol. With districts that number just a few thousand households, candidates could run campaigns with a few hundred dollars, Cox said. The idea, he said, is that “you don’t need money to run a race.”

The conversation with Cox is part of the PPIC Speaker Series on California’s Future. PPIC is inviting all major candidates for governor to participate if they reach a certain threshold in the polls. The goal is to give Californians a better understanding of how the candidates intend to address the challenges facing our state.

Watch all candidate videos.

Video: Preview of the Statewide Election

Setting the stage for a year of crucial decisions, the December PPIC Statewide Survey took a first look at the 2018 governor’s race. Two Democrats—Gavin Newsom, the state’s lieutenant governor, and Antonio Villaraigosa, former mayor of Los Angeles—lead among likely voters. But the survey also underscored that it’s early in the campaign to replace retiring governor Jerry Brown. Among likely voters, a third are undecided and just a quarter are following news about the candidates fairly or very closely.

In the US Senate primary, incumbent Dianne Feinstein leads fellow Democrat Kevin de León, state senate president pro tempore, by a two-to-one margin in a matchup of the two candidates. A third of likely voters are undecided in this race, as well.

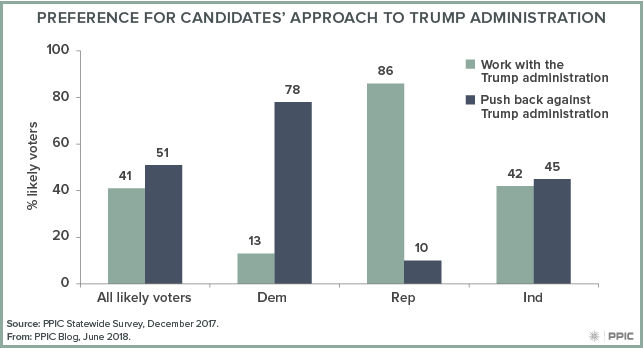
Dean Bonner, associate survey director at PPIC, presented the key findings at a Sacramento briefing last week. As he noted, the survey findings reflect a divided and unsettled electorate. Likely voters are split on what is more important in a candidate for statewide office: new ideas and a different approach (48%) or experience and a proven record (42%). Asked about how candidates for statewide office should interact with the federal government, half of likely voters (51%) prefer that candidates push back against the Trump administration and 41% prefer that candidates work with the administration.

Video: Gavin Newsom’s Priorities

Gavin Newsom, California’s lieutenant governor and a candidate for governor in 2018, was asked in a San Francisco forum last week to name the three issues that will make the biggest difference in California’s future. Newsom, who is also a former mayor of San Francisco, predicted that both California and the nation will be grappling with these issues over the next ten years:

  • Debt and demographics. With California’s population aging rapidly, the state and its cities face growing public employee pension and health care liabilities. “As a progressive Democrat, I’m not naïve about the commitments we’ve made and the commitments we must fulfill,” Newsom said. “Nor am I naïve, as a former mayor, about the challenge of meeting those commitments . . . Cities like Richmond are facing the prospect that by 2021, by one estimate, upwards of 40% of their general fund will go to retiree contributions.”
  • Energy and climate change. The state has set ambitious goals to reduce greenhouse gas emissions and increase energy efficiency. “The next governor has to deliver,” he said.
  • Information technology and globalization. “The issue that animates my anxiety: work, the future of work.” The days of having a job or career have given way to something radically different, forcing us to think in terms of portable benefits and retirement security, he said. Further, workers in retail, food and beverage, and clerical jobs—the top employment categories—are on the “edge of automation.” Displacement of these workers will require us to have a different conversation about skills, education, and social mobility, Newsom said.

The conversation with Newsom was part of the PPIC Speaker Series on California’s Future. PPIC is inviting all major candidates for governor to participate in a public event if they reach a certain threshold in the polls. The goal is to give Californians a better understanding of how the candidates intend to address the challenges facing our state.

Watch all candidate videos.