Do Californians Support the Proposed School Bond?

When Californians go to the polls in March, they will not only cast a vote in the presidential primary—they will also vote on an education bond to fund construction and modernization projects. Given differences in support for the bond across the state’s regions and demographic groups, turnout will play a pivotal role in whether this measure passes.

In the closing days of the legislative session, the legislature passed and the governor later signed a bill placing Proposition 13 (the Public Preschool, K–12, and College Health and Safety Bond Act of 2020) on the March ballot. If approved by voters, the measure would authorize $15 billion in general obligation bonds to pay for the construction and modernization of California’s public schools, community colleges, and four-year colleges.

The September PPIC Statewide Survey took an initial look at support for this proposition. While two-thirds of Californians (66%) are in favor, 54% of likely voters say they would vote yes—just slightly above the majority needed to pass.

Are some Californians more likely than others to support the bond measure? Unsurprisingly, there is a wide partisan divide, with three in four Democratic likely voters (76%) saying they would vote yes compared to just three in ten Republicans (29%). Overall, independent likely voters are divided (48% yes, 44% no). But among Democratic-leaning independents, nearly two in three (64%) are supportive.

Support varies across regions, with Los Angeles (59%) and San Francisco Bay Area (57%) likely voters expressing the most support, compared to about half of likely voters elsewhere in the state.
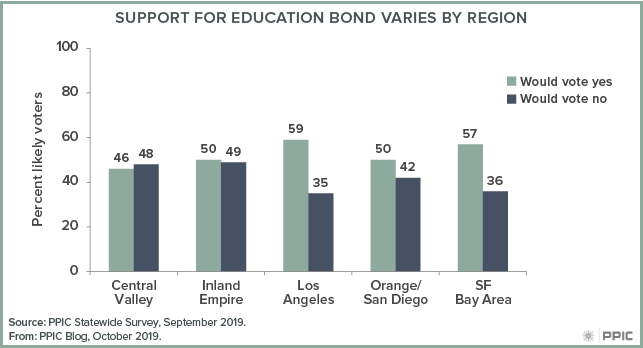
figure - Support for Education Bond Varies by Region

While support is similar among likely voters with (55%) and without (53%) children in the house, there are differences across other demographic groups.

White likely voters (47%) are much less likely than Latinos (74%) and those of other racial/ethnic groups (62%) to say they would vote yes. And since school construction bonds are often paid off by property taxes, it’s notable that homeowners (44%) are far less likely than renters (71%) to say they would vote yes. Support is higher among younger likely voters (66% age 18 to 44, 48% age 45 and older). It declines as education and income levels increase.
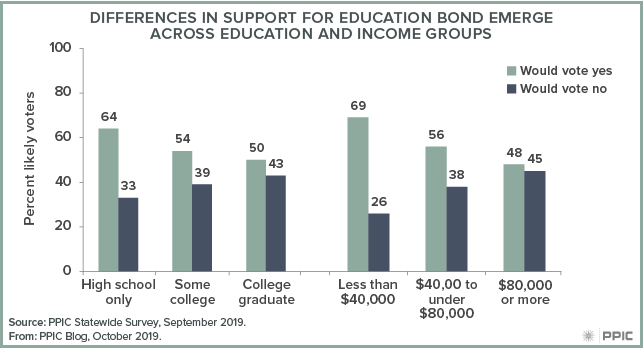
figure - Difference in Support for Education Bond Emerge Across Education and Income Gaps

Overall, support for the education bond currently hovers at around half for likely voters, but there is much stronger support among many regional and demographic groups—suggesting that passage could depend on who shows up to vote. If Democrats and Democratic-leaning independents turn out in large numbers for the presidential primary, that could affect the fate of this bond. Stay tuned to the PPIC Statewide Survey as we continue to track this measure in advance of the March primary.

Approval Ratings in a Hyper-Partisan Era

One of the most surprising findings in our PPIC Statewide Surveys this year has been the consistency of the approval ratings of the California governor and US president during a very eventful year. It’s yet another sign of deep divisions between Republican and Democratic voters—and a split in partisan preferences within the growing ranks of independent (also known as no party preference or NPP) voters in California.

The latest PPIC survey shows Governor Gavin Newsom’s approval rating to be statistically unchanged among California’s likely voters over the course of his first year in office (43% January, 45% March, 47% May, 47% July, 43% September). Despite low unemployment and a multi-billion dollar budget surplus, Newsom’s approval rating is still falling short of 50 percent—even as he has become more widely known.

Meanwhile, President Trump’s approval rating has also held steady in 2019 (36% January, 34% March, 38% May, 38% July, 35% September). Trump’s approval may be low, but it has been rock solid in the wake of numerous controversies and political setbacks, including the current impeachment inquiry.

One of the major contributors to the ceiling on the Democratic governor’s approval rating is his very weak support among Republicans (12% January, 14% March, 13% May, 14% July, 12% September), even while strong majorities of Democrats approve of the job that he is doing (65% January, 68% March, 69% May, 72% July, 68% September).

Similarly, the floor on President Trump’s approval rating is largely explained by overwhelming approval from Republican voters (82% January, 82% March, 84% May, 87% July, 83% September) even while his Democratic support has mostly been in single digits (7% January, 5% March, 8% May, 10% July, 7% September).

Behind these disparate views of two starkly different political figures is a growing inclination to see the world through a highly partisan lens. About seven in ten Republicans now call themselves “strong” Republicans (63% January, 69% March, 72% May, 65% July, 72% September)—up sharply in a decade (55% September 2009). Similarly, about seven in Democrats now say they are “strong” Democrats (69% January, 66% March, 69% May, 60% July, 68% September)—again, much higher than 10 years ago (58% September 2009).

How does hyper-partisanship impact approval ratings? In our latest survey, only 5% of “strong” Republicans approve of the governor, compared to 76% of “strong” Democrats. And 94% of “strong” Republicans approve of the president, compared to just 1% of “strong” Democrats. The “not so strong” Republicans and Democrats give more mixed reviews—but their diminishing ranks means that approval ratings are more polarized and static.

One would expect that the growing number of independent voters—now about a quarter of the California electorate—would be a reliable source of volatility in the governor and president’s approval ratings. But most nonaligned voters are clearly taking sides in the partisan conflict. In our recent survey, we find that most independent likely voters are split fairly evenly between the two parties, with seven in ten saying either that they lean Democrat (36%) or Republican (35%). Of those who lean Republican, 18% approve of the governor while 69% approve of the president. Of those who lean Democratic, 63% approve of the governor while 2% approve of the president.

Most Californians have made up their minds about whom they do and do not trust in government. Many view their federal and state officeholders through party labels rather than ideas and actions. It would take extraordinary circumstances for Governor Newsom to rise much higher in public esteem—or for President Trump to fall much lower.

The emergence of hyper-partisanship has significant implications for California’s democracy. Will California voters be reluctant to cross party lines in the top-two primary in March? Will independent voters continue to side with one of the two major parties or are they open to a third party alternative? Will California’s elected leaders be able to find common ground and bipartisan solutions?

The answers to these questions will have far-reaching impacts on the 2020 election and the future of the state. The PPIC Statewide Survey will continue to track partisanship throughout this highly contentious and consequential time.

Californians Favor Funds for School Construction

With little time to spare, the legislature last week passed a $15 billion school construction bond. A signature from Governor Newsom will place the bond measure—called the Public Preschool, K–12, and College Health and Safety Bond Act of 2020—on the March 2020 primary ballot. Given Californians’ general support for funding education, how do they feel about bond measures for school construction projects?

It’s important to note that the PPIC Statewide Survey has not yet asked Californians about this particular measure, which would provide funding across K–12 and higher education systems. However, we have consistently found that Californians are supportive of bonds for each system individually. (We did not ask about specific dollar amounts.)

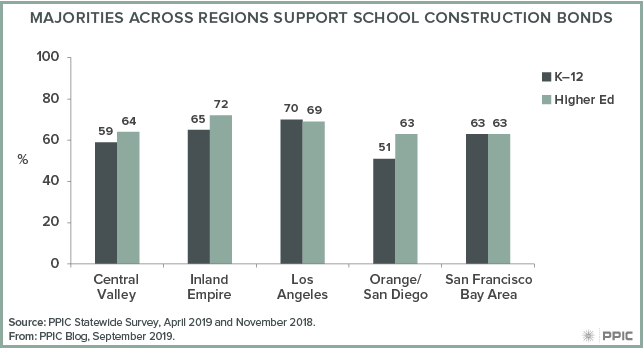
In our April survey, about six in ten adults (62%) and likely voters (57%) said they would vote yes on a bond for K–12 school construction projects, while in November 2018 two in three adults (66%) and about six in ten likely voters (57%) supported a bond to pay for construction projects in California’s public higher education system. In both surveys, there was majority support across regions and demographic groups—except among whites (47%) for the K–12 bond. For both types of bonds, support was lower among whites than other racial/ethnic groups, and support decreased as age and income levels rose.

figure - Majorities across Regions Support School Construction Bonds

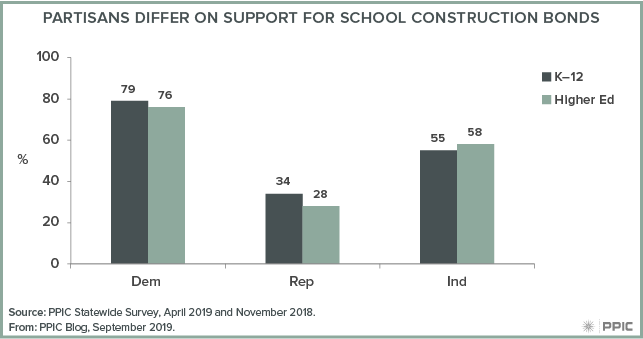
Despite this widespread support for these bonds, we found a significant partisan divide. For both bond questions an overwhelming majority of Democrats as well as smaller majorities of independents have been in favor; far fewer Republicans have been.

figure - Partisans Differ on Support for School Construction Bonds

With California set to play a prominent role in the March Democratic presidential primary—potentially drawing large numbers of Democratic voters—this partisan divide could play a role in passing the bond.

We still don’t know how Californians will perceive this particular bond—in terms of the dollar amount or the joint funding of K–12 and higher education. Stay tuned for more from the PPIC Statewide Survey as we will track support for this bond, as well as many other important 2020 election issues.

Video: Californians and Their Government

Less than a year before California’s presidential primary, likely voters who are Democrats or who lean Democratic are divided on strategy: is it more important for the party to nominate the candidate who seems mostly likely to defeat President Trump or the candidate whose positions align most closely their views? But almost all Californians see voting in the 2020 elections as very important. At a lunchtime briefing in Sacramento last Thursday, PPIC researcher Dean Bonner outlined these and other key findings from the latest statewide survey.

Two in three California likely voters say they will definitely or probably choose a candidate other than Trump. There is a huge partisan divide on this question: 93% of Democrats and 66% of independents would definitely or probably vote for another candidate if the election were held today, while 82% of Republicans would definitely or probably vote for Trump.

Most Californians say that the investigation by special counsel Robert Mueller did not clear the president of wrongdoing, and Californians are more likely that the nation as a whole to say impeachment proceedings should begin. But here, too, there is a partisan divide: 66% of Democrats say Congress should begin the process, compared to only 39% of independents and 9% of Republicans.

Other survey highlights:

  • A majority of Californians say their housing costs cause a financial strain; six in ten favor the governor’s plan to allocate $1 billion to address homelessness, and similar shares favor proposed new rules intended to create more affordable housing.
  • Three-quarters of Californians see participation in the 2020 Census as very important—but most have concerns about confidentiality.
  • An overwhelming majority are concerned about rising electricity bills in the wake of the PG&E bankruptcy.
  • Californians are concerned that the recent outbreak of measles could spread; most believe that vaccines are very safe and an overwhelming majority say vaccination against measles and other diseases should be required.

Californians See Preschool as Important

Early childhood education, a policy priority for Governor Newsom, is viewed as important by an overwhelming majority of Californians. In the April 2019 PPIC Statewide Survey, 78% of Californians and 88% of public school parents said that attending preschool is important to a student’s academic success in kindergarten through grade 12.

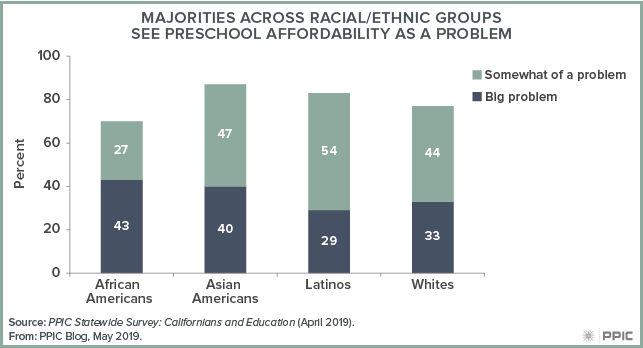
A similar share of Californians (80%) see the affordability of preschool as a problem. Democrats (46%) and Independents (38%) are much more likely than Republicans (25%) to say that it is a big problem. A majority across regions see affordability as a problem, with San Francisco Bay Area residents (42%) most likely to feel that it is a big problem. Across racial/ethnic groups, African Americans and Asian Americans are more likely than whites and Latinos to say that affordability is a big problem.

figure 1 - Majorities across Racial/ethnic Groups See Preschool Affordability as a Problem

Governor Newsom has proposed new funding that would address some of these affordability concerns. In April, we asked Californians if they were in favor of or opposed to the governor’s initial budget proposal from January, which allocated $125 million to expand full-day, full-year preschool to all eligible low-income four-year-olds. A majority of Californians—about two in three adults and three in four public school parents—favored this proposal. In addition, majorities across all demographic groups and regions favored it. In the May budget revision, the proposed funding was reduced to $31 million, which would pay for 10,000 new full-day preschool slots starting April 2020.

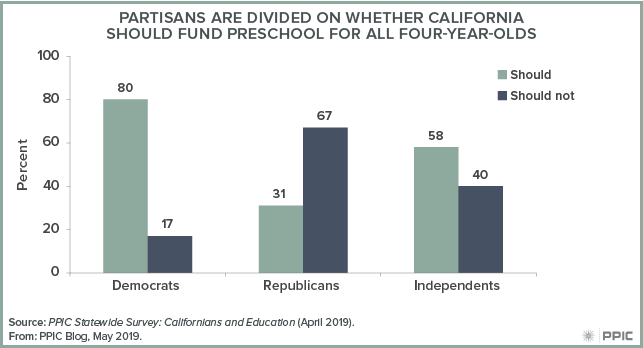
There is slightly less support for state-funded preschool in general: six in ten adults say that the government should fund voluntary preschool programs for all four-year-olds. State-sponsored preschool is a highly partisan issue, with Democrats much more likely than independents or Republicans to express support.

figure 2 - Partisans Are Divided on Whether California Should Fund Preschool for all Four-year-olds

With the release of the governor’s revised spending plan on May 9, the state budget process is well under way; the deadline for enacting the final budget is June 15. PPIC will continue to monitor the governor’s proposed allocations for early childhood education and the opinions of Californians on the issue.

Video: Californians and Education

Last week in Sacramento, Alyssa Dykman outlined the key findings from PPIC’s 15th annual survey on Californians and K–12 education, which tracks opinions on educational quality and school funding. This month’s survey was the first ever to be conducted with a fully online methodology.

A strong majority of Californians want Governor Newsom to prioritize K–12 public education, and majorities support many of the governor’s education-related budget proposals—including the expansion of special education and full-day preschool and kindergarten. Solid majorities also support teacher strikes for higher pay.

But Californians have mixed views on charter schools: most say they are an important option for parents in low-income areas, but many express concern about charters diverting funding from traditional public schools.

Other survey highlights:

  • Most Californians think the level of state funding for local public schools is not adequate.
  • More than half of residents across regions say teacher salaries in their community are too low.
  • Majorities of adults and likely voters would vote for a ballot measure that would amend Proposition 13 to create a “split roll” property tax system and direct some of the revenue to K–12 education.
  • Many parents think the goal of K–12 public education should be to prepare students for college—but many worry about the affordability of a college education.

Is Momentum Growing to End California’s Death Penalty?

On March 13, Governor Newsom signed an executive order placing a moratorium on the death penalty for the 737 inmates on death row in California’s prisons. The order suspends executions for the remainder of Newsom’s administration but does not allow for the release of any inmates or alter any convictions or sentences. California joins Colorado, Pennsylvania, and Oregon as the only states where governors have taken executive action to halt the legal use of the death penalty.

Permanently abolishing California’s death penalty would require voter approval. When this question was on the ballot in 2012 and 2016, a slight majority of Californians (52% in 2012 and 53% percent in 2016) voted to uphold the death penalty as the maximum punishment for those found guilty of first-degree murder.

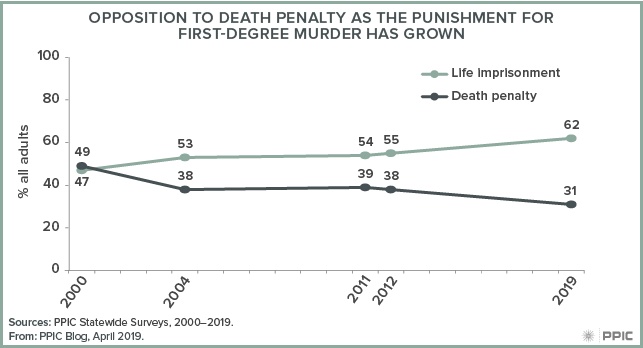
How do Californians view the death penalty today? In our March PPIC survey, a record-high 62% of adults (58% likely voters) prefer life imprisonment with no possibility of parole as the penalty for first-degree murder, compared to 31% of adults (38% likely voters) who prefer the death penalty. The preference for life imprisonment has grown steadily since January 2000, when opinions were divided among Californians (49% death penalty, 47% life imprisonment).

figure - Opposition to Death Penalty as the Punishment for First-Degree Murder Has Grown

The issue is highly partisan: three in four Democrats (76%) and more than half of independents (56%) favor life imprisonment over the death penalty, compared to only one in three Republicans (32%). Since September 2012, when we last asked this question, support for life imprisonment has risen substantially among Democrats (up 9 points) and independents (up 11 points)—but stayed about the same for Republicans (down 1 point).

The preference for life imprisonment has climbed across nearly all age, education, income, and racial/ethnic groups—with the exception of African Americans and Latinos. African Americans are now less likely to favor life imprisonment (67% today versus 75% in 2012), though their support is still high. Among Latinos, 69% prefer life imprisonment, same as in 2012. In contrast, Asian Americans are now much more likely to support life imprisonment (66% today versus 50% in 2012), as are whites (54% today versus 45% in 2012).

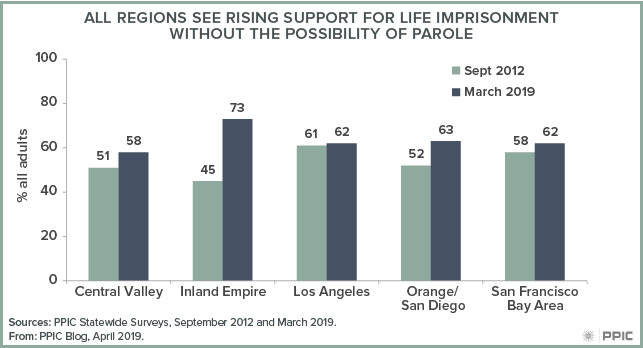
Support has also grown in all major regions of the state, with particularly large shifts in the Inland Empire and Orange/San Diego Counties. In the Inland Empire, 73% of residents favor life imprisonment, up 28 points since 2012. In Orange/San Diego Counties, 63% prefer life imprisonment, up 11 points since 2012.

figure - All Regions See Rising Support for Life Imprisonment Without the Possibility of Parole

Following the governor’s executive order, Assemblymember Marc Levine introduced a constitutional amendment that would abolish the death penalty in California. If approved by a two-thirds vote in the legislature, it will appear before voters on the 2020 ballot. Stay tuned as we continue to monitor Californians’ perceptions and policy preferences on this issue.

Californians Deeply Divided on Leaders—But Show Signs of Optimism

With Governor Newsom and President Trump clashing over policy and federal funding, how do Californians view the two leaders? Our January survey found that opinions of the governor and the president are very different—and very partisan. But while the partisan divide runs deep, Californians are unexpectedly hopeful about overcoming political differences and working together.

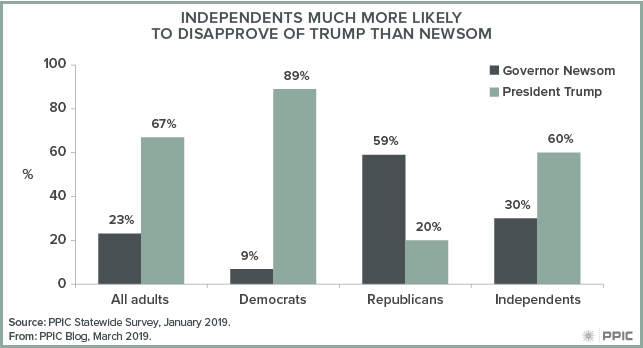
Not surprisingly, newly elected Governor Newsom is far more popular in California than President Trump. Our first reading of Governor Newsom’s approval rating came within the first few weeks of his term. A plurality of Californians said they approve of his job performance, while one in four disapproved and one in three were unsure how to rate him. Meanwhile, three in ten Californians approved of President Trump’s job performance, while two in three disapproved. This question was asked during and after the partial government shutdown in January.

Opinions of both leaders differ widely by party, but President Trump is more polarizing: nine in ten Democrats disapproved of President Trump, while a smaller share of Republicans—six in ten—disapproved of Governor Newsom. Notably, independents were twice as likely to disapprove of President Trump, compared to Governor Newsom.

figure - Independents Much More Likely to Disapprove of Trump Than Newsom

The two leaders couldn’t be in more different positions when it comes to their legislative counterparts. Governor Newsom is working with Democratic supermajorities in both houses, while President Trump has to work with a new Democratic majority in the House of Representatives and a slim Republican majority in the Senate.

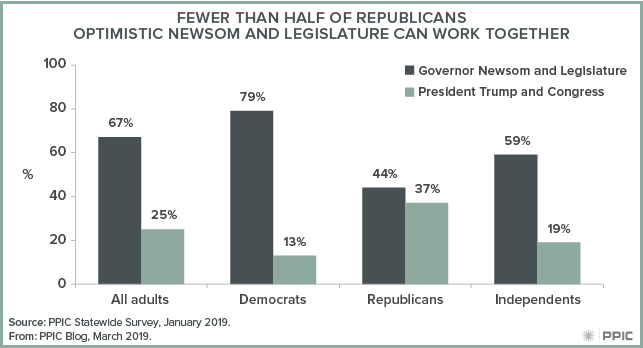
Californians are optimistic that Governor Newsom and the California Legislature will be able to work together and accomplish a lot in the next year. In fact, the share of Californians who are optimistic (67%) is the highest it’s been since we began asking this question in 2006.

In contrast, Californians’ views on the likelihood of cooperation in Washington, DC, are at a record low—with just 25% of Californians optimistic. Notably, Democrats and independents are polarized, while fewer than half of Republicans are optimistic about cooperation at either level.

figure - Fewer Than Half of Republicans Optimistic Newsom and Legislature Can Work Together

Despite the rancorous political environment and the contentious relationship between Governor Newsom and President Trump, most Californians (58%) are optimistic that Americans of different political views can still come together and work out their differences. Notably, about half of Democrats (52%), Republicans (49%), and independents (52%) are optimistic these differences can be overcome. As the governor looks to advance his agenda during his first year in office, we will continue to track Californians’ perceptions of their leaders and monitor attitudes about the state and the nation.

Partisan Loyalty Trumps Gender Solidarity in California

A month until the midterm elections, California’s voters are gearing up for decisions that will have ramifications across the nation. Much has been discussed of a potential “blue wave,” with Democrats eyeing to flip seven Republican congressional seats in California—nearly one-third of the 23 seats needed to shift party control in the US House of Representatives. Concurrently, there are a record number of women running for US Congress and statewide executive offices, including 37 in California. With women comprising 54% of the state’s likely voters, how large a role will they play in the upcoming election?

According to PPIC’s September Statewide Survey, 50% of female likely voters say the upcoming election is more important to them than past midterms; just 3% say it is less important and 46% say it is about the same. Yet when looking at the partisan breakdown among female likely voters there are notable differences: 63% of Democratic women say the upcoming election is more important while 37% of Republican women say the same (sample sizes for independent female likely voters are too small for separate analysis).

In the generic ballot for the US House of Representatives, California’s female likely voters prefer the Democratic candidate over the Republican candidate (58% to 34%). Nearly all partisan female likely voters say they would vote for their own party. When asked about qualities they prefer in a candidate, six in ten Democratic women (60%) prefer those who have experience in politics to those who are new at it, while Republican women are divided (41% experience, 41% new to politics).

Recent prominent events at the national level may impact women’s preferences and turnout in the midterms. Our September survey was fielded following the initial Senate confirmation hearings for Judge Brett Kavanaugh’s appointment to the Supreme Court but prior to the additional hearing on sexual abuse allegations featuring Dr. Christine Blasey Ford. Nonetheless, nearly all female likely voters in our September survey view the choice of the next Supreme Court justice as either very (74%) or somewhat (18%) important to them personally. Across parties, Democratic women are much more likely than Republican women to say the choice is personally very important (82% to 62%).

Meanwhile, President Trump’s approval rating reflects sizable partisan differences among California’s female likely voters: 91% of Democratic women disapprove of the way Donald Trump is handling his job as president, while 80% of Republican women approve.

With women poised to play a pivotal role in the upcoming election, we may see the emergence of a “pink wave” that rivals the “Year of the Woman” associated with the 1992 election. Stay tuned to the PPIC Statewide Survey as we continue to monitor the preferences and attitudes of Californians, with a particular interest in female likely voters, leading up to the midterm.

Single-Payer Health Care and the Governor’s Race

One issue that may prove decisive for Democrats in the 2018 governor’s race is single-payer health care. With the leading Democratic candidates supporting a single-payer system—and the leading Republican candidates in opposition—the race has shed light on the financial, political, and regulatory challenges associated with expanding health coverage across the state.

Last year, the state senate passed a bill (SB 562) that would establish a single-payer health insurance program to cover all Californians. However, the bill was shelved in the state assembly until further notice. According to estimates by the nonpartisan Legislative Analyst’s Office, the bill’s total annual costs would be about $400 billion. Democratic gubernatorial candidates Gavin Newsom and Delaine Eastin have been the most vocal proponents of single-payer health care and have publicly backed the bill. Democratic candidates Antonio Villaraigosa and John Chiang, while supportive of the idea, have expressed concerns over financing and implementation. Both the leading Republican candidates, John Cox and Travis Allen, strongly oppose single-payer health care and have emphasized the need for more competition in the marketplace.

With candidates’ differing positions, how are Californians feeling about single-payer health care today?

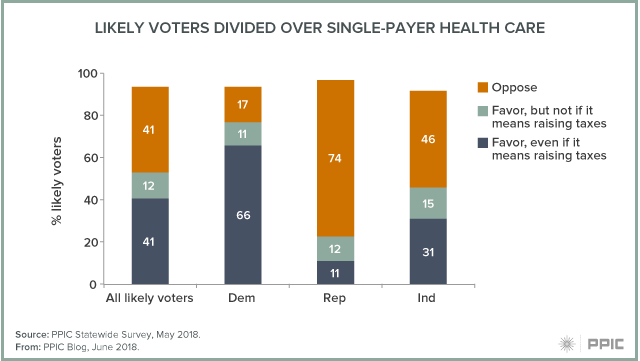
The May PPIC Statewide Survey found a majority of California’s likely voters (53%) favor a single-payer state plan. However, if this plan requires raising taxes, support declines to 41%. Across parties, an overwhelming majority of Democratic likely voters (77%) are in favor, while an overwhelming majority of Republicans (74%) are opposed; independent likely voters are divided (46% favor, 46% oppose). Notably, 66% of Democratic likely voters would favor a single-payer system—even if it means higher taxes.

The issue has become a litmus test for Democrats—pitting progressives against pragmatists—but, overall, Democrats express strong support for a single-payer system. Among likely voters who call themselves strong Democrats, 81% are in favor, compared to 69% who say they are not very strong Democrats. Among likely voters who call themselves strong Republicans, 83% are opposed to a single-payer system (the sample size for those calling themselves not very strong Republicans is too small for analysis).

Given partisan divides, the next governor may face significant political hurdles moving forward with single-payer health care. Coupled with statewide challenges, California would need to collaborate with the federal government to implement such a system. In consideration of these factors, the June primary is an opportunity for Californians to determine their future leadership and the state’s policy directions—including a possible step toward single-payer coverage.