Primary Takeaways: Democracy Is Alive and Well in California

With the release of the official Statement of the Vote, the final tally is in for the 2018 California primary. The election outcomes are encouraging news for California’s democracy—especially in light of criticisms of the top-two primary system by the national media. Several important statewide trends stand out:

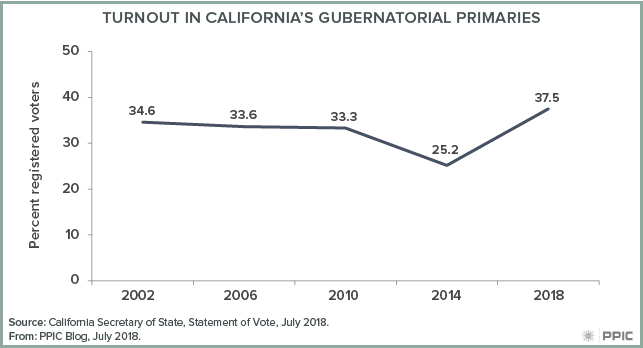
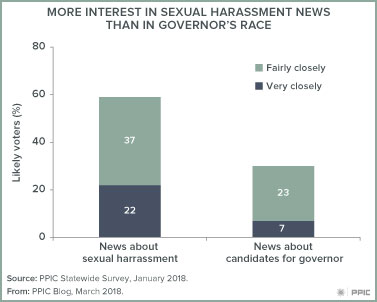
  • Strong political participation. A record-setting 19 million Californians—75.7% of eligible adults—were registered to vote in the gubernatorial primary. This threshold has not been reached since the middle of the 20th century. Moreover, the 7.14 million voters who cast ballots is an all-time high for a gubernatorial primary and, at 37.5% of registered voters and 28.4% of eligible adults, the turnout rates are the highest reported in the five gubernatorial primaries since 2000. Since his election four years ago, California Secretary of State Alex Padilla has been on a mission to make it easier for Californians to register to vote and cast ballots, and the efforts seem to be working. The May PPIC survey found that likely voters’ attention to election news was relatively high, so credit also goes to the media for stoking interest in political participation.

  • More independent voters. Many Californians are responding to the hyper-partisanship of national politics by eschewing the major parties and registering as independents (also known as NPP for “No Party Preference”). In June’s election, for the first time in the state’s history, NPP voters outnumbered Republican voters (25.5% to 25.1%). In the past four years, the number of NPP voters increased (+1,103,602) more than the number of Democratic voters (+745,598), while Republican ranks shrunk (-267,311). The makeup of the June ballot reflected the political clout of NPP voters. Four of the statewide races included NPP candidates, giving voters some nonpartisan choices they did not have under the previous primary system. And in a first for the general election, the top two candidates for insurance commissioner are a Democrat and an NPP candidate (formerly a member of the Republican Party).
  • Diverse statewide candidates. After much consternation about the likelihood of a single-party race at the top of the ticket, five of the eight partisan races—including the governor’s—feature a Democrat running against a Republican. Except for the governor’s race, the top-two primary results offer a diverse pool of candidates to choose from in the fall, at least among Democratic options. The US Senate election and the seven down-ticket races include five Latinos, four women, two Asian Americans, and one African American. Also, eight of the nine statewide races—including the governor’s—are contests between Northern and Southern Californians. While many Republicans are likely to skip voting in a US Senate race with two Democratic candidates, as they did in November 2016, a Democratic-only race for the open lieutenant governor seat will be closely watched for signs of cross-party voting.
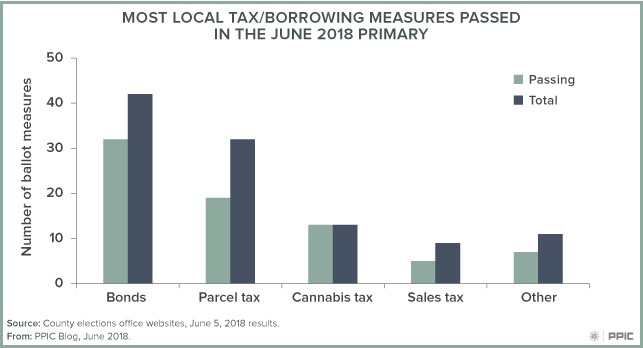
  • Popular state ballot measures. Four of the five state propositions placed on the June primary ballot by the legislature passed. This is consistent with the historically high pass rate for legislative ballot measures. With the legislature’s approval holding steady and at a relatively high level in the May PPIC survey, the four state propositions each passed by healthy margins—including a 58% “yes” vote for the state water and parks bond. The latter results bode well for the state housing bonds passed by the legislature and placed on the November ballot. (Citizens’ initiatives appear only on the November general ballot.)

The main takeaway from the June primary is that the vital signs of California’s democracy are healthy. In the wake of California’s many election reforms, records may be shattered in the numbers of registered voters and ballots cast this fall—and throughout the 2020s. The top-two primary system may have its quirks, but it is well suited for the burgeoning number of NPP voters. NPP candidates have found a home in the top-two primary, an NPP will be on the fall ballot, and there will likely be NPP statewide officeholders in the future. The fears about major party voters feeling left out of the fall election were overblown, and most top two candidates reflect the state’s diversity. Positive responses to the June ballot measures suggest an easy time for the state propositions from the legislature this fall; the fate of the nine citizens’ initiatives—including a repeal of the recent gas tax increase—is currently less clear.

At PPIC, the race for governor, US senator, and superintendent of public instruction stand out as uniquely worthy of public attention. We have invited the two candidates in each race to participate in conversations with me about the future of California. Stay tuned for more information about these public events. Meanwhile, throughout the fall the PPIC Statewide Survey will focus on the governor’s race, the US Senate election, and the congressional races—as well as the gas tax repeal and other state propositions that impact our future. We look forward to informing discussions and raising awareness about the importance of this consequential election for the state and nation.

Funding Measures and the June Ballot

Last week’s primary election garnered considerable statewide and national attention, with much of the focus on the governor’s race and contested congressional seats. Further down the ballot, however, voters were asked to decide on millions of dollars of local tax, bond, and fee initiatives. On the whole, these measures enjoyed considerable success across the state.

We found that Californians voted on 107 local tax, bond, and fee measures, representing the range of fiscal tools that local jurisdictions can use to raise revenue and borrow funds. Bond measures were the most popular, with 42 different local governments seeking voter approval (37 K–12 school districts; 2 community college districts; 3 cities). There were also 32 parcel tax measures; those related to K–12 schools (12) and fire/public safety (10) were most common. Ballots also included proposals to impose or increase taxes on cannabis (13) general sales (9), gross business receipts (2), and hotel stays (3). And there were proposals to raise utility fees (3), business license fees (1), and bridge tolls (1).

Most of the long list of funding proposals passed—but just putting a measure on the ballot did not guarantee success. Although counties are still counting some ballots, which could affect a race or two, at this time, we observe the following:

  • Overall, voters passed 76 of the 107 measures.
  • Of the 39 school bond measures, 30 passed. Proposition 39, passed in 2000, lowered the threshold for passing school bonds from a two-thirds majority to 55%. Had these measures been subjected to the previous standard, only 11 would have passed. The 19 measures approved under the current standard increased borrowing for investment in public schools by $1.8 billion.
  • On the heels of one of the states’ worst seasons of wildfires on record, California voters held the line on parcel taxes intended to support fire protection, with only 3 of the 9 measures passing.
  • All 13 of the cannabis tax proposals passed overwhelmingly.

California touched off a revolt against taxes 40 years ago. Primary voters in 2018 generally voted for increases but were relatively discriminating in their support, depending upon the type of tax and its intended purpose. This discernment comes at a time when the state’s economy is growing and unemployment is low. It will be interesting to see what happens in November, when we expect to see even more funding measures on the ballot.

A Preview of the California Governor’s Election

The people have spoken and the November election for governor has been decided: Democrat Gavin Newsom will face off against Republican John Cox. Let’s look at recent PPIC surveys to help us understand the determining factors of this outcome and the political dynamics that will surface in this fall’s matchup.

In the weeks before the June primary, the May PPIC survey found that Newsom was his party’s favorite in a race with the four major Democratic contenders, while Cox was his party’s top choice in a contest between the two major Republican contenders. The election results confirmed these trends in the voting patterns of red and blue counties. What is it about these candidates that was attractive to their bases?

The primary results were foreshadowed in a January PPIC survey. When likely voters were asked about the qualifications that they are looking for in a candidate for governor, most Democrats (84%) said they wanted a candidate with experience in office, while most Republicans (65%) preferred a candidate with experience running a business. The party faithful chose the person who arguably fit their profile best—Lieutenant Governor Newsom and businessman Cox. While California likely voters favor elected experience to business experience by a wide margin (62% to 31%), the fall election will focus on issues where opinions are more divided. This suggests a more competitive race than one might expect in deep blue California.

The November gubernatorial election is set in a midterm-election context perceived as a referendum on President Donald Trump and the Republican-led Congress. John Cox is endorsed by President Trump while Gavin Newsom is a vocal member of the Trump resistance. Democrats hope to flip several of the House seats held by California Republicans so that their party can take control of Congress. This election comes at a time when independents are now the second largest voter group at 4.9 million (SOS, June 1).

Slim majorities of California likely voters also say they would vote for the Democratic candidate over the Republican candidate in their House district races in both the March PPIC survey (53% to 39%) and in the May PPIC survey (52% to 38%). Democrats strongly preferred the Democratic candidate (92% March, 91% May) and Republicans strongly favored the Republican candidate (87% March, 86% May) while, again, independents are divided (Democrats: 37% March, 43% May). The independents’ turnout and leanings will thus be a focal point in House races—another reason this voter group is the wildcard in November.

What else will Californians need to know about the two candidates? In the PPIC January survey, 60% of likely voters rank the candidates’ stands on the issues above several traits: experience (17%), character (16%), and political party (6%). Likely voters most often name the economy, immigration, and housing costs as their top issues in the May PPIC survey. Eighty-two percent of likely voters say that the candidates’ performances in public debates will be important in determining their vote for governor.

PPIC has invited the two gubernatorial candidates to participate in a public conversation with me about the issues, their leadership, and vision for California. Stay tuned for more information about when and where it will take place, and how you can attend or watch this special PPIC event.

Commentary: California’s Top-Two Primary, Explained

This commentary was published in the Washington Post on June 6, 2018.

The California governor’s race and all its key House races will feature a Democrat against a Republican in the fall campaign. What would normally be an unremarkable statement counts as breaking news for California.

Read the full commentary on washingtonpost.com.

Single-Payer Health Care and the Governor’s Race

One issue that may prove decisive for Democrats in the 2018 governor’s race is single-payer health care. With the leading Democratic candidates supporting a single-payer system—and the leading Republican candidates in opposition—the race has shed light on the financial, political, and regulatory challenges associated with expanding health coverage across the state.

Last year, the state senate passed a bill (SB 562) that would establish a single-payer health insurance program to cover all Californians. However, the bill was shelved in the state assembly until further notice. According to estimates by the nonpartisan Legislative Analyst’s Office, the bill’s total annual costs would be about $400 billion. Democratic gubernatorial candidates Gavin Newsom and Delaine Eastin have been the most vocal proponents of single-payer health care and have publicly backed the bill. Democratic candidates Antonio Villaraigosa and John Chiang, while supportive of the idea, have expressed concerns over financing and implementation. Both the leading Republican candidates, John Cox and Travis Allen, strongly oppose single-payer health care and have emphasized the need for more competition in the marketplace.

With candidates’ differing positions, how are Californians feeling about single-payer health care today?

The May PPIC Statewide Survey found a majority of California’s likely voters (53%) favor a single-payer state plan. However, if this plan requires raising taxes, support declines to 41%. Across parties, an overwhelming majority of Democratic likely voters (77%) are in favor, while an overwhelming majority of Republicans (74%) are opposed; independent likely voters are divided (46% favor, 46% oppose). Notably, 66% of Democratic likely voters would favor a single-payer system—even if it means higher taxes.

The issue has become a litmus test for Democrats—pitting progressives against pragmatists—but, overall, Democrats express strong support for a single-payer system. Among likely voters who call themselves strong Democrats, 81% are in favor, compared to 69% who say they are not very strong Democrats. Among likely voters who call themselves strong Republicans, 83% are opposed to a single-payer system (the sample size for those calling themselves not very strong Republicans is too small for analysis).

Given partisan divides, the next governor may face significant political hurdles moving forward with single-payer health care. Coupled with statewide challenges, California would need to collaborate with the federal government to implement such a system. In consideration of these factors, the June primary is an opportunity for Californians to determine their future leadership and the state’s policy directions—including a possible step toward single-payer coverage.

The Top Two and Turnout in California’s Primary

California voters face many decisions on a long and crowded June 5 primary ballot. None will be more closely watched than the choices made in the top-of-the-ticket governor’s race that will determine the top two candidates in the November election runoff. Six candidates—four Democrats and two Republicans—have been serious contenders in this race. In the May PPIC Survey, Democrat Gavin Newsom continues to lead the pack, with little separation between Republican John Cox and Democrat Antonio Villaraigosa for the coveted second-place finish. It’s a toss-up if the gubernatorial race will include two Democrats or a Democrat and a Republican. Why does this matter so much?

It is likely that a Democratic candidate will prevail—no Republican has won a statewide election since 2006. Since then, the gap in partisan registration has ballooned to 19 points (44% Democrat, 25% Republican; Secretary of State, April 2018). The issue today is turnout. The partisan makeup of this November’s electorate has consequences for the Democrats’ efforts to flip several Republican House seats in competitive California districts (Cook Report, May 10) to gain party control of the US Congress. Without a candidate at the top of the ticket, Republicans have one less reason to vote.

Californians have warmed up to the current gubernatorial contest. The May PPIC Survey finds that likely voters’ interest in news about the gubernatorial candidates has almost doubled since January (30% to 58%). Equal proportions of likely voters across parties are very or fairly closely following election news today (58% Democrats, 61% Republicans, 60% independents). Moreover, likely voters’ satisfaction with the candidate choices has grown since January (54% to 64%)—especially among Republicans, who were the least satisfied earlier this year. Majorities of likely voters across parties are now satisfied with their choices (74% Democrats, 60% Republicans, 55% independents). In addition, more likely voters have found a candidate to support for governor since January (76% to 85%), and by similarly large margins across parties (86% Democrat, 86% Republican, 81% independent) today. Democratic pluralities are favoring Newsom, Republican pluralities are supporting Cox, and independents are dividing their support across two parties and four candidates.

By contrast, we need to look no further than the US Senate primary to foreshadow the impact of a one-party governor’s contest this fall. Democratic US Senator Dianne Feinstein is on the ballot with Democratic California State Senator Kevin de León. There are no major candidates from the Republican ranks in this race. In the May PPIC Survey, likely voters’ satisfaction with senate candidate choices (50%) is much lower than in the governor’s race (64%), with vastly different satisfaction levels across parties (74% Democrat, 27% Republican, 38% independent). More importantly, fewer voters have found a candidate to support in the senate race (64%) than in the governor’s race (85%), and this trend is especially pronounced among the GOP likely voters (87% Democrats, 41% Republicans, 53% independents) today.

The top-two system was created in 2010 to encourage the growing ranks of independent voters to participate in the June primary. Third parties countered that their voters would be shut out of the November election, an outcome that has largely proven true. With the dwindling ranks of Republicans today, another flaw that impacts the two-party system has surfaced—lack of participation from those feeling unrepresented on the ballot. And with deepening partisan divisions in the country, voters cannot be counted on to cross party lines and choose a candidate from outside their ranks. Republicans face an unprecedented obstacle of unknown proportions if a one-party governor’s race depresses their turnout. In the long run, California’s democracy has a bigger problem if many voters are feeling disenfranchised by the top-two primary results and choose not to participate in a statewide election. To fully assess the significance of these issues, PPIC surveys will continue to track voter interest, candidate satisfaction, and ballot choices in this consequential election.

Video: California Primary Preview

In the run-up to California’s June 5 primary, Democrat Gavin Newsom remains the top choice among likely voters in the governor’s race, according to the latest PPIC poll. Republican John Cox is in a close race with Democrat Antonio Villaraigosa to gain the second spot on November’s general election ballot. Senator Dianne Feinstein holds a wide lead over fellow Democrat Kevin de León.

Dean Bonner, PPIC associate survey director, detailed these findings and more at a recent Sacramento briefing.

The survey shows Newsom (25%) leading among likely voters, followed by Cox (19%), Villaraigosa (15%), Republican Travis Allen (11%), and Democrats John Chiang (9%) and Delaine Eastin (6%). Fifteen percent of likely voters are still undecided. Results were similar in an April PPIC poll (26% Newsom, 15% Cox, and 13% Villaraigosa). Cox’s support has more than doubled since the January (7%) PPIC poll.

Other highlights of the survey include:

  • A majority of likely voters (63%) favor Governor Brown’s final budget, and overwhelming majorities like his idea of additional one-time spending on infrastructure, homelessness, and mental health programs.
  • Immigrants are viewed as a benefit to the state by a majority of likely voters (67%) because of their hard work and job skills. The vast majority (80%) favor a way for undocumented immigrants to stay in the US legally—if certain requirements are met.
  • Californians are divided on the motivation of the Russia investigation, but a strong majority of likely voters (74%) think the Russian government tried to influence the outcome of the 2016 presidential election.
  • Californians distrust both the state and federal government—just 18 percent of likely voters say you can trust Washington to do what’s right.

California’s Immigrants and the 2018 Election Context

This piece is excerpted from a presentation at the USC Annenberg School for Communication and Journalism given on March 30, 2018, in Los Angeles.

Many eyes will be on California in this midterm election year, especially since control of Congress may hinge on the outcome of 10 competitive House races in the Golden State. Currently, more than a quarter of the state’s residents are born outside the US—and one in five immigrants make up what we consider likely voters in California elections. With federal immigration policy playing a lead role in today’s polarized political discussions, will California’s immigrants have an impact—and to who’s advantage—in the 2018 election?

Typically, California’s immigrants are less interested in politics than their US born counterparts. But not when it comes to the 2018 election cycle. Among likely voters in our current survey, immigrants and nonimmigrants are similarly likely to be following the news about gubernatorial candidates “very” or “fairly” closely (51% immigrants, 48% US born). Both groups say that voting this year is more important than in past midterm elections (47% immigrants, 51% US born). Perhaps most telling for this year, both likely voter groups mention immigration and illegal immigration when asked about the issue that they would most like to hear the gubernatorial candidates talk about before the June primary (23% immigrants, 23% US born).

When it comes to current candidate choices, we do see some divergence between immigrant and US-born likely voters:

  • Democrat Gavin Newsom slightly trails Democrat Antonio Villaraigosa among immigrants (17% to 23%), while he is favored by three to one over Villaraigosa among nonimmigrants (30% to 9%).
  • Republican John Cox does equally well with both groups (15% immigrants, 14% US born).
  • Democrat Dianne Feinstein is favored by large margins over Democrat Kevin de León both among immigrants (50% to 18%) and nonimmigrants (40% to 16%). She has a higher approval rating among immigrants than nonimmigrants (68% to 51%).
  • Immigrants are more likely than nonimmigrants to favor the Democratic candidates in their local House races (63% to 51%) and less likely to favor the Republican candidates (30% to 41%). Immigrants also give higher approval ratings than nonimmigrants to their current local House member (59% to 51%).

Despite these differences, immigrant and nonimmigrant Californians are aligned in their views of the current policy landscape. Majorities in both likely voter groups disapprove of President Donald Trump (63% immigrants, 60% US born), oppose the new federal tax law (65% immigrants, 56% US born), want gun laws to be stricter (82% immigrants, 67% US born), and oppose building a wall along the entire border with Mexico (71% immigrants, 60% US born). When it comes to state and local governments making their own policies and taking action separate from the federal government, majorities in both likely voter groups say they are in favor of protecting the legal rights of undocumented immigrants (66% immigrants, 52% US born).

One of the political wildcards in this California mid-term election is whether the strong opposition to federal immigration policy will motivate more naturalized citizens to vote and more noncitizens to become citizens and register to vote. As noted earlier, immigrants make up a larger share of the state’s population than is reflected in the likely voter group—leaving much room for growth that could transform the state’s electorate. The PPIC Statewide Survey will be closely monitoring the trends in political engagement and ballot choices in this consequential election for California and the nation.

Video: Preview of the California Primary

As California’s June 5 primary approaches, the latest PPIC survey finds Democrat Gavin Newsom gaining ground over Antonio Villaraigosa in the governor’s race, while support for Republican John Cox rises among likely voters. In the US Senate race, Dianne Feinstein holds her double-digit lead over fellow Democrat Kevin de León.

Dean Bonner, PPIC associate survey director, detailed the findings at a Sacramento briefing last week.

The survey shows Newsom (28%) as the top choice among likely voters, followed by Cox (14%), Democrat Villaraigosa (12%), Republican Travis Allen (10%), and Democrats John Chiang (6%) and Delaine Eastin (5%). Yet a quarter of likely voters are still undecided, which raises questions about what will happen in the top-two primary.

A few other highlights include:

  • Governor Jerry Brown’s approval rating (54%) has held steady, despite state-federal tension over immigration policy. The legislature’s approval rating (45%) has also stayed consistent, in spite of sexual misconduct reports last fall.
  • The top issue voters would like gubernatorial candidates to talk about before the June primary is immigration, followed by guns or school safety.
  • Nearly half of Republicans (48%) are now joining an overwhelming number of Democrats (87%) and independents (68%) in saying there should be stricter gun controls.
  • Bipartisan support emerged for a water bond measure, with two-thirds of likely voters saying they would vote yes. Partisans were more divided on affordable housing projects.

Californians and Sacramento’s Handling of Misconduct

During fall 2017, the #MeToo movement took the entertainment, sports, and business worlds by storm. Statehouses across the nation were also affected. Here in California, allegations of sexual harassment came to light and have led to resignations, including the recent resignation of State Senator Tony Mendoza, who was on the precipice of a formal expulsion vote. No member of the California Legislature has been expelled since 1905.

In our January survey, prior to this latest development, we found that nearly half of Californians are following news about sexual harassment and misconduct in the state legislature very (18%) or fairly (28%) closely. Women (49%) and men (43%) are similar in how closely they were following the news.

Interest in this topic is bipartisan: most Democrats (56%) and Republicans (56%) are closely following this story. However, Democrats are about twice as likely to be following it very closely.

Interest is also widespread: more likely voters (59%) are closely following news about sexual harassment than about candidates for governor (30%).

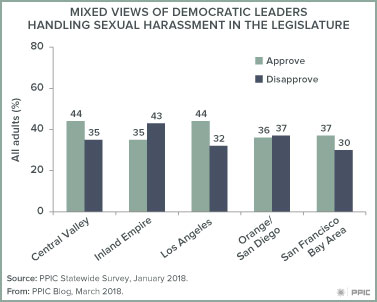
How are Democratic leaders handling the issue of sexual harassment in the statehouse? Californians’ opinions are divided (39% approve, 36% disapprove), with 25 percent unsure. Notably, women (40% approve) and men (38% approve) hold similar views. Similarly, fewer than half of Californians across regions and age, education, income, and racial/ethnic groups approve of the way Democratic leaders are handling the issue. Not too surprisingly, Democrats (52%) are nearly twice as likely as independents (28%) and three times as likely as Republicans (18%) to approve.

So far, the issue of sexual harassment in Sacramento hasn’t played a large role in the primary races. Stay tuned to see if that changes as the June election draws closer.