How Strong Is the Trump Effect in California?

Was the 2016 presidential election a sign of things to come—presaging an ever-bluer California? Or was it a one-off result driven by the personalities of the candidates?  These are important questions in California, which voted more Democratic for president in 2016 than it had in 2012, even as the rest of the country moved in the opposite direction.  Even more important, parts of the state that had been reliably Republican—most notably Orange County—suddenly shifted Democratic. Based in part on this result, California’s Democratic candidates fought hard in yesterday’s midterm for several US House seats held by Republicans.

Did the anti-Trump/pro-Clinton vote reliably predict the 2018 outcome? To answer this question, the figure below compares California’s 2016 presidential vote to the 2018 US House vote in all districts with both a Democrat and a Republican running. The solid black diagonal line marks the point where the 2016 presidential vote perfectly matches the 2018 US House vote. Points above the line mark seats where the Democrats outperformed the 2016 presidential vote, and points below show where they underperformed. The competitive seats mentioned above are identified in orange.

The first thing to note is that the 2016 presidential vote predicts the 2018 US House vote quite well.  Higher Democratic presidential votes reliably translate into higher Democratic House votes, so knowing the presidential vote tells us a lot about how a district is going to vote for other offices. This is true even for the competitive races in which the 2016 presidential vote was a surprise.

At the same time, virtually every seat falls below the solid diagonal line. That means the Democratic House candidates in these districts consistently failed to match the support shown for Hillary Clinton in 2016. Though the Democrats are poised to pick up at least three House seats in California, support for the Democratic Party is softer in these races than it was two years ago.

On balance, however, the 2016 outcome was not a one-off:  the areas that voted more Democratic than expected are continuing to vote more Democratic.  At the same time, Democrats would have picked up more seats in the midterm had the US House vote this cycle matched the 2016 presidential vote exactly. Despite what was generally a good Democratic night, the overall outcome fell short of the 2016 benchmark.
Election Day Matters

It’s Election Day, and voters across the nation are choosing their leaders at a divided and contentious time. Although Californians are divided on many issues today, majorities of voters across party lines say they are more enthusiastic about voting than usual this year (October PPIC survey: 72% Democrats, 64% Republicans, 53% independents). This is welcome news after a 2014 statewide election that set a new record for the lowest voter turnout. It will be interesting to see how many Californians will actually follow through and cast their ballots for governor, state constitutional officers, and state legislators.

Who will vote in the California election will be closely watched on election night since a handful of House races may well determine the party in control of the next US Congress. Democrats seem more energized than Republicans in voting for Congress this year (October PPIC survey: extremely/very enthusiastic: 57% Democrats, 40% Republicans, 35% independents). However, we also find an “enthusiasm gap” that favors white, older, and more affluent Californians who tend to be conservative voters. This raises questions about whether there will be a “blue wave” or merely a ripple this year.

In addition to electing their leaders, California voters play an outsize role in policymaking in our state. In another striking area of agreement across party lines, most Californians say that they like the initiative process and feel they make good decisions at the ballot box—despite reservations about the number and complexity of ballot measures. Because of the central role the initiative process plays in California policymaking, voters have a special obligation to weigh in on important choices facing the state. This election, Californians will vote on 11 state propositions, in addition to numerous local measures.

Still, many Californians who are eligible do not vote. We’ve found significant gaps between voters and non-voters in the state. Voters are much more likely to be older, white, and own their homes. They have higher education and income levels. And they are more likely to identify as one of the “haves” than the “have nots.” This means that important policy choices that affect the entire population are determined by voters who do not necessarily reflect the state’s social, political, or economic diversity.

The state has implemented several reforms to ease access to registration and voting, many of them quite recently. The jury is still out on the long-term effects of these efforts, but one thing is sure: voting matters. Elections have the power to change the direction of history.

So on this Election Day, it is critical for all eligible Californians to exercise their right to vote. For anyone in need of last-minute help on ballot choices, solid nonpartisan information is available in the state’s voter guide.

PPIC is keeping a close eye not only on the immediate outcome of the vote, but also on long-term trends and implications. Stay tuned to the PPIC blog for post-election thoughts and analysis of this year’s important midterms.

California’s Immigrants and the 2018 Election Context

This piece is excerpted from a presentation at the USC Annenberg School for Communication and Journalism given on March 30, 2018, in Los Angeles.

Many eyes will be on California in this midterm election year, especially since control of Congress may hinge on the outcome of 10 competitive House races in the Golden State. Currently, more than a quarter of the state’s residents are born outside the US—and one in five immigrants make up what we consider likely voters in California elections. With federal immigration policy playing a lead role in today’s polarized political discussions, will California’s immigrants have an impact—and to who’s advantage—in the 2018 election?

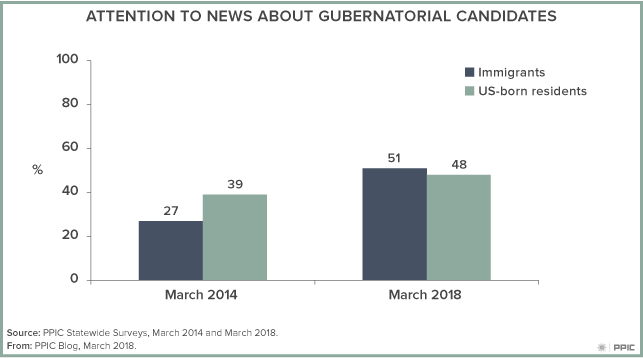
Typically, California’s immigrants are less interested in politics than their US born counterparts. But not when it comes to the 2018 election cycle. Among likely voters in our current survey, immigrants and nonimmigrants are similarly likely to be following the news about gubernatorial candidates “very” or “fairly” closely (51% immigrants, 48% US born). Both groups say that voting this year is more important than in past midterm elections (47% immigrants, 51% US born). Perhaps most telling for this year, both likely voter groups mention immigration and illegal immigration when asked about the issue that they would most like to hear the gubernatorial candidates talk about before the June primary (23% immigrants, 23% US born).

When it comes to current candidate choices, we do see some divergence between immigrant and US-born likely voters:

  • Democrat Gavin Newsom slightly trails Democrat Antonio Villaraigosa among immigrants (17% to 23%), while he is favored by three to one over Villaraigosa among nonimmigrants (30% to 9%).
  • Republican John Cox does equally well with both groups (15% immigrants, 14% US born).
  • Democrat Dianne Feinstein is favored by large margins over Democrat Kevin de León both among immigrants (50% to 18%) and nonimmigrants (40% to 16%). She has a higher approval rating among immigrants than nonimmigrants (68% to 51%).
  • Immigrants are more likely than nonimmigrants to favor the Democratic candidates in their local House races (63% to 51%) and less likely to favor the Republican candidates (30% to 41%). Immigrants also give higher approval ratings than nonimmigrants to their current local House member (59% to 51%).

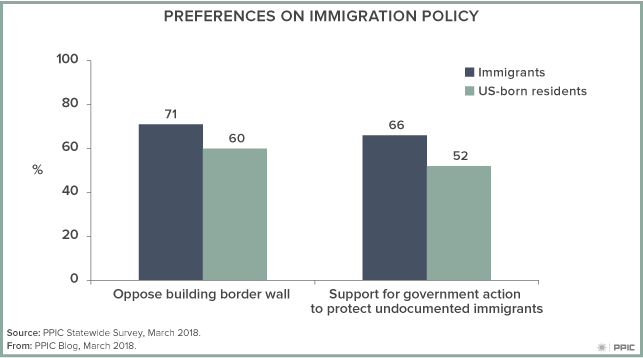
Despite these differences, immigrant and nonimmigrant Californians are aligned in their views of the current policy landscape. Majorities in both likely voter groups disapprove of President Donald Trump (63% immigrants, 60% US born), oppose the new federal tax law (65% immigrants, 56% US born), want gun laws to be stricter (82% immigrants, 67% US born), and oppose building a wall along the entire border with Mexico (71% immigrants, 60% US born). When it comes to state and local governments making their own policies and taking action separate from the federal government, majorities in both likely voter groups say they are in favor of protecting the legal rights of undocumented immigrants (66% immigrants, 52% US born).

One of the political wildcards in this California mid-term election is whether the strong opposition to federal immigration policy will motivate more naturalized citizens to vote and more noncitizens to become citizens and register to vote. As noted earlier, immigrants make up a larger share of the state’s population than is reflected in the likely voter group—leaving much room for growth that could transform the state’s electorate. The PPIC Statewide Survey will be closely monitoring the trends in political engagement and ballot choices in this consequential election for California and the nation.

California’s Voter Turnout Problem

Voter turnout in California’s 2014 midterm election was awful. It looks to have hit a new low, with about 42 percent of registered voters deciding to cast a ballot. The previous low came in a 2002 race between Bill Simon and Gray Davis that everyone at the time agreed marked a low point for engagement and interest.

But are these numbers really so bad? Can we put them in some broader context that makes them look better? We can try, but it turns out that when we do, it only makes them look worse.

First, turnout as a share of registered voters tells only half the story. It ignores all the Californians who were legally eligible to vote but didn’t even bother to get registered in the first place. If we’re worried about citizen engagement, then ignoring these people is a problem. When they are included in the calculation, turnout drops to 31 percent—5 percentage points below the previous low and 17 points below the average for midterm elections since 1922.

The problem is still more dire when we stack California against the rest of the country. The graph below shows midterm turnout among eligible voters in California and the United States as a whole (the U.S. numbers come courtesy of Michael McDonald and his United States Elections Project).

As the graph indicates, national turnout was low this year (about 36%), but it wasn’t too far out of line with the trend since the 1970s, which has been a little low but flat. California’s midterm turnout, by contrast, has been in a fairly steady decline since the mid-1950s. Our recent turnout is 5 points below the national number, despite the fact that many other states did not have any statewide election (and the national average includes California itself).

Before we conclude this is a California problem, it’s useful to see the same graph for presidential elections.

It looks about the same—fairly flat national turnout and falling California turnout since the 1970s—until roughly the last 20 years. During this most recent period, California’s decline has stopped, and turnout in both California and the nation has even increased a little.

Taken together, these graphs rule out some explanations. The problem is not California’s political reforms like the redistricting commission or the top-two primary, because the gubernatorial decline predates those changes (which came in 2012). But it’s not something immutable about California, either, because it’s nothing a few exciting presidential elections can’t fix. In fact, what’s interesting is how good California’s turnout used to be compared to the rest of the country, and therefore how new it is to have a California with turnout that is actually below the national average.

To get at the answer, we will need to understand what has been different about recent presidential elections in California, and why higher turnout for them has not extended to gubernatorial races. Is turnout decline the natural state of things, from which presidential contests have departed? Or is higher turnout the more reasonable expectation, from which gubernatorial turnout is an aberration? Both accounts seem reasonable, but it’ll take further study to pull the two apart.