New Housing Permits Decline Statewide

The first half of 2019 saw a substantial decline in the number of new housing units authorized by building permits. This has heightened concern about the state’s housing crisis and cast doubt on whether Governor Newsom’s goal of adding 3.5 million new housing units by 2025 can be met. More importantly, it underlines the need for a deeper understanding of housing markets and what if any action can be taken at state and local levels to move the needle.

New construction has been falling short of demand for many years. Estimates from Beacon Economics put the backlog at about 2.3 million housing units in 2017. In 2018, only 104,000 residential permits were issued—this was well below the pre-recession permitting peak and left the state far below the number of new homes needed.

According to state housing officials, California needs an average of 180,000 new homes every year to make up for current deficits and accommodate future population growth. This number is not unattainable: an average of 200,000 units were permitted each year from 2003 to 2005. However, today the statewide numbers are moving in the wrong direction. In June 2019, residential permits were down 38% compared to June 2018. On an annualized basis, permits were down 16%, totaling about 93,000. Permits for multi-family units decreased even more sharply, by 23%; only 44,400 were issued.

figure - After Rising for Several Years, New Home Construction Permits Statewide have Dipped

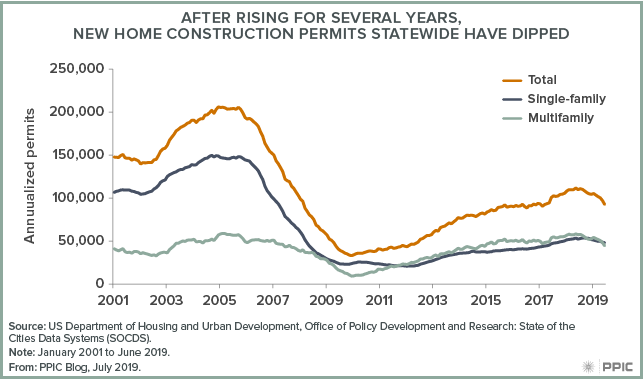
Housing markets and new construction vary widely across the state. In San Mateo, San Diego, Ventura, and Alameda Counties, the number of permits decreased by at least 30%. Meanwhile, in San Francisco and Sonoma Counties permits increased by 66% and 47%, respectively. Part of the increase in Sonoma County is related to the replacement of homes lost during the 2017 wildfire.

This year’s state budget includes $1.75 billion for the construction of new homes, reflecting the fact that Governor Newson has made housing a high priority. A large boost in production will likely also require local land-use and zoning policies change. For example, research has shown that more multi-family housing is needed to address the affordability crisis in the state—but, in many localities, zoning restrictions make it very difficult to increase this type of housing. State-level action in this area has been highly contentious, as it often comes into conflict with local control. For example, Senate Bill 50, which would eliminate some zoning restrictions near major transit lines and job centers, unleashed a great deal of controversy and is now on hold until next year.

Zoning reform is one step toward the goal of increasing housing production, but it is probably not sufficient. Tying financial incentives directly to housing production is a potentially effective state strategy. Moving forward, sustained cooperation among state and local governments and also private developers is critical to addressing California’s housing challenges.


The Yolo Bypass: It’s a Floodplain! It’s Farmland! It’s an Ecosystem!

This is part of a series on issues facing California’s rivers.

California’s biggest river—the Sacramento—needs a lot of room to spread in big water years. A floodplain project called the Yolo Bypass allows it to flood naturally, while also providing habitat for waterbirds, fish, and other aquatic species. We talked to Ted Sommer, lead scientist for the Department of Water Resources (DWR), about this versatile landscape.

photo - Ted Sommer

PPIC: What is the Yolo Bypass, and what does it do?

Ted Sommer: It’s California’s primary floodplain. The Sacramento River drains a massive portion of the state, and the bypass gives it a large area—about 60,000 acres—to spill in high flood events. Then it drains safely back into the river and the Delta. You can see the bypass from highway 80 heading into Sacramento—it often looks like an inland sea in winter. It stayed flooded this year for months on end. If not for that floodplain a lot of people’s back yards would have been flooded in Sacramento. It’s a unique and effective part of the state’s flood management system.

The bypass also provides other benefits. Although its primary purpose is for flood management, it’s used extensively for agriculture. And it’s also managed heavily for wildlife. Its seasonal wetlands provide great bird habitat. And when flooded it serves as a nursery area for young fish in the Delta and good habitat for salmon migrating downriver to the bay. It’s a great example of balancing ecosystem benefits with other needs.

PPIC: What are some of the challenges in managing this landscape?

TS: One reason we started working on the bypass was the finding that a lot of key species do really well in wet years. So we started looking at this habitat that usually only gets flooded in wet years. Over 20 years of research on the bypass, we learned a lot about its role as a fish nursery.

In wet years this floodplain provides better habitat and more food for fish. But because it was designed as a floodway, the water shuts off quickly at the end of the wet season, and fish can get stranded or forced out of this habitat before they can get all the benefits from it.

We also found that the bypass is also a superhighway for many migrating adult fish—sturgeon, adult salmon, and others. The problem is that it is a dead-end in dry years. Even in wet years, as it starts to dry up, fish can get stranded as they move upstream in receding floodwaters.

Based on these areas of research, we’ve identified three priorities. The first is to improve fish passage. We’ve created a fish collection area in the bypass so we can help them get where they need to go in drier conditions. We also built a sophisticated fish ladder for fish migrating upstream during wetter years.

The second priority is improving connectivity between the river and its floodplain. A proposed notch in the top of the bypass would help extend the duration of flooding, giving baby fish more time in the nursery habitat. We hope to move forward with this project in the next several years.

The last improvement is to enable the floodplain to act as a foodbank beyond wet times. In recent years we’ve been working with water users, particularly rice farmers, to get pulses of water in summer and fall to move plankton downstream. Much of this water has already been used to grow rice and is returning to the system. Local farmers and water users have been great partners in this project.

PPIC: Is this model replicable elsewhere?

TS: Yes! Locally, the success of Yolo Bypass has helped fuel interest in restoring floodplain habitat in both the Sacramento and San Joaquin valleys. And it’s inspired people around the state and beyond to consider creating floodplains as part of their flood and ecosystem management strategies. People come from all over the world to visit the bypass. As the climate changes, such places can help manage flooding from extreme events while also providing many other beneficial uses.

A New Look at College Enrollment Rates

California’s K–12 districts and schools are responsible for preparing students for college and career. But until recently, data has not been available to determine their success in actually getting students to apply to and attend college. Now, however, the California Department of Education has published data on college enrollment among recent high school graduates, using information from the National Student Clearinghouse. Initial findings show wide disparities in college enrollment across racial/ethnic groups and throughout the state’s regions—including within school districts themselves.

According to the data, about 65% of California’s high school graduates attended college within a year of graduation in 2017–2018 (the most recent data available). But there are wide differences. For instance, Latino students—the majority of K–12 students—have a relatively low rate of college enrollment (58%), while rates for Asian American students (84%) are quite high. Asian American students are also much more likely to attend a University of California campus than other students. African-American students have a similar enrollment pattern as Latino students, except many more opt to go to college in another state. White and multi-racial students also enroll in out-of-state colleges or universities at rates above the state average.

Figure - College Enrollment Varies Widely Across Racial and Ethnic Groups

Differences by school, district, and region are also available in the data (you can check your local district’s college enrollment rates here). Fresno provides a good example. Fresno County has higher college enrollment rates than the state, but students are much less likely to attend a UC and much more likely to attend a CSU or community college—perhaps because of the strong presence of Fresno State and local community colleges, as well as the greater distance to most UC campuses.

Figure - Enrollment Rates May Differ Even Within School Districts

Among the many districts in Fresno County, students from Fresno Unified School District are relatively more likely than others to attend college. But there is plenty of variation within the district. Sunnyside High has very high enrollment rates; however, rates are lower than the district average for UC and much higher for community college. By contrast, Edison High has much higher than district average enrollment at UC, private, and out-of-state schools.

Enrolling in college or university is a goal for many high school students. But because the existing K–12 and higher education data systems are not linked in California, this is the first time in over a decade that the state has good information about whether high school students are meeting that goal. With the passage of SB75, California has begun the process of building a statewide longitudinal data system that will connect the existing student data systems between K–12 and higher education. The new enrollment data provide the first glimpse of the promise of a connected education data system. Linking data across segments could yield useful new information—such as whether students were successful in their college courses—which would fit nicely in the state’s dashboard on college readiness.

Motivating Californians to Fill Out the 2020 Census

The 2020 Census will determine the distribution of billions of dollars in federal funds and the accuracy of political representation at the local, state, and federal levels. Emphasizing the benefits to local communities is likely the best way to encourage participation and counteract the concerns many Californians have about confidentiality.

The latest PPIC Statewide Survey shows that 63% of Californians are concerned about whether the Census Bureau will keep their responses confidential, as the law requires. The concern is more acute among Latinos (74%) and African Americans (74%) than among Asian Americans (64%) or whites (52%). Immigrants are also much more likely to be concerned than US-born residents.

Figure: Majorities Are Concerned About the Confidentiality of Census 2020
The Census Bureau conducted an extensive survey and a set of focus groups to identify key reasons for people’s possible reluctance to participate in the census, as well as potential motivating factors that could improve participation. The focus groups revealed that merely informing people of the Census Bureau’s data protection policies was unlikely to assuage concerns.

Focus group participants across all demographic groups identified the census’s role in providing federal funding for communities as the main motivator for responding to the census. And 62% of survey respondents said that benefits to the community—determining funding (30%), contributing to a better future for the community (17%), and providing information for local planning (15%)—are the most important reason to fill out the census.

Figure: Most Important Reason to Fill Out the Census Form

But fewer than half of survey respondents knew that the census is used to determine local funding levels, suggesting that this information could go a long way toward motivating participation. Focus group participants—who were chosen from demographic groups deemed likely to respond at low rates—also indicated that hearing directly from trusted voices in their own communities would be important.

Community organizations and elected officials are already acting on this information. On April 1, Los Angeles city and county officials convened a rally to promote the census, emphasizing the link to federal tax dollars for local programs. The Hispanic Federation’s messaging also highlights the census’s role in allocating federal funds.

More efforts are underway. Governor Newsom has pledged an investment of $187 million for outreach activities to boost participation. Meanwhile, the California Complete Count Office has begun issuing grants to help local organizations communicate directly with hard-to-count populations.

Focusing on local funding and community benefits is a promising approach, but a strong outreach strategy will have to go further. A complete and accurate count will likely depend on hard-to-count populations working to develop and deliver the most effective messages for their own communities.

The State of Wildfire Risk Reduction in California

After a few horrific years of extreme wildfires, California has been taking steps to reduce future risks with new programs, increased funding, and new policy efforts. We talked to Van Butsic—a land use scientist at UC Berkeley and an adjunct fellow at the PPIC Water Policy Center—about these efforts.

PPIC: Is California doing enough to manage its forests and reduce wildfire risk?

Van Butsic: Probably not, but it’s definitely doing a lot more than it was five years ago. The state has made a substantial effort to deal with the issues around wildfires—just not yet at the scale needed to get big results.

The state has been pretty active in the past year on addressing some of the shortcomings of federal forest management—the federal government is the biggest landowner of California’s headwater forests. One interesting thing the state is doing is using some funding—about $200 million a year—from the Greenhouse Gas Reduction Fund on fuel reduction projects. These projects are managed by multiple stakeholders, and many are on federal lands.

PPIC: The Newsom administration has taken additional steps to address wildfire risk. Where do you think they’re on the right track? What elements are still needed?

VB: They’re doing a better job in realizing we need to have more hands-on management. Governor Newsom issued an emergency order that reduced environmental review for a handful of fuel reduction projects, which means they can take place a little quicker and address fire risk this season. And they’re investing a bit more money in fire suppression.

I’d like to see more work in building community wildfire resilience across the state. We need stronger policies that start at the house and work outward—to ensure that homes are hardened against wildfires (for example, with more fire-resistant roofing materials) and have defensible space around them. Most importantly, we need a systematic plan to prevent further expansion of communities into areas where catastrophic wildfires are a risk.

PPIC: Talk about new funding tools that can help improve forest health.

VB: One approach being considered depends on the state’s willingness to pay for measures to reduce the risk of big wildfires as part of its effort to reduce carbon emissions. The idea would be to use the carbon market to fund forest management practices.

A second area where we’re seeing bit of action is on water issues. Forest thinning can in some cases lead to more water in streams. We’ve seen a few projects that fund forest management activities in hopes of getting more water as a benefit. The big question is, how much more water will you get by thinning forests? It’s a pretty complex question that has to do with existing vegetation and the elevation of the land. It’s a bit of a challenge to find the sweet spot—the science isn’t settled yet on where forest management can increase water yield.

PPIC: What about fire risk outside the headwaters?

California has many forest types and landscapes that are prone to wildfire. Many of our larger wildfires have been in the Sierra headwater forests, which are currently too dense—they’re primed for large, high severity wildfires, and we need to address this problem.

But many of the homes impacted by wildfires in the past decade are not in traditional headwater forest areas. Managing these risks is really different from managing forests—it requires different policies and funding. Building codes are one way, but they’re mostly devised at the local level and aren’t uniform—some municipalities have better fire-resistance standards. The state does fire-severity-zone mapping, but not a lot of local governments are paying attention to that. I’m not sure what the state’s role should be in that regard. I’ve done some work in France, where the federal government says where you can and can’t develop in areas prone to wildfire, and as a result they have far fewer homes in at-risk areas. I’m not sure if that’s a tradeoff Californians would be willing to make.

Training California’s Students for Well-Paying Jobs

California’s community college system is the largest provider of career education—also known as career technical education or vocational education—in the state. Career education programs play a critical role in training students, especially underserved and nontraditional students, for jobs that provide solid wages but don’t require a four-year college degree.

How can colleges identify these jobs? In a recent PPIC report, we compare occupational earnings to regional poverty thresholds to assess how future workforce needs connect to well-paying jobs that don’t require a four-year degree. Other work by the Brookings Institute focuses on “opportunity industries,” in which good jobs—those that provide stable employment, middle-class wages, and benefits—represent an above-average share of the industry’s total jobs and are filled by workers with only some college training.

Opportunity industries are largely concentrated in fields that align with many of the community colleges’ career education disciplines, including business, engineering, health, information technology (IT), and public and protective services. A critical question is whether students are successfully completing programs that will prepare them for careers in these fields.

The good news is that over the past 20 years, there has been a consistent upward trend in the completion of career education credentials in California’s community colleges, with major gains observed in the last decade. This increase spans industries. Notably, more degrees and certificates are being earned in health than in any other discipline—this is important since health credentials are especially valuable in increasing students’ subsequent earnings.

Figure - Community Colleges Have Seen Steady Growth in the Number of Career Education Credentials Awarded

But not all credentials are associated with large economic gains. For example, in our analysis of wage returns, we find that career education credentials in business and IT do not provide much of a wage boost.

Furthermore, there seems to be a mismatch between the awards with the most value and the awards students are earning. While awards from longer programs generally tend to confer more value than those from shorter ones, completion of short-term awards has increased in several career education disciplines.

Community colleges and industry partners need to work together to ensure students have a path to well-paying jobs and the tools needed to succeed. As shown in our research, some of that work begins with colleges structuring effective pathways to these industries and clearly communicating the economic returns and opportunities available to students.

Moreover, strong partnerships between community colleges and nearby industries will be essential in creating a bridge between students and their industry of choice. Ultimately, these efforts can help improve the economic well-being of individual students and the state as a whole.

Record Growth Puts Money in the Bank for California

This July marks the longest period of economic expansion in US history. For 121 months and counting, the national and state economies have experienced continuous growth.

Figure: Record-Setting Economic Expansion in US and California

One consequence of this sustained economic growth? An increasing stream of tax revenue flowing into the state’s treasury. This, in turn, has shaped a new state budget that contains record-breaking levels of spending.

In terms of fiscal sustainability, however, the most intriguing element of the new budget may be the dollars that weren’t spent. The budget that the legislature passed and governor just signed includes total budget reserves of more than $20 billion—also a record for the state.

The continued accumulation of budget reserves represents important progress toward preparing the state for an economic slowdown. Because of California’s tax structure, recessions hit the state’s budget particularly hard. Past recessions have caused deep drops in the level of General Fund dollars available, leading to a combination of spending cuts, tax increases, and borrowing to balance the state’s budget.

Building budget reserves should enable California to reduce the impact of a recession. Our estimates suggest that the current level of reserves would allow the state to weather the impact of a mild recession. However, they would be insufficient in the face of a moderate to severe downturn. In other words, there is still work to be done.

None of this matters if the economy never slows down. Just because the economy has gone up for so long, doesn’t mean it must fall—there is no equivalent to gravity when it comes to economics. But history suggests that recessions have a way of interrupting periods of growth. And there are some signs that clouds are gathering on the economic horizon: bond rate curves, drops in consumer confidence, and uncertainty surrounding tariffs and trade. At the same time, the stock market just finished a very positive first half of the year.

Forecasting the timing of the next recession is a much more difficult proposition than asserting that there will be one. The same could be said of California’s earthquakes. But as with earthquakes, the fact that we don’t know exactly when the next recession will hit shouldn’t stop the state from preparing for it.

An Opportunity to Restore Fish Abundance on the Eel River

This is part of a series on issues facing California’s rivers.

The Eel River—once home to the state’s third-largest salmon and steelhead runs, all of which are now listed as threatened―may see the return of healthy fisheries in coming years. A unique opportunity to remove a dam that blocks fish from reaching spawning habitat has arisen. We talked to Curtis Knight, executive director of CalTrout, about the situation.

photo - Curtis Knight

PPIC:  Why is the Eel River important for California fisheries?

Curtis Knight: This a complex system that involves two of the biggest coastal watersheds in the state—the Russian River and the Eel River. The Eel presents the best opportunity to restore historic fish abundance in California. The river is blocked by two aging dams—Cape Horn Dam, which diverts water from the Eel to the Russian River for hydropower and other uses and has limited fish passage, and Scott Dam, which has no fish passage and blocks important upper watershed fish habitat. Scott Dam is owned by PG&E, which is attempting to divest itself of the project. This presents an opportunity to reestablish fish into the upper Eel basin.

On the Russian River side, irrigators and others benefit from the water diversions. This water is used to grow crops like wine grapes and keep the river flowing for endangered species and recreation.

On the Eel River side, it’s all about wild fish. Getting fish into the upper watershed above the dam is a top priority for local tribes, NGOs, and others. We did an assessment with Humboldt State University that found more than 150 miles of quality habitat for salmon and steelhead above Scott Dam. This stretch includes high elevation habitat that is rare in the coastal range. Getting salmon and steelhead into this cold-water region will be increasingly important for these fish in a warming climate.

Congressman Jared Huffman has formed a committee to develop recommendations as part of the Federal Energy Regulatory Commission’s (FERC) dam relicensing process for this project. The committee’s goals are to improve fish passage and habitat on the Eel to support naturally reproducing and harvestable native fish populations and to minimize impacts to water supply reliability, fisheries, water quality, and recreation in both basins.

The committee is looking at various fish passage alternatives, but Scott Dam is tall, which makes fish ladders—step-like pools to enable fish to cross the dam—really expensive and not very effective. Trucking fish around the dam, as is done in some watersheds, is also being explored, but in my opinion is not sustainable and won’t lead to fish abundance. Removing Scott Dam would clearly be the best way to restore fish abundance in the Eel River.

PPIC: Is there concern about losing both the water and the energy?

CK: The project doesn’t produce much power. The real value is the water. PG&E is walking away from the project in part because they lose roughly $5 million per year operating it.

On July 1, Humboldt County, Sonoma Water, the Mendocino Inland Water and Power Commission, and California Trout applied to take over the dam relicensing process from PG&E. The purpose is to work toward the two-basin solution and ensure the future of the project is determined locally.

Congressman Huffman’s committee will play a central role in determining what the project will ultimately look like. But one idea is to remove Scott Dam while still diverting water to the Russian River during the winter via Cape Horn Dam. Fish passage would have to be improved at Cape Horn and there are Russian River interests that would need to be met. The loss of water storage from Scott Dam can potentially be offset by storing Eel River water in Lake Mendocino. This would certainly be a good scenario for Eel River fish, but there are still some challenges to overcome.

So while there is still a long way to go, we are confident we will come up with a locally derived solution that meets the needs of fish and people in both the Russian and Eel Rivers.

Photo credit: Mike Wier, California Trout

K–12 Education and the New State Budget

The recently enacted 2019–20 budget allocates 28% of the total state budget for all K–12 education programs: $103.4 billion ($58.8 billion from the General Fund). Proposition 98, passed by the voters in 1988, establishes a minimum annual funding level for K–12 schools and community colleges. This year, the Proposition 98 funding level is $81.1 billion, bringing K–12 per-pupil expenditures to nearly $12,000. According to the Department of Finance, total per-pupil funding, including all federal, state, and local sources amounts to $17,423.

In addition, the rainy day fund requires the state to set aside savings for future education spending based on specific criteria, including General Fund tax revenue and Proposition 98 funding levels. This year, for the first time ever, the budget triggers a deposit into Public School System Stabilization Account at $376.5 million.

figure - K-12 Funding Is at a New High

The Local Control Funding Formula (LCFF) is the primary manner in which funds are distributed to support students. This year’s budget brings the total LCFF funding to nearly $63 billion, a $1.9 billion increase from last year, accounting for a statutory cost-of-living adjustment.

This year’s enacted budget also includes funding to address a wide range of concerns, including pensions, special education, and full-day kindergarten. For teacher pensions (CalSTRS), the budget pays down the state’s ($2.9 billion) and the districts’ share ($1.6 billion) of the unfunded liability. Another $500 million for fiscal year 2019–20 reduces by 1.03% school districts’ contribution rate to CalSTRS and CalPERS (pensions for public employees). The budget adds $350 million to reduce that contribution rate by an additional 0.7% in 2020–21.

The budget aims to mitigate rising special education costs to districts by adding more than $600 million to support students with disabilities.

A $300 million one-time payment goes to the Full-Day Kindergarten Facilities Grant program, which allows districts to construct new facilities or retrofit preexisting ones for the purposes of ensuring access to full-day kindergarten.

Despite the record funding level this year, two longer-term finance issues loom. The CalSTRS funding plan, as governed by AB 1469, has set school districts’ share of teacher pension costs to increase to 18.1% in 2019–20 and to 19.1% by 2020–21. While the budget’s funding toward the districts’ contribution rate will provide much-needed relief, growing pension costs will remain challenging.

Finally, in a time of growing costs, declining student enrollment is hampering districts across the state. Over the past five years, nearly half of all districts experienced enrollment losses—and this trend may continue over the next decade. Given that the state’s funding model is based on average daily attendance, declining enrollment is likely to persist as an important fiscal issue over the long run.

Budget Takes Baby Steps Toward Special Education Reform

The new 2019–20 state budget recently signed by Governor Newson provides significant new funding for K–12 special education programs. It also makes substantial revisions to the state funding model for services to students with disabilities—and signals policymakers’ intent to make even more extensive changes in this policy area next year.

Passage of the Local Control Funding Formula (LCFF) in 2013 generated questions about the fiscal and planning effects on local special education programs. Our work in this area (in 2016 and 2018) has found that district special education costs have risen much faster than state funding over the previous decade and has recommended several changes to make state funding more responsive to local costs. The new state budget includes two of our key recommendations:

  • Equalize special education funding. This year, $153 million was added to partially equalize per-pupil special education funding levels. Our report recommends equalizing local per-pupil funding rates up to the 90th percentile of current levels. Funding rates across Special Education Local Plan Areas (SELPAs) range from about $500 per pupil to more than $1,000. The new funding would bring the lowest local rate up to $557, which is about the 75th percentile of existing rates.
  • Fund early childhood special education. Another $493 million in this year’s budget will provide grants of about $9,000 for 3- and 4-year-olds who participate in special education preschool programs. State special education formulas fail to provide any state support for these children, and our reports conclude that the lack of funding could discourage districts from aggressively seeking children who could benefit from early services.

Because the new funding helps districts pay for their existing special education programs, these appropriations provide welcome fiscal relief. But the budget attaches a giant question mark to the long-term future of these new appropriations. Specifically, in 2020–21, the budget makes the two new grants conditional on broader special education reforms, and even holds out the possibility of revising those grants. Issues for further discussion include:

  • More changes to special education funding. Problems with the main special education funding formula were not addressed in this year’s budget. We have suggested the state peg annual budget increases to a better predictor of future costs, such as LCFF increases or past changes in special education costs.
  • Refining the role of SELPAs. We have also suggested giving districts greater leeway in determining how students with disabilities are educated, consistent with LCFF’s local control focus. SELPAs perform a wide range of services locally, including planning how students are served and supporting district special education programs that exhibit sub-par performance.
  • Improving local special education programs. The budget identifies two specific areas for attention: serving more students in their regular classroom (rather than in separate special education classes) and ensuring that student subgroups are not identified for special education in disproportionate numbers. By including this issue in the budget language, policymakers are signaling they want faster progress in these areas.