Video: Fiscal Challenges of Declining Enrollment in California Schools

Enrollment declines in California’s public K–12 school system are expected to intensify in the coming decade. Districts with falling enrollment face financial pressures, as state funding falls along with the number of students they serve. Lower enrollment also has important implications for the state budget. At a lunchtime event in Sacramento last week, PPIC researcher Paul Warren outlined a new report on declining enrollment and a panel of experts offered state and local perspectives.

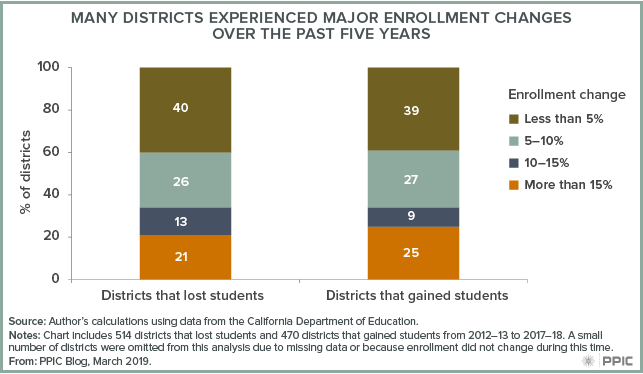
Warren explained that enrollment is falling in about half of California’s school districts. In the coming decade, declines will be significant in coastal areas—and in many of the state’s largest school districts. The state budget cushions the fiscal impact of declines in enrollment by delaying attendance-based funding cuts for one year. But enrollment declines are almost always long term, and district costs do not fall at the same rate as district revenues.

Renee Arkus, executive director of fiscal services for the Long Beach Unified School District, said that adjusting to lower enrollment hinges on knowing the speed and the spread of declines. Long Beach, the state’s third-largest district, has been experiencing declines for 15 years. “We’ve lost 25% of our population,” she said, adding that the district has been losing 1,500 to 2,000 student each year, and those losses have been spread across a number of schools.

Sara Bachez, assistant executive director of governmental relations for the California Association of School Business Officials, noted that declining enrollment is one of many fiscal pressures districts are facing. She cited a growing demand for special education, pension and health care costs, aging infrastructure, and the challenge of offering proper compensation for district staff.

Claudia Davis, associate superintendent of the Calaveras County Office of Education, highlighted the challenges that small districts face. Like Long Beach, Calaveras County has been experiencing declines for the last 15 years. But because Calaveras is a small county, it is challenging to find ways to reduce spending. “We have district offices with three people in them,” she said, so cutting staff would have a big impact: “The work has to get done regardless of the size of your district.”

Mike Fine, chief executive officer of the Fiscal Crisis and Management Assistance Team, pointed out that the fiscal challenges that Calaveras County faces are typical, as more than half of the state’s districts serve fewer than 2,500 students. In his view, the best guide to addressing these challenges is the Local Control and Accountability Plan (LCAP) that each district is required to develop. “We have to clearly define what are our core services that we can’t do without, and then everything else is up for discussion,” he said.

Most districts could benefit from state assistance in forecasting and responding to declining enrollment. As Arkus put it, long-term planning is “the only way that some districts can survive this.” And Davis noted that small districts don’t have the human capacity for exhaustive planning. “Long-term planning is difficult when you’re . . . just trying to keep the doors open.”

Testimony: California Is on Track to Close the Degree Gap

[vc_row][vc_column][vc_column_text]Hans Johnson, director and senior fellow at the PPIC Higher Education Center, testified February 25, 2020, before the Assembly Budget Subcommittee (No. 2) on Education Finance, chaired by Assemblymember Kevin McCarty. Here are his prepared remarks.

At the PPIC Higher Education Policy Center, we have long been concerned about the future of California’s workforce. Would the state have enough college graduates to meet evolving economic demands? We have produced a series of reports addressing the dynamics of this issue.

Five years ago, we projected a shortage of highly educated workers in California. Specifically, our economic projections to 2030 showed that about two in five jobs would require at least a bachelor’s degree, while demographic projections suggested that only about one in three Californians would attain this level of education. This shortfall amounts to 1.1 million bachelor’s degrees.

PPIC noted that to fill this shortfall, the state and its higher education systems would need to act—increasing access, transfer, and completion especially among groups historically underrepresented in higher education, including low-income students, first-generation college students, Latinos, and African Americans.

We identified ambitious targets that—if met—would close the degree gap. Those targets included large increases in access to the University of California (UC) and California State University (CSU), both for first-time freshmen and for transfer students. They also included substantial increases in graduation rates. At the request of the legislature, UC and CSU both issued reports on how they might meet those targets.

Today, I’m pleased to say that California is currently on track to close the gap. The concerted efforts of policymakers, higher education officials—including staff and faculty—and, of course, students have led to these early gains.

State General Fund allocations for each system have increased substantially since the Great Recession, allowing for increased enrollment and renewed efforts to improve student persistence and completion. Both UC and CSU have exceeded PPIC’s closing-the-gap targets. These early gains have reduced the degree gap by almost 80,000.

figure - UC and CSU Are Making Strong Progress

Two primary actions have led to these gains.

First, increases in state funding have allowed UC and CSU to enroll substantially more first-time students from California—both freshmen and transfer students. At UC, enrollment of transfer students went up 16% between fall 2010 and fall 2019. Enrollment of freshmen grew 14%. At CSU, enrollment increased 41% for transfer students and 33% among freshmen over the same time period. Notably, UC’s gains occurred primarily in one year, from 2015 to 2016, when the legislature and governor tied a $25 million allocation to increasing enrollment by 5,000 students. In that single year, total first-time enrollment of freshmen and transfer students went up 10%, with gains concentrated among African Americans (36%) and Latinos (25%).

figure - UC and CSU Are Enrolling More First-Time Students

Second, programs to improve student persistence and graduation rates have also paid off—and contributed to enrollment growth. These gains have been especially sharp at CSU, which has received substantial funding from the state to support its graduation initiative. At CSU, six-year graduation rates for California-residency students have increased from 57% for 2009 entering freshmen to 67% for the 2013 cohort. At UC, four-year graduation rates for California-residency students have increased from 62% for 2010 entering freshmen to 68% for the 2014 cohort. (Six-year graduation rates at UC remain very high, around 85%). Graduation rates for transfer students have also increased at both systems.

These early successes are very promising. Still, California needs to build on them if it is to close the degree gap fully. The demand for college remains high. PPIC’s statewide surveys show that the vast majority of parents (79%) want their child to earn at least a bachelor’s degree. College preparation among high school graduates has increased, with the share of students completing the college preparatory requirements of UC and CSU now at an all-time high. And while applications to UC and CSU have levelled off or even declined a bit recently, application levels are still near record highs. All but one UC campus and many CSU campuses already do not have room to admit all eligible applicants.

Looking ahead, strong demand for UC and CSU is likely to continue as college preparation improves and the transfer pathway becomes more efficient and effective. New initiatives, including reforms in remedial education at the community colleges and CSU, have the potential to substantially improve student success rates and boost transfer. New articulation agreements, such as the Associate Degree for Transfer, have streamlined the pathway from community colleges to four-year colleges, especially CSU. (PPIC will be issuing a report on transfer trends later this year.) And an increased focus on improving student outcomes has led to multiple substantive reforms designed to increase persistence and completion at UC and CSU.

Finding ways to accommodate all eligible students is a pressing challenge, but one that must be met in order to ensure a better future for all Californians. Through thoughtful planning—and yes, additional funding—closing the degree gap is possible. Improving access and completion is a necessary and critical component to ensuring that more low-income, first-generation, and underrepresented students enjoy the benefits of a college degree. The early progress I’ve highlighted here has led to greater access and success for underrepresented students, creating momentum to improve the wellbeing of all Californians.[/vc_column_text][/vc_column][/vc_row]

Pointing Eligible Students to Available CSU Campuses

Large numbers of students are turned away from their campus of choice each year because many California universities receive more freshman and transfer applications than they can admit. At the California State University (CSU), campuses with more applications than they can admit are called “impacted.” All but 2 of the 23 CSU campuses have at least one program of study impacted for the 2020–2021 school year; at 7 campuses every program is impacted.

For CSU, students can easily apply to more than one campus. One application covers all campuses, and students pay a $70 per-campus fee for each school they select (although about half receive fee waivers). First-time freshman applicants and transfer applicants both apply to around 3 CSU campuses on average (3.3 campuses for freshmen, 2.6 for transfers).

About 32,000 eligible freshmen and transfer applicants were denied admission to their preferred CSU campus due to capacity issues in 2018. In 2019, CSU started a program to redirect denied students, offering admission to one of ten campuses with space. In the first year, about 20,000 students were offered admission at an alternate campus, and about 900 enrolled (4.5%), according the CSU Chancellor’s Office. The program was most successful among redirected transfer students, who enrolled at an 8.2% rate compared to freshmen at 1.9%.

We don’t know what happened to the students who did not enroll, as the state has no way of tracking student records between institutions. Some may have ended up at a UC, a private college, or other institution. Freshmen applicants may have decided to attend a community college with plans to transfer later. A statewide longitudinal data system can help the state create better policy around capacity in higher education.

As the CSU redirection program continues and applicants understand the process better, interest in the program—and enrollment rates—may increase. However, a similar long-standing program at the University of California has had similar low rates of enrollment from redirected students. CSU is considering ways to improve program timing and delivery; using their excess capacity to put almost 900 extra students on the road to a bachelor’s degree in the first year of the policy is already an important step.

K–12 Education and the New State Budget

The recently enacted 2019–20 budget allocates 28% of the total state budget for all K–12 education programs: $103.4 billion ($58.8 billion from the General Fund). Proposition 98, passed by the voters in 1988, establishes a minimum annual funding level for K–12 schools and community colleges. This year, the Proposition 98 funding level is $81.1 billion, bringing K–12 per-pupil expenditures to nearly $12,000. According to the Department of Finance, total per-pupil funding, including all federal, state, and local sources amounts to $17,423.

In addition, the rainy day fund requires the state to set aside savings for future education spending based on specific criteria, including General Fund tax revenue and Proposition 98 funding levels. This year, for the first time ever, the budget triggers a deposit into Public School System Stabilization Account at $376.5 million.

figure - K-12 Funding Is at a New High

The Local Control Funding Formula (LCFF) is the primary manner in which funds are distributed to support students. This year’s budget brings the total LCFF funding to nearly $63 billion, a $1.9 billion increase from last year, accounting for a statutory cost-of-living adjustment.

This year’s enacted budget also includes funding to address a wide range of concerns, including pensions, special education, and full-day kindergarten. For teacher pensions (CalSTRS), the budget pays down the state’s ($2.9 billion) and the districts’ share ($1.6 billion) of the unfunded liability. Another $500 million for fiscal year 2019–20 reduces by 1.03% school districts’ contribution rate to CalSTRS and CalPERS (pensions for public employees). The budget adds $350 million to reduce that contribution rate by an additional 0.7% in 2020–21.

The budget aims to mitigate rising special education costs to districts by adding more than $600 million to support students with disabilities.

A $300 million one-time payment goes to the Full-Day Kindergarten Facilities Grant program, which allows districts to construct new facilities or retrofit preexisting ones for the purposes of ensuring access to full-day kindergarten.

Despite the record funding level this year, two longer-term finance issues loom. The CalSTRS funding plan, as governed by AB 1469, has set school districts’ share of teacher pension costs to increase to 18.1% in 2019–20 and to 19.1% by 2020–21. While the budget’s funding toward the districts’ contribution rate will provide much-needed relief, growing pension costs will remain challenging.

Finally, in a time of growing costs, declining student enrollment is hampering districts across the state. Over the past five years, nearly half of all districts experienced enrollment losses—and this trend may continue over the next decade. Given that the state’s funding model is based on average daily attendance, declining enrollment is likely to persist as an important fiscal issue over the long run.

Declining K–12 Enrollment Forces Major Budget Cuts in Many Districts

The teacher strikes in Los Angeles and Oakland reflect the fiscal stresses facing many school districts across the state. Rising pension and health care costs account for some of this pressure. For many districts, declining student enrollment is another factor.

Because state funding is based on average daily attendance, falling enrollment leads to lower state funding levels. Significant, sustained declines require districts to make difficult decisions to stay afloat financially. Since an average of 82% of K–12 spending goes to salaries and benefits, downsizing often means reducing teachers and administrators—or possibly closing a school.

Over the past five years, overall K–12 enrollment in California increased by only 0.1%, or 6,600 students out of the more than 6.2 million attending public schools. This stable picture masks significant variation across districts. Roughly half of the state’s nearly 1,000 districts experienced enrollment losses, while the other half grew over this time. In many cases, the change was small: about 40% of districts experienced a net change—gain or loss—of less than 5% from 2012–13 to 2017–18.

However, the majority of districts saw an enrollment change of more than 5%. Indeed, 107 districts lost more than 15% of students. These districts were generally small: the average school had 700 enrolled students in 2012–13 and lost more than 170 students over the five-year period. In some cases, these large enrollment losses were associated with the closing of a charter school. Many of these districts, though, have only one school, and large percent reductions in enrollment require significant cuts in teachers, administrators, and other staff.

Many Districts Experienced Major Enrollment Changes Over the Past Five Years

Many large districts also lost significant numbers of students over the past five years. In Los Angeles County, for instance, 61 of 79 districts experienced enrollment declines—including Los Angeles Unified, which lost 34,000 students (a 5% decline) and Long Beach Unified, which lost almost 7,600 students (9%). In addition, seven districts with more than 10,000 students lost between 10% and 15% of enrollment. For a district of 10,000 students, losing 10% of enrollment translates into 1,000 fewer students—equal in size to two typical elementary schools. For example, Montebello Unified saw a dramatic 13% decline, losing more than 4,000 students during the five-year period.

Declining student enrollments can be due to a wide range of factors—changes in charter school enrollments, decreasing birth rates, or families moving away, among others. Laying off teachers and adminsitrators is painful—and closing schools is a particularly wrenching topic, as parents value their local schools.

Governor Newsom’s proposal to help districts with rising pension costs may relieve some—but not much—of the financial pressure for districts. K–12 financing in California is also affected by voter-approved initiatives that make significant school funding increases unlikely in the near term. There’s no easy solution, but unless these dynamics change, districts will need to learn to adjust to long-term enrollment and revenue reductions or face the risk of insolvency.

The Growing Gender Divide in Higher Education

In California and across the nation, women have surpassed men in educational attainment. In 2006, for the first time ever, a majority of college graduates in the state were women. By 2014, 52% of California adults ages 18 to 64 with at least a bachelor’s degree were women, up from 45% in 1990. This gender divide in educational attainment is likely to continue to grow because the disparity is especially notable among younger adults: in 2014, 718,000 (55%) of California’s college graduates under 30 were women, compared to only 588,000 men.

Why are women now more likely to earn a college degree than men? The most direct and obvious answer is that women are more likely to be prepared for college, and thus more likely to enroll in college and graduate from college once enrolled. For example, among high school graduates in California, women are more likely to have completed the courses required for admission to the University of California and California State University. In 2014–15, almost half (49%) of female high school graduates completed these college preparatory courses, compared to only 38% of their male peers. This gap has grown since 2004–05, when 39% of female and 31% of male high school graduates completed these college preparatory courses.

Better academic preparation among women leads to higher college enrollment and graduation rates. According to US Department of Education data, 55% of all undergraduates enrolled in California’s colleges and universities in 2014 were women. And once enrolled, women are more likely to graduate. Six-year bachelor’s degree completion rates in the state were 61% for women and 57% percent for men.

The strong progress that women have made in higher education is good news. Yet inequities remain. Female college graduates earn less than their male peers. Women also have lower rates of employment than men. Policies that promote pay equity, flexible work schedules, and parental leave may help address these issues.

Women are especially underrepresented in important fields such as computer science and engineering—as are African American and Latino men. For California to meet the challenges of the 21st century economy, we need even more women and men—including those from groups traditionally underrepresented in higher education—to earn a college degree.

Learn more

Visit the PPIC Higher Education Center