Video: Legislative Leaders Address Sexual Misconduct

When Anthony Rendon was asked to name the biggest issues for the governor and state legislature to address this year, he prefaced his answer with a look back. “Last year was a banner year,” the California assembly speaker said, citing infrastructure, housing, and climate change efforts. Then he added a caveat:

“Some of that was obscured—and rightly so—by the sexual harassment crises that developed in the fall. This year we have to start with that.”

Rendon said the assembly is revising sexual harassment policies and procedures that have not been updated since 1993, and he acknowledged that this is only the start in a larger change needed in the way the institution conducts its business.

Rendon spoke as part of an annual event that brings together California’s legislative leaders from both parties in a conversation with Mark Baldassare, PPIC president and CEO. Rendon was the lone leader on stage for much of the event because the state senate was discussing the fate of a colleague accused of sexual harassment.  Patricia Bates, Republican state senate leader, and Kevin de León, president pro tem, later joined the assembly speaker on stage.

Bates said her top issue for 2018 is addressing the high cost of living in California. “Affordability affects every socioeconomic level in our state,” she said.

De León referred to California’s resistance to the direction of federal policies in describing his top priority: defending what he called “our incredible gains” in California—a higher minimum wage, gun safety and ammunition regulation, and extension of the Global Warming Solutions Act. He also emphasized protecting the state’s immigrants.

Both senate leaders described a bipartisan approach to addressing sexual harassment. Bates commended de León for quickly turning the investigation of allegations over to outside law firms independent of the senate. The leaders pointed to process changes in the works to address harassment, and both said that changing the culture is a much longer term goal. How does cultural change come about?

“You build in trust with the policies that are there—that they are responsive, they are fair, they give due process, and they have just consequences,” Bates said.

Examining the Federal EITC’s Impact on Poverty

The federal Earned Income Tax Credit (EITC) plays an important role in keeping Californians out of poverty. The credit supplements earnings for low-income workers at tax time, providing $2,400 on average to qualified tax filers.

Without the EITC, we estimate an additional 814,000 Californians would live in poverty, according to the latest data from the California Poverty Measure (CPM), an ongoing collaboration between PPIC and the Stanford Center on Poverty and Inequality. This reduction in poverty makes the EITC nearly comparable to CalFresh (formerly known as food stamps), the safety net program that keeps the most Californians out of poverty. Our estimates reflect data from 2013 to 2015 and do not include the state EITC, which was introduced in 2015 and expanded in 2017. The state EITC lowers poverty by very little because the largest credits go to workers with very low earnings, whose families mostly live well below the poverty line.

The role that the EITC plays varies widely across regions. Statewide, the poverty rate would be 2.2 percentage points higher without the EITC (22.6% instead of 20.4%). But in Lake and Mendocino Counties (combined), the poverty rate without the EITC would be 4.1 percentage points higher than it is currently, reaching 26.8%. Poverty in Marin County, on the other hand, would increase only 0.2 points, to 16.5%. Such differences could be due to several factors—for example, the share of eligible families who take advantage of the credit and the local availability of jobs.

PPIC recently released data showing poverty rates, poverty thresholds, and the effects of safety net programs not only by county, but also by state assembly and senate district and by US congressional district. These data provide an opportunity to dig more deeply into the varying roles of safety net programs across the state.

The EITC, for example, has the largest effect in some of the highest-poverty congressional districts, including District 40 (Rep. Roybal-Allard) and District 44 (Rep. Barragán). But in some relatively high-poverty districts it plays a smaller role (District 46, Rep. Correa). The data we provide can be a starting point for investigating—and potentially remedying—incomplete access to the EITC.


Farming Wetlands to Grow Birds

California has lost 95% of its natural wetlands. Managing what’s left is complicated by inadequate water and infrastructure. We talked to Ric Ortega, general manager for the Grassland Water District in the San Joaquin Valley, on what is needed to maintain wetlands in this difficult environment.

PPIC: What are California’s biggest challenges for managing wetlands?

Ric Ortega: About 25 years ago Congress directed the US Department of the Interior and the state to provide adequate, reliable water to the last remaining wetlands in California. But on average, only half of the spring and summer water required to meet the needs of wildlife is delivered. Drought years are far worse with most habitat remaining dry.

Remarkably, even the water that is available can’t always be delivered to the habitat. To mitigate for the impact of building the federal Central Valley Project, 19 wildlife refuges were established. Currently, five of the 19 refuges don’t have infrastructure in place to receive the water that is allocated to them.

Sadly, 14 refuges south of the Delta—including ours—are chronically short of water. It’s also getting more difficult to move refuge water supply through the Delta on a schedule that the wildlife requires. Maintaining timely Delta exports to refuges is critical, especially in drought years.

PPIC: What is your district doing to improve ecosystem conditions?

RO: The Grassland Ecological Area is home to the largest remaining block of wetlands in the west. It supports 300 species of birds, many of which overwinter and breed here. Our biggest challenge is delivering adequate water to the habitat when the plants and animals need it.

In good water years, we basically have to farm the remaining habitat to feed the 10 million birds that move through the Central Valley along the Pacific Flyway each year. What I mean by that is we try to maximize the productivity of the marsh, and that starts with growing the grasses that produce food for the birds. We need adequate spring and summer water to grow those grasses and provide breeding habitat.

Private landowners in our district manage their habitat to produce crops of beneficial food plants for migratory waterfowl. These efforts also benefit many other species—for example, the threatened giant garter snake and the endangered tri-colored blackbird. We work closely with farmers and partner groups like the California Waterfowl Association and Ducks Unlimited to leverage grant funding and share costs for habitat restoration projects and water supply improvements. And we work closely with organizations like Audubon and the Nature Conservancy to provide specific habitat for shorebirds and song birds at the right times of the year.

PPIC: What changes are affecting how your district manages water for ecosystems?

RO: Funding is becoming a larger problem.  The cost of buying and moving water has skyrocketed―our conveyance fees tripled during the drought. We rely on a “restoration fund” managed by the US Bureau of Reclamation. They use some of this to acquire water from willing sellers and also to deliver that water to the habitat. The fund also provides a vital revenue stream to our local economy—about $15 million goes to local agricultural districts that sell and move water to state, federal, and private refuges.

Implementation of the Proposition 1 water bond will be a huge step forward for California wetlands. It included $89 million to help build needed infrastructure so all refuges can receive their water supply. The water storage portion of the bond also has some projects that could help wildlife.

Our refuge’s water system is intricately linked with local agricultural water supply. As farmers get more efficient with their water use, less farm runoff is making it to the refuges. Also, with less water moving through the system, water quality degrades. We need to manage our water resources more in line with the hydrologic conditions at hand. Water conservation is paramount in dry times, but in wet years we should promote more flood irrigation to recharge the aquifer, spill into the marshes, and flush salts from the basins. We also need more flexibility to move environmental water around the state to support wildlife and the Pacific Flyway.

Learn more
Read “Reforming Water Management for the Environment” (PPIC Blog)
Watch a panel discussion on partnerships for healthy ecosystems (with Ric Ortega)
Visit the PPIC Water Policy Center’s Ecosystems resource page

Photo courtesy of Gary Kramer

Improving Community College Course Catalogs

Before the start of a new semester, students at California’s community colleges must sift through hundreds of courses and decide which ones will help them make progress toward their college and career goals. However, course prerequisites and program requirements can be complicated, and staff and counseling centers aren’t always readily available to help students make informed decisions. Course catalogs are a widely available resource at all 114 California community colleges—and improving these catalogs could help students better navigate their way through college.

Course catalogs contain most, if not all, of the information students need to build their college and career pathways. These resources are about 300 pages long on average and list detailed information about the college itself and the courses taught in a given academic year. They generally include degree and program descriptions, assessment and placement procedures, course prerequisites, credits earned per course, and much more. But course catalogs are often not structured in a way that makes this crucial information accessible.

Using clear flowcharts and diagrams is one way to help students understand the sequence of courses they need to take to achieve their academic goals. For instance, there is evidence that many students don’t fulfill math requirements, earn a degree or certificate, or transfer to a four-year university due to lengthy and confusing math course sequences. While most colleges depict course sequences using flowcharts and diagrams (88 out of the 114 colleges), there are still students at 26 colleges who have to figure out the appropriate sequence for themselves. San Jose City College has a good example of a flowchart that illustrates the sequence of math courses students need to take depending on their academic discipline—with different possible sequences for STEM and non-STEM majors (see p. 40 of the course catalog). Even among colleges that do provide helpful illustrations, less than half (46 colleges) provide them in a central resource like a college catalog. This adds an extra step for students who need to know which math courses will count toward their degree.

In addition, students on a vocational track may want to collect or combine different types of certificates within the same program. But only five colleges attempt to illustrate the course requirements for related degrees and certificates, and even then, the information is only available for a small number of programs. Including a diagram helps organize and distill this complicated set of information. For example, LA Trade Tech College designed a flowchart for the renewable energy program that shows how students can advance through and collect different degrees and certificates within a single program (see p. 120 of the course catalog).

There is a growing awareness that students need comprehensive tools that will allow them to make informed course selections. As part of the Guided Pathways project—which aims to better align campuses’ program structures with those of four-year colleges and the needs of the labor market—20 California community colleges are using “program maps” that include clear course sequences and academic milestones to help streamline students’ decision-making process. Leveraging the course catalog to make key information more accessible is another way that colleges can help students more efficiently achieve their college and career goals.

Visit the PPIC Higher Education Center.

The President’s Popularity and the Midterm Election

California is a battleground state in the 2018 midterm election. When it comes to determining the party that will lead the next US Congress, all eyes are on the 14 US House seats that are currently held by Republicans in the deep-blue state of California. Democrats would need to “flip” several of these seats if they have any chance of taking control of the US House, where Republicans currently now have a 26-vote margin. The party in power has typically lost some of its congressional seats in national midterm elections. Whether it is a few seats or many is closely tied to the president’s popularity. So, how is Donald Trump viewed in California at the end of his first-year anniversary in office?

The PPIC Statewide Survey has been tracking President Trump’s popularity, asking the following question in six monthly surveys in 2017, “Overall, do you approve or disapprove of the way that Donald Trump is handling his job as president of the United States?” We found majority disapproval of President Trump among California likely voters in each survey. In the January 2017 PPIC survey, conducted in his early days in office, 34% approved and 55% disapproved of his job performance. In the 2017 December PPIC survey, which is our most recent poll, 34% approved and 63% disapproved of President Trump. In the course of 2017, disapproval of the president increased as more likely voters formed opinions about his leadership.

By the end of the first year, we also found that disapproval of President Trump increased by double digits in several likely voter groups. In comparing the January 2017 PPIC survey to the December 2017 PPIC survey, disapproval increased

  • 21 points for those younger than 35 (63% to 84%)
  • 15 points among independent (i.e. no party preference) voters (50% to 65%)
  • 12 points among college graduates (62% to 74%)
  • 12 points among those who earn under $40,000 a year (57% to 69%)
  • 11 points for those who earn $80,000 or more (55% to 66%)
  • 10 points among Latinos (72% to 82%)

Moreover, from January to December 2017 disapproval became the majority response among men (49% to 58%), those age 55 and older (49% to 57%), and those with some college education (50% to 58%).

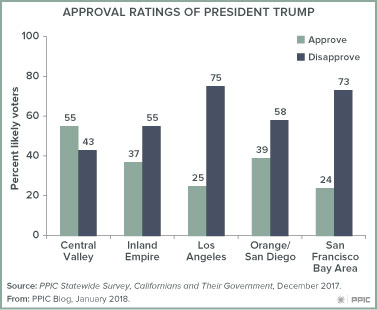
Regional trends in presidential disapproval ratings also point to a challenging environment for Republicans running in House elections this year. Predictably, there is overwhelming disapproval of President Trump in the Democratic strongholds of Los Angeles (75%) and San Francisco (73%) in the December 2017 PPIC survey. More surprisingly, over the course of 2017 disapproval of Trump’s performance increased to majority levels in Orange/San Diego (50% to 58%) and the Inland Empire (39% to 55%), where several of the House seats that are now held by Republicans are located. Coincidentally, two Republican House members in Orange/San Diego decided not to run for reelection.

There are two bright spots for Republicans in the president’s approval ratings. First, President Trump has held a solid base of support among Republican likely voters, according to a comparison of the January 2017 PPIC survey (76% approve) and the December 2017 PPIC survey (78% approve). Second, his approval increased to a majority in the Central Valley according to a comparison of the January 2017 PPIC survey (40%) and the December 2017 PPIC survey (55%). Importantly, several of the House seats now held by Republicans are in the Central Valley.

Finally, in placing the 2018 midterm election in recent historical context, it is especially noteworthy that the level of disapproval of President Trump at the end of his first year in office is relatively high compared to the past two US presidents. The December 2009 PPIC survey found that a majority of California likely voters approved of President Barack Obama (54% approve, 40% disapprove) in the midst of the Great Recession. The December 2001 PPIC survey found that overwhelming majorities approved of President George W. Bush (78% approve, 20% disapprove) in the wake of the 9/11 terrorist attack.

In California, the combination of presidential disapproval ratings (63%) and voter registration trends (45% Democrat to 26% Republican) sets the stage for the Republicans’ efforts to hold on to House seats to maintain control of the US Congress. However, the wildcard in the 2018 California election is the size and composition of the voter turnout—and in the 2014 midterm election, turnout hit a record low.

The PPIC Statewide Survey will be closely monitoring President Trump’s approval ratings, as well as indicators of the voters who are motivated to cast ballots in what will be a consequential election for California and the nation.

Video: Travis Allen’s Priorities

Mark Baldassare, PPIC president and CEO, asked Assemblymember Travis Allen, candidate for governor in 2018, to name the top three issues with major consequences for the state’s future—a question Baldassare has asked of all gubernatorial candidates appearing before PPIC audiences. Allen said his top priorities would be

  • Cutting taxes
  • Getting tough on crime, and
  • Fixing roads and expanding freeways

Allen, who is campaigning to repeal the state gas tax increase passed last year, said California is already collecting enough tax revenue to improve roads and unclog the freeways.

“We can fix our roads, we can expand our freeways, we don’t need to raise taxes further to do it,” he said. He added that voters should be the ones to decide if they want to raise taxes.

The conversation with Allen is part of the PPIC Speaker Series on California’s Future. PPIC is inviting all major candidates for governor to participate if they reach a certain threshold in the polls. The goal is to give Californians a better understanding of how the candidates intend to address the challenges facing our state.

Watch all candidate videos

Information Gaps Hinder Progress on Safe Drinking Water

The short answer to the question, “How many Californians lack access to safe drinking water?” is, “Too many.” Everyone deserves to have ready access to clean water. But understanding the extent of the problem is less straightforward. Some recent strides have been made in compiling data on communities with drinking water violations, but more work is needed to help scope solutions, prioritize actions, and track progress.

The biggest data gaps are for domestic wells or very small water systems that are not regulated by the federal Safe Drinking Water Act (SDWA). Estimates of this population vary widely—from 1 to 2 million—and the state lacks good data on how many of these residents face water safety problems. Developing tracking systems for this population is an ongoing priority.

California also has data gaps for the thousands of water systems regulated by the SDWA that serve the vast majority of the state’s residents: community water systems with more than 15 connections and other public systems such as schools. The State Water Board’s new Human Right to Water (HR2W) portal reports monthly compliance, population served, location, and pollutants present in the water. It provides an easier way to see which systems are currently failing to meet safe drinking water standards. But information gaps in the new system make it hard to translate the data into action.

As of November 2017 this portal showed that just over 300 water systems, serving roughly 490,000 people, were out of compliance. About 13% of these systems are schools, serving roughly 13,000 people; the rest are community water systems. More than 90% of the non-compliant community systems are small, serving fewer than 3,300 people; 75% serve fewer than 500 people. Small systems are more likely to violate drinking water standards and to lack the technical, financial, and managerial capacity to resolve these issues on their own.

While the HR2W portal provides a valuable snapshot, it falls short of providing the detail needed to understand and track drinking water challenges in public systems. The information is not organized to enable users to see relevant patterns, such as long-running violations or multiple violations per system. Knowledge of safe drinking water regulations is required to parse which systems are in the most trouble. This tool would be more useful if the data were summarized by water system, with an overview of how long a system has been out of compliance and how serious the violations are.

A useful model for organizing safe drinking water data comes from the US Environmental Protection Agency, which publishes Enforcement and Compliance History Online (ECHO) to track a variety of regulatory programs. ECHO reports the number of quarters within the past three years in which drinking water systems were out of compliance. It also uses a point system to reflect the seriousness of the problem. For instance, systems exceeding standards for nitrate and pathogens get 10 points per violation, since EPA considers those problems most acute. Systems exceeding less serious standards get 5 points per violation, and each monitoring and reporting violation gets 1 point. Points accumulate for issues that remain unaddressed. ECHO provides a compliance summary for each system, and enables the user to drill down into violation details.

Using information from ECHO, we find that more than 80% of California’s non-compliant drinking water systems, serving 280,000 residents, have been out of compliance for at least three years (see figure). Nearly three-quarters of these systems have at least 20 unaddressed violation points. As expected, problems are most persistent and severe in small—and especially very small—systems. And they are most prevalent in the San Joaquin Valley—home to roughly 10% of California’s population and nearly half of the state’s non-compliant water systems.

California should draw from the federal ECHO model to improve its HR2W. The state might want to customize the ECHO point system to reflect local conditions―for instance, where state standards are stricter than federal standards. The state is working on adding new metrics, such as water affordability, to HR2W. Additional priorities include providing indicators of progress in addressing violations, such as funds allocated. And instead of flagging only systems that have a safety violation, the state could track systems that are behind on monitoring and reporting because this could foreshadow future violations of water quality standards.

More accessible and transparent data would help build momentum for action. This is especially important in light of ongoing efforts to create a sustainable funding source for safe drinking water in affected communities—such as the current legislative proposal to levy surcharges on agricultural chemicals and urban water bills. Such a program would require a robust tracking system for efficient governance of the funds. With some improvements, HR2W could help prioritize actions and investments in communities that need it most.

Legislative District Data Offers Close-Up View of Poverty

Poverty varies widely across California’s 58 counties—from 13.1% in Placer County to 24.9% in Los Angeles County—according to data from the California Poverty Measure (CPM). The CPM is an ongoing collaboration between PPIC and the Stanford Center on Poverty and Inequality that adjusts for differing housing costs across counties and incorporates major social safety net programs like CalFresh food assistance and the Earned Income Tax Credit (EITC).

For the first time, PPIC recently released CPM data showing poverty rates and the effects of safety net programs not just for counties, but also for state assembly and senate districts and US congressional districts.

Congressional districts provide a more detailed view of densely populated areas. While counties have static geographic boundaries, California’s congressional districts are adjusted after every decennial census to equalize their populations (in 2010, each of the 53 districts contained 702,905 people). This means that Los Angeles County’s 9.9 million residents, for example, vote in 18 different congressional districts. The county’s average poverty rate of 24.9% reflects both the 13.4% in poverty in District 33 and the 37.0% in District 40, a stark difference illustrated in the map below.

As might be expected, district-level data show even wider geographic variations in poverty than county-level data, from 12.4% in District 15, which includes parts of Alameda and Contra Costa Counties, to 37.0% in District 40, in Los Angeles County. The CPM also shows that without safety net programs, the variation would be even more extreme, ranging from 16.2% in District 33 to 50.3% in District 40.

While counties often take the lead in implementing programs that mitigate poverty, many funding decisions related to social safety net programs are made at the state and federal levels. Understanding the distribution of poverty can help policymakers at all levels develop short- and long-run strategies to alleviate it in every area of the state.

A Look Back at the Year in Water Policy

A year of extreme events—from heavy rains that strained dams to high heat and massive wildfires—revealed the many ways California’s variable climate can impact water management. In 2017 the PPIC Water Policy Center explored how the state is managing such extremes and suggested improvements to help us prepare for an even more volatile future climate. Here are a few highlights.

  • Our evaluation of California’s urban water systems revealed that they have become adept at drought management thanks to diversified supplies, cooperation with neighbors, and programs to manage demand. But the state’s conservation mandate in 2015 opened a debate on how to manage water scarcity. We reviewed evolving state and local roles in urban drought management and described areas for improved cooperation to strengthen resilience.
  • Five dry years took a toll on groundwater, a critical drought reserve. Some farm areas saw steep declines in local aquifers. Our assessment of water stress in the San Joaquin Valley—California’s largest agricultural region and “ground zero” for groundwater concerns—summarizes sustainable management solutions. Our survey of groundwater recharge practices by valley water suppliers sheds light on what more can be done to advance recharge efforts.
  • The state’s headwater forests are in poor health and at increased risk of severe wildfire. Our review of current management practices explains steps needed to shift the emphasis from fire suppression to forest management and how to pay for these improvements.
  • The way California manages water for the environment is focused on responding to crises rather than building capacity to weather future dry spells. We undertook an in-depth evaluation of how to improve conditions for native fish and reduce conflict over water for the environment. We also proposed a better way to account for environmental water, with an example from the Sacramento–San Joaquin Delta.

The PPIC Water Policy Center’s efforts were collaborative in nature—involving research teams from across California and conversations with policy makers, water managers, and other stakeholders—and we broadened the conversations through a series of public events.

This year will bring major decisions on funding for safe drinking water, investing in water storage, sharing scarcity on the Colorado River, and conveying water through the Delta. To help inform the debate on these and other complex issues, we created a policy brief that summarizes problem areas and priorities for action. This brief was released in conjunction with our second annual water conference, which brought together leaders from across the state to discuss the ways forward.

Looking ahead, the water team is working on the potential effect of climate change on future droughts, pathways to water sustainability in the San Joaquin Valley, and the impact of drought on water quality and wastewater management.

The mostly dry December has left many wondering what 2018 will bring. But one thing is certain: we’re thankful for the opportunity to promote creative and collaborative solutions to California’s most difficult and pressing water challenges. And we are thankful for your support of this important work.

With best wishes for 2018,

Ellen Hanak

P.S. If you’re not yet receiving our weekly blog post by email, you can sign up here. And if you’d like to support the center’s work, learn more here.

Majority Opposition to Drilling Includes Coastal Republicans

In yet another sign that the shifting federal policy landscape is at odds with California public opinion, the Trump administration is proposing new offshore oil and gas drilling across all of the nation’s coastal waters. The five-year leasing plan includes areas previously off limits to oil and gas exploration since the 1980s. It proposes to open up 90% of the nation’s offshore reserves through new federal leases. California’s governor, lieutenant governor, attorney general, and US senators—quick to voice their opposition to this proposal—are aligned with most Californians’ views on offshore oil drilling.

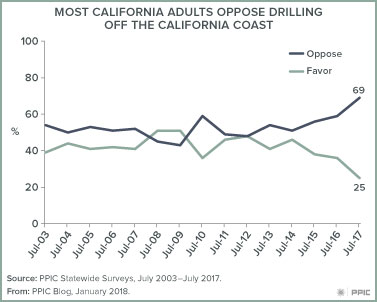
The PPIC Statewide Survey has asked the question, “Do you favor or oppose allowing more oil drilling off the California coast?” every July since 2003. In the 2017 PPIC survey, a record low 25% of California adults favored more oil drilling off the California coast while a record high 69% opposed it. What’s most remarkable is the agreement over time on the topic of offshore oil drilling. Since the early 2000s, a slim majority has been in favor of drilling only twice (51% in 2008 and 2009); in most years a majority has opposed it. Moreover, public consensus on this topic has grown. Since July 2012, support for more oil drilling has dropped by 23 points (48% to 25%) while opposition has grown by 21 points (48% to 69%).

In the 2017 PPIC Survey, a surprising level of agreement on the topic occurred across all major demographic categories of California residents. Majorities were opposed across age, education, gender, income, and racial/ethnic groups. Strong majorities across the state’s major regions opposed more drilling. That includes coastal Californians (23% favor, 72% oppose) and inland Californians (29% favor, 64% oppose) alike.

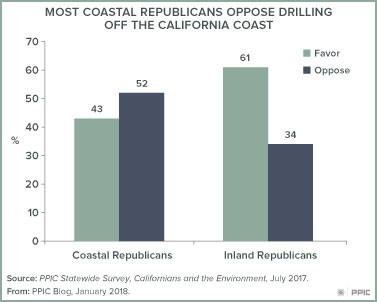
It is often said that the Trump administration is “playing to its base” in a polarized environment by proposing policies that are clearly at odds with Californians’ views. However, we found in the 2017 survey that majorities of conservatives, moderates, and liberals alike (55%, 71%, 83%, respectively) opposed more oil drilling off the coast. Democrats (14% favor, 81% opposed) and independents (30% favor, 68% opposed) were strongly opposed, while Republicans were divided (50% favor, 45% oppose). However, majorities of coastal Republicans joined with other regional and political groups in opposing more offshore oil drilling.

What’s behind the solid public opposition to more offshore oil drilling in California? In the 2017 PPIC Survey, 73% of California adults said that the condition of the ocean and beaches was very important to the economy and quality of life for California’s future. We found that those who held these views—and they were widely held across political, demographic, and regional groups—were overwhelmingly opposed to more offshore oil drilling.

Stay tuned as the PPIC Statewide Survey monitors this topic and other issues—such as the Affordable Care Act, climate change and energy, federal tax reform, marijuana legalization, and immigration—as changing federal policies may have big effects on California. We are planning for an interesting and important year for PPIC polling in 2018!