
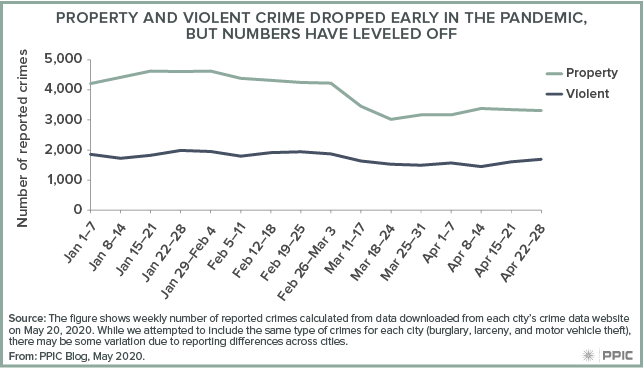
After large decreases in March, the latest numbers on crime in the wake of COVID-19 mostly point towards a leveling off, with continuing lower rates for four California cities—Los Angeles, Oakland, San Diego, and San Francisco. There are a few exceptions, such as commercial burglaries, which rose by about 37%.
Swings in crime numbers stem from many factors under any conditions, and certainly during a pandemic. With improved weather and possible shelter-in-place fatigue, more people—potential victims and perpetrators—are out. The dire economic situation may be a factor, while state and local directives, such as zero bail, an issue of heightened concern within law enforcement, may be another.
Data on crime in these four large cities cover rates through April 2020. They represent preliminary numbers that are subject to revision before they are submitted to the California Department of Justice as part of the state’s official crime statistics. Furthermore, the numbers do not represent all of California.
A closer look shows that violent and property crimes broadly leveled off in April, after falling from February through March. In particular, violent crimes fell from 1,881 in February to 1,603 in March, and then came down slightly to 1,580 in April—a decrease of 16% since February. For property crimes, the number dropped from 4,294 in February to 3,399 in March, then fell somewhat further in April to 3,302, for a total February-to-April drop of 23.1%.
Within these broader categories, some crime was on the uptick in April. While burglaries fell by 1.3% from February to March, the weekly number rose by 9.3% in April compared to February. This increase is primarily driven by commercial burglaries, up by 21.2% in March relative to February and up by 37.5% in April, again relative to February. Car theft is also up: after declining by 4.2% between February and March, it rose in April and is now 8.5% higher than in February.
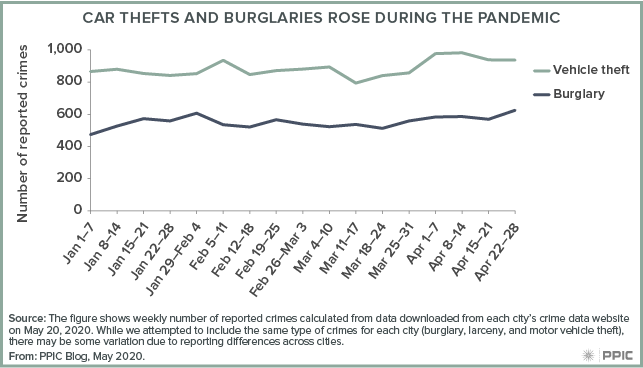
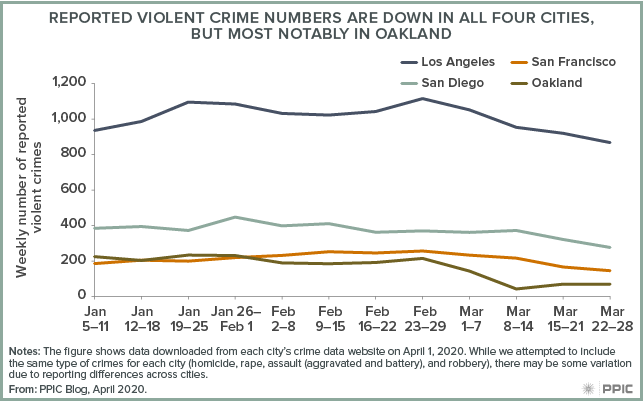
The changes in crime numbers vary across these cities. For example, while commercial burglary is up in all four cities, the rise in vehicle theft is driven by Los Angeles, where the number of stolen vehicles increased from 352 to 363 and then 468 in February, March, and April; or up 32.9% compared to February. In Oakland, reported assaults rose in April; after dipping to 96 per week in March—from 116 in February—the average weekly number of assaults climbed to 129 in April. And while still below pre-pandemic numbers, assaults in Los Angeles in late April were higher than in March, up from 766 to 805 on average per week.
As crime in these four cities seems to be hovering at low rates, at or below the pre-pandemic numbers, there is no evidence yet that efforts like zero bail, which went into effect April 13, led to broad increases in crime. However, as some crimes are on the uptick, they deserve attention to determine whether they are part of common swings in crime numbers or early signs of reversing trends. If reversals are indicated, now is the time to identify contributing factors and investigate effective solutions.


 While reforms were unquestionably needed—the state faced a possible federal order to release more than 30,000 prisoners early—critics have voiced concerns that public safety may be negatively affected and have asked whether less incarceration would reverse California’s long-term decline in crime rates.
 How can we explain these differences? Before rushing to conclusions, there are several questions that need to be answered first. How have reforms affected factors such as arrests and incarceration? Do these differ across counties and what is their relationship to crime rates? Also, California’s crime trends may be affected by factors unrelated to recent reforms. How do statewide trends compare to what other states are seeing? Finally, have California’s reforms improved outcomes for those released from our jails and prisons? If so, this could help lower crime rates in the coming years. Our goal at PPIC is to address these important questions in our upcoming research.

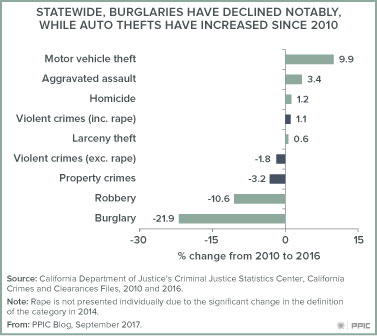
 The data strongly indicate that Proposition 47 is a major factor in these changes. First, monthly arrest data show abrupt changes in drug and property arrests in November 2014, the month Proposition 47 went into effect. Second, the drop in felony arrests was almost exclusively for drug and property offenses, while the increase in misdemeanor arrests was almost entirely for drug and property offenses. Arrests for motor vehicle theft, which continues to be a felony after Proposition 47, is the only area of increase. Possibly in response to the 13% increase in auto thefts in 2015, motor vehicle theft arrests went up by 26%.
 Chart note: Changes in the number of violent and property crimes per 100,000 residents, January–June 2015 compared to January–June 2014. The table includes the 25 largest US cities included in the FBI data with crime statistics for both 2014 and 2015, ranging from New York City, with a population of 8,473,938, to Kansas City, MO, with a population of 468,417.
 Our survey shows that many Californians believe—incorrectly—that prisons and corrections account for the largest share of state spending. When asked to select the largest spending area of the state budget, California likely voters are most likely to choose prisons and corrections (41%)—this is consistent with our findings over the past several years. In fact, the allocation for prisons and corrections in the governor’s 2016–17 budget proposal ($10.6 billion) comes in behind higher education ($14.6 billion), health and human services ($33.7 billion), and K–12 education ($51.2 billion).


 Since reaching its peak in 2006 of about 163,000, the institutional prison population has dropped dramatically, by slightly more than 49,000. The court order mandated that inmate population be reduced to 137.5 percent of design capacity, or the number of inmates the facilities were intended to house.
 California has indeed seen a significant decrease in the reliance on incarceration over the last decade through policies like SB 678 and realignment, as well as initiatives like 2012 Proposition 36 (which revised California’s “Three Strikes” law) and Proposition 47. Our total incarceration rate has dropped from about 702 per 100,000 residents in 2006 to about 568. Unfortunately this is not reflected in the state’s expenditures. In fact, spending on corrections is now at a historic high. A look at corrections spending going back to the 1970s shows a long-term increase. In the current budget year, the state is spending more than $12 billion on corrections. In other words, meeting the federally mandated target does not mean that California has solved its incarceration problem.