Many Low-Income Families Left Out of Federal Stimulus Benefits

As part of the federal response to COVID-19, the IRS has started issuing stimulus checks—to boost consumer confidence—directly to millions of families. For the record number of Californians who have lost jobs, hours, and certainty around their incomes, these payments could come just in time.

We estimate that about 81% of Californians live in a family that will receive an “economic impact payment,” with the typical family receiving around $2,200. In total, Californians could receive about $26 billion through the program.

However, nearly 20% of families are unlikely to receive a stimulus check. Because the payments phase out as incomes rise, most of these families are above the income cutoff ($99,000 for single tax filers and $198,000 for joint filers without children). But nearly a third are among the state’s lowest income families. In part, this reflects the fact that only people who have filed taxes recently, or who receive either supplemental security income (SSI) or social security, will receive a check.

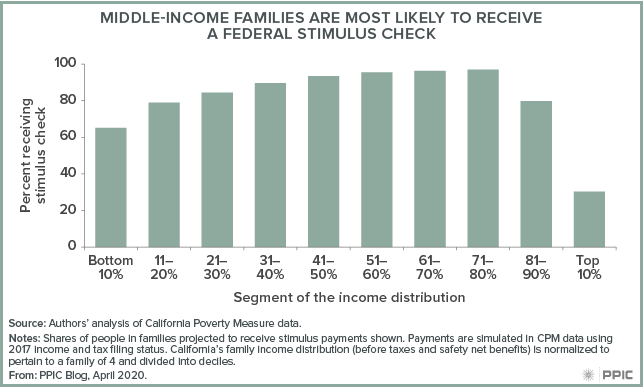
People with very low incomes are not required to file taxes, and they will not receive stimulus checks unless they actively share their banking details with the IRS. Partly for this reason, our estimates indicate that just 65% of people in families with the lowest 10% of incomes—less than about $22,000 a year for a family of four—are likely to receive a check.

By comparison, 90% to 97% of those in middle-income families—with annual incomes of $52,000 to $176,000—are likely to receive a check.

figure - Middle-Income Families Are Most Likely To Receive a Federal Stimulus Check

Yet even if all Californians who do not file taxes submit their information to the IRS, people in low-income families will still receive checks at lower rates than middle-income families. Because many low-income families include undocumented residents, the entire family is ineligible for these federal payments. If families with undocumented members were eligible, all families from the 11th to 80th percentiles of the income distribution could potentially receive a check.

To help Californians during this crisis, the state’s safety net will need to reach those most affected economically. The temporary expansion of unemployment insurance will provide much more aid to certain low-income families than the federal stimulus payments. And California’s recently announced Disaster Relief Fund, which will use public and private funds to provide up to $1,000 per household to families of some undocumented immigrants, will help to fill in certain gaps. But while replacing wages is important, a response focused only on wages would skip many people in need.

Food assistance programs like CalFresh and school meals are also critical safety net supports because of their wide reach, and expansions are also underway. Along with the federal stimulus payments, these are important steps, but—depending on the length and the depth of the crisis—more remains to be done.

Feeding Children When Schools Are Closed for COVID-19

By state law, all public schools in California must provide at least one nutritionally adequate meal to students—however, many students eat more than one meal a day at school. Nearly four million students received meals from California’s public schools in the 2018–19 school year: close to 300 million breakfasts and well over 500 million lunches. With schools closed to reduce exposure to the new coronavirus, many students now lack ready access to these meals.

By federal law, low-income students (about $48,000 for a family of four in 2020) are eligible for free or low-cost school meals. Higher income students paid on average $0.98 for breakfast and $2.11 for lunch in 2017–18, according to the California Department of Education.

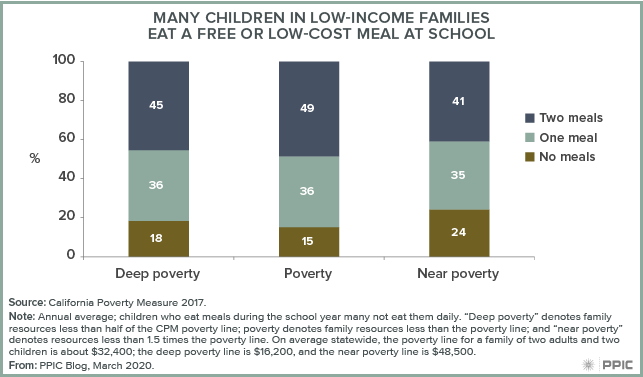
The vast majority of low-income students eat some or all breakfasts, lunches, or both at school. Free and reduced-price meals lower food insecurity, and according to the California Poverty Measure (CPM), meaningfully reduce poverty among families with public school students. Without school meals, the share of students living in deep poverty would be 17% higher; increases for students in less severe poverty would be 2% to 8%.

figure - Many Children in Low-Income Families Eat a Free or Low-Cost Meal at School

With school closures in place for several weeks, school districts have already designated sites where families can pick up meals for children. In higher poverty areas, all children can access meals regardless of enrollment in the local school or eligibility for meal programs because authorities have temporarily relaxed federal regulations.

During closures, Governor Newsom assured that schools will continue to receive state funds to operate and requested efforts focus on certain areas, including providing school meals. However, access remains a concern. For example, Los Angeles Unified School District lists 64 “grab-and-go” sites for its roughly 1,000 schools. San Diego Unified School District has 13 sites for 181 schools, as of March 16. Elk Grove, with 67 schools, has 34 sites for drive-through and grab-and-go meal services along with a mobile service for families with limited transportation.

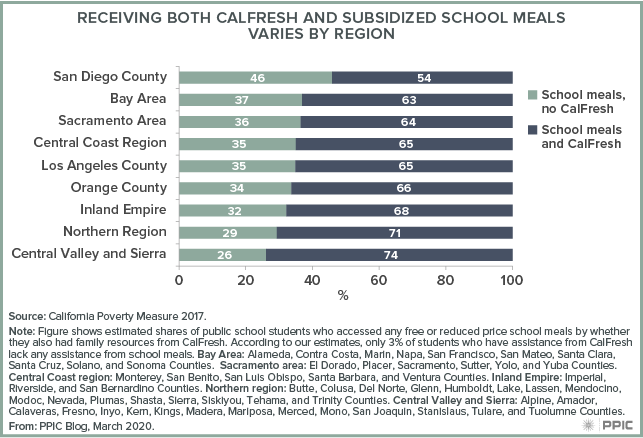
With pandemic EBT (P-EBT), ATM-like cards pre-loaded with funds for groceries, the federal government is also helping low-income students replace missed school meals. The cards will cover the expected number of days that schools will be closed. For students whose families already receive monthly CalFresh benefits on EBT cards, funds can readily be added. For low-income students who do not already receive CalFresh (34% statewide), families must complete some paperwork—mainly electronically—to obtain an EBT card.

Because the reach of CalFresh varies across the state, barriers to getting P-EBT funds to students will also vary. Fortunately, the state already matches student data with their CalFresh, CalWORKs, and Medi-Cal data to automatically determine students eligible for free and reduced-price school meals. If the state can use all existing sources of family income to provide P-EBT to students, they will reach more low-income students.

figure - Receiving Both CalFresh and Subsidized School Meals Varies by Region

Ready access to meals influences student health, learning, and economic wellbeing. Robust access to free and reduced-price meals can decrease the stress low-income families are facing as efforts to limit the spread of COVID-19 dampen economic activity.

The COVID-19 Crisis Is Affecting Low-Income Workers

As California responds to COVID-19, its low-income workers face particularly urgent difficulties. These Californians are not necessarily at high risk of health complications from COVID-19, but they will be deeply affected by the economic consequences of the steps being taken by cities, counties, and regions to contain the outbreak and protect public health.

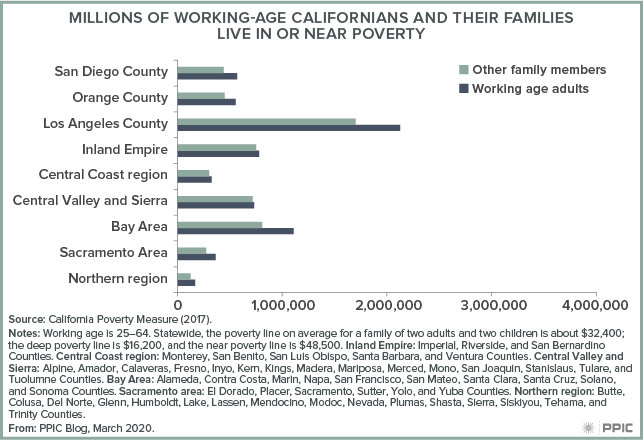
About 12.3 million Californians in families headed by working age adults live in or near poverty; a majority (58%) are Latino, while 21% are white, 12% are Asian, 6% are African American. About 1.5 million live in deep poverty (with resources less than half of the poverty line), while 4.3 million are just below the poverty line and 6.5 million are just above it (within one and one and a half times the poverty line).

The largest number of poor and near-poor Californians live in Los Angeles County (about 4 million), followed by the Bay Area (about 2 million).

figure - Millions of Working-age Californians and Their Families Live in or Near Poverty

The federal and state governments have been developing a range of short-term measures that promise to bolster the resources of Californians who are economically affected by this public health emergency. These measures include the expansion of food assistance benefits, paid sick leave, and unemployment benefits.

Steps like these are important because 12.2% of California’s working adults live in poverty, and after-tax income from work makes up 72% of poor and near-poor family resources, on average. A loss of $500 in annual income would push an additional 215,000 Californians into poverty, while a loss of $1,000 would put an additional 425,000 Californians below the poverty line. In short, even a relatively small financial loss can make a big difference.

Interactive: Many Californians Live in or Near Poverty

[vc_row][vc_column][vc_column_text]More than 7 million Californians are “near poor”: out of poverty, but within 1.5 times the poverty line, according to the California Poverty Measure. The near-poor population is slightly larger than the poor population, and many could be pushed into poverty by small expenses.

In California, a near-poor family of four who rents has annual resources that range between $32,500 and $48,800. Adults with less education and fewer work hours, renters, African Americans, and Latinos often have the highest poverty and near-poverty rates. Disparities that persist across poor and near-poor groups are reminders that the poverty threshold is not a hard line where economic hardship ends.

Among adults, full-time work does not remove the risk of poverty: 21% of people ages 25–64 working full-time, full-year jobs are in or near poverty. These full-time workers are more likely to live in near poverty (13.9%) than in poverty (7.1%). At the same time, adults in less than full-time jobs live in near poverty at about the same rate (19.7%) as those with no work (20.9%). But they are less likely to live in poverty (22.3%) than those with no work (32%).[/vc_column_text][/vc_column][/vc_row][vc_row max_width=”80″ visibility=”visible-desktop”][vc_column][vc_column_text]

[infogram id=”1p9yd5nm9kxnddf7zryd5dqnp1b3xnwkjnq?live”]

[/vc_column_text][/vc_column][/vc_row][vc_row max_width=”80″ visibility=”visible-tablet-landscape”][vc_column][vc_column_text]

[infogram id=”1p9yd5nm9kxnddf7zryd5dqnp1b3xnwkjnq?live”]

[/vc_column_text][/vc_column][/vc_row][vc_row visibility=”visible-tablet-portrait”][vc_column][vc_column_text]

[infogram id=”1p9yd5nm9kxnddf7zryd5dqnp1b3xnwkjnq?live”]

[/vc_column_text][/vc_column][/vc_row][vc_row visibility=”visible-phone”][vc_column][vc_column_text]

[infogram id=”1p9yd5nm9kxnddf7zryd5dqnp1b3xnwkjnq?live”]

[/vc_column_text][/vc_column][/vc_row][vc_row][vc_column][vc_column_text]Resources from social safety net programs play a substantial role in moving people out of poverty—2.7 million more Californians would be poor if not for the social safety net. However, many of those moved out of poverty nonetheless live in near poverty, as broader factors like the cost of housing and available jobs play key roles in the resources they have on hand.

As California policymakers address poverty through tax credits, safety net programs, and housing policies, near-poverty rates provide another view into the state’s lowest-income populations. Reducing poverty in California will require attention to how families can be lifted out of poverty and also positioned for long-term economic security.[/vc_column_text][/vc_column][/vc_row]

For Many Californians, Poverty Is One Minor Expense Away

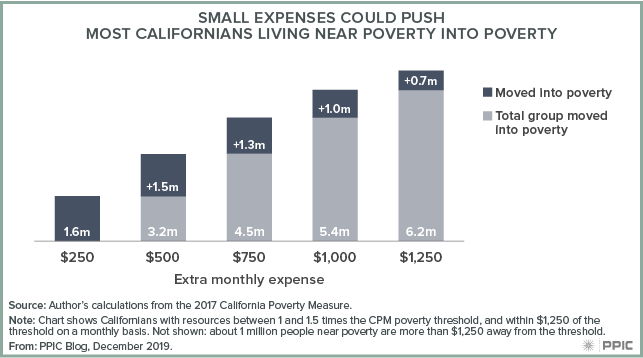
Add one extra expense and families living just above the poverty line could fall into poverty. Data from the California Poverty Measure (CPM) show that 7.2 million Californians live near poverty, that is, with just enough resources to meet their basic needs. All told, in 2017 as many Californians lived just above the poverty line as below it, or about 18% in each case. Even a small change, a monthly expense of $250 or less, could push 1.6 million people under the line.

We define “near poverty” to mean having resources worth 1 to 1.5 times the poverty threshold after taxes and necessary expenses. Since the CPM accounts for California’s varied living costs, the range for near poverty differs across regions. In Fresno County, a family of four who rents their home and has $25,900 to $38,900 in resources is near poverty, while in Santa Clara County, the same is true of a family of four with $40,000 to $60,000.

Because the poverty line is a blunt standard, “near poverty” includes families earning just a few dollars above the poverty threshold—even though a few dollars are unlikely to make it easier to make ends meet. This makes it especially important to understand how many Californians are near poverty, and how close those near poverty are to falling into it.

Californians can be pushed into poverty by the smallest expenses. Overall, people near poverty are more likely to be pushed into poverty by a small expense than a large expense. As expenses grow, the total number of people threatened climbs. Three out of four people near poverty, or 5.4 million, are pushed into poverty by an extra $1,000.

figure - Small Expenses Could Push Most Californians Living Near Poverty into Poverty

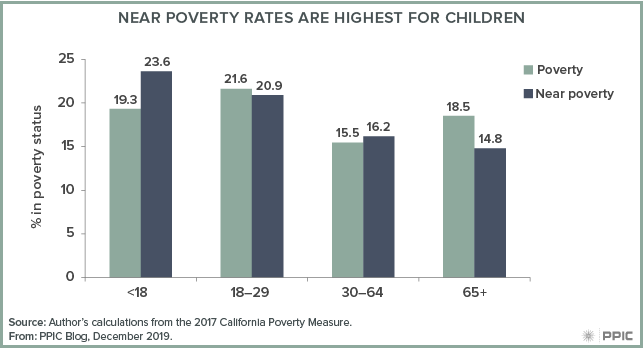
Near poverty affects young people more than it does older Californians, and children under 18 are more likely to be near poverty (23.6%) than in poverty (19.3%). Young adults and seniors, however, are more likely to be in poverty. Regional differences in living costs, opportunity levels, and the impact of existing policies and programs are key factors driving this variation.

figure - Near Poverty Rates Are Highest for Children

Without safety net programs, more people, and in particular, more families with children, would face poverty instead of near poverty: resources from programs including CalFresh and the federal and state Earned Income Tax Credits (EITCs) keep 7.1% of Californians out of poverty. Yet almost all people (93%) who move out of poverty via the safety net move into near poverty. This fact has implications for policymakers’ ongoing efforts to help ensure all Californians can meet their basic needs. As the state works to reduce poverty, strategies that promote economic mobility complement investments in programs like the CalEITC and the new Young Child Tax Credit.

Video: Understanding Poverty in California

[vc_row][vc_column][vc_column_text]

Despite a booming economy, millions of Californians live in or near poverty. In this video, PPIC research associate Tess Thorman gives an overview of poverty and child poverty in the state, using the latest figures from the California Poverty Measure (CPM).

The CPM is a joint research effort by PPIC and the Stanford Center on Poverty and Inequality that provides a comprehensive look at economic well-being in our state. By accounting for cost of living differences across the state as well as earnings and other family resources—including safety net benefits—the CPM offers valuable insights into the ability of Californians to meet basic needs and be financially secure.[/vc_column_text][/vc_column][/vc_row][vc_row visibility=”hidden-phone”][vc_column][vc_video link=”https://youtu.be/tPh4xE7QLGo” el_width=”70″ align=”center”][/vc_column][/vc_row][vc_row visibility=”visible-phone”][vc_column][vc_video link=”https://youtu.be/tPh4xE7QLGo”][/vc_column][/vc_row][vc_row][vc_column][vc_column_text]To learn more about poverty in California, visit ppic.org/poverty.[/vc_column_text][/vc_column][/vc_row]

Interactive: A Look at Child Poverty across California

[vc_row][vc_column][vc_column_text]Governor Newsom’s first budget proposal included notable efforts to address poverty—especially child poverty—by increasing CalWORKs cash assistance grants, expanding assistance to low-income parents pursuing higher education, and further expanding the state’s Earned Income Tax Credit (CalEITC, which he proposed renaming the Working Families Tax Credit).

California has a troublingly high child poverty rate of 21.3%, or about 1.9 million children, according to our latest estimates from the California Poverty Measure (CPM). The CPM is a joint research effort between PPIC and the Stanford Center on Poverty and Inequality that, unlike official poverty metrics, takes into account the cost of living and benefits from social safety net programs.

While poverty rates in the state are also high, child poverty rates tend to be even higher, particularly in the most populous counties. For example, in Los Angeles County, 24.3% of all residents—but 27.8% of children—live in poverty. Altogether, 17 counties, 29 congressional districts, 21 senate districts, and 42 assembly districts have child poverty rates of more than about 20%.

State and federal policies play an important role in lowering child poverty. Our estimates indicate that over a third (35.3%) of children would be in poverty, were it not for programs like CalFresh food assistance, the federal and state Earned Income Tax Credits, and CalWORKs cash assistance. PPIC research also shows that new policies could reduce child poverty even further, although effects vary across the state. We will continue to track and analyze poverty and child poverty to provide this critical information to policymakers and stakeholders.[/vc_column_text][/vc_column][/vc_row][vc_row][vc_column][vc_raw_html]JTNDZGl2JTIwY2xhc3MlM0QlMjd0YWJsZWF1UGxhY2Vob2xkZXIlMjclMjBpZCUzRCUyN3ZpejE1NDc4MjcxODU1NTglMjclMjBzdHlsZSUzRCUyN3Bvc2l0aW9uJTNBJTIwcmVsYXRpdmUlMjclM0UlM0Nub3NjcmlwdCUzRSUzQ2ElMjBocmVmJTNEJTI3JTIzJTI3JTNFJTNDaW1nJTIwYWx0JTNEJTI3JTIwJTI3JTIwc3JjJTNEJTI3aHR0cHMlM0ElMjYlMjM0NyUzQiUyNiUyMzQ3JTNCcHVibGljLnRhYmxlYXUuY29tJTI2JTIzNDclM0JzdGF0aWMlMjYlMjM0NyUzQmltYWdlcyUyNiUyMzQ3JTNCQ2glMjYlMjM0NyUzQkNoaWxkUG92ZXJ0eWJ5Q2FsaWZvcm5pYUNvdW50eWFuZExlZ2lzbGF0aXZlRGlzdHJpY3RfMCUyNiUyMzQ3JTNCQ291bnRpZXMlMjYlMjM0NyUzQjFfcnNzLnBuZyUyNyUyMHN0eWxlJTNEJTI3Ym9yZGVyJTNBJTIwbm9uZSUyNyUyMCUyRiUzRSUzQyUyRmElM0UlM0MlMkZub3NjcmlwdCUzRSUzQ29iamVjdCUyMGNsYXNzJTNEJTI3dGFibGVhdVZpeiUyNyUyMCUyMHN0eWxlJTNEJTI3ZGlzcGxheSUzQW5vbmUlM0IlMjclM0UlM0NwYXJhbSUyMG5hbWUlM0QlMjdob3N0X3VybCUyNyUyMHZhbHVlJTNEJTI3aHR0cHMlMjUzQSUyNTJGJTI1MkZwdWJsaWMudGFibGVhdS5jb20lMjUyRiUyNyUyMCUyRiUzRSUyMCUzQ3BhcmFtJTIwbmFtZSUzRCUyN2VtYmVkX2NvZGVfdmVyc2lvbiUyNyUyMHZhbHVlJTNEJTI3MyUyNyUyMCUyRiUzRSUyMCUzQ3BhcmFtJTIwbmFtZSUzRCUyN3NpdGVfcm9vdCUyNyUyMHZhbHVlJTNEJTI3JTI3JTIwJTJGJTNFJTNDcGFyYW0lMjBuYW1lJTNEJTI3bmFtZSUyNyUyMHZhbHVlJTNEJTI3Q2hpbGRQb3ZlcnR5YnlDYWxpZm9ybmlhQ291bnR5YW5kTGVnaXNsYXRpdmVEaXN0cmljdF8wJTI2JTIzNDclM0JDb3VudGllcyUyNyUyMCUyRiUzRSUzQ3BhcmFtJTIwbmFtZSUzRCUyN3RhYnMlMjclMjB2YWx1ZSUzRCUyN3llcyUyNyUyMCUyRiUzRSUzQ3BhcmFtJTIwbmFtZSUzRCUyN3Rvb2xiYXIlMjclMjB2YWx1ZSUzRCUyN25vJTI3JTIwJTJGJTNFJTNDcGFyYW0lMjBuYW1lJTNEJTI3c3RhdGljX2ltYWdlJTI3JTIwdmFsdWUlM0QlMjdodHRwcyUzQSUyNiUyMzQ3JTNCJTI2JTIzNDclM0JwdWJsaWMudGFibGVhdS5jb20lMjYlMjM0NyUzQnN0YXRpYyUyNiUyMzQ3JTNCaW1hZ2VzJTI2JTIzNDclM0JDaCUyNiUyMzQ3JTNCQ2hpbGRQb3ZlcnR5YnlDYWxpZm9ybmlhQ291bnR5YW5kTGVnaXNsYXRpdmVEaXN0cmljdF8wJTI2JTIzNDclM0JDb3VudGllcyUyNiUyMzQ3JTNCMS5wbmclMjclMjAlMkYlM0UlMjAlM0NwYXJhbSUyMG5hbWUlM0QlMjdhbmltYXRlX3RyYW5zaXRpb24lMjclMjB2YWx1ZSUzRCUyN3llcyUyNyUyMCUyRiUzRSUzQ3BhcmFtJTIwbmFtZSUzRCUyN2Rpc3BsYXlfc3RhdGljX2ltYWdlJTI3JTIwdmFsdWUlM0QlMjd5ZXMlMjclMjAlMkYlM0UlM0NwYXJhbSUyMG5hbWUlM0QlMjdkaXNwbGF5X3NwaW5uZXIlMjclMjB2YWx1ZSUzRCUyN3llcyUyNyUyMCUyRiUzRSUzQ3BhcmFtJTIwbmFtZSUzRCUyN2Rpc3BsYXlfb3ZlcmxheSUyNyUyMHZhbHVlJTNEJTI3eWVzJTI3JTIwJTJGJTNFJTNDcGFyYW0lMjBuYW1lJTNEJTI3ZGlzcGxheV9jb3VudCUyNyUyMHZhbHVlJTNEJTI3eWVzJTI3JTIwJTJGJTNFJTNDJTJGb2JqZWN0JTNFJTNDJTJGZGl2JTNFJTIwJTIwJTIwJTIwJTIwJTIwJTIwJTIwJTIwJTIwJTIwJTIwJTIwJTIwJTIwJTIwJTNDc2NyaXB0JTIwdHlwZSUzRCUyN3RleHQlMkZqYXZhc2NyaXB0JTI3JTNFJTIwJTIwJTIwJTIwJTIwJTIwJTIwJTIwJTIwJTIwJTIwJTIwJTIwJTIwJTIwJTIwJTIwJTIwJTIwJTIwdmFyJTIwZGl2RWxlbWVudCUyMCUzRCUyMGRvY3VtZW50LmdldEVsZW1lbnRCeUlkJTI4JTI3dml6MTU0NzgyNzE4NTU1OCUyNyUyOSUzQiUyMCUyMCUyMCUyMCUyMCUyMCUyMCUyMCUyMCUyMCUyMCUyMCUyMCUyMCUyMCUyMCUyMCUyMCUyMCUyMHZhciUyMHZpekVsZW1lbnQlMjAlM0QlMjBkaXZFbGVtZW50LmdldEVsZW1lbnRzQnlUYWdOYW1lJTI4JTI3b2JqZWN0JTI3JTI5JTVCMCU1RCUzQiUyMCUyMCUyMCUyMCUyMCUyMCUyMCUyMCUyMCUyMCUyMCUyMCUyMCUyMCUyMCUyMCUyMCUyMCUyMCUyMGlmJTIwJTI4JTIwZGl2RWxlbWVudC5vZmZzZXRXaWR0aCUyMCUzRSUyMDgwMCUyMCUyOSUyMCU3QiUyMHZpekVsZW1lbnQuc3R5bGUud2lkdGglM0QlMjcxMDAlMjUlMjclM0J2aXpFbGVtZW50LnN0eWxlLmhlaWdodCUzRCUyOGRpdkVsZW1lbnQub2Zmc2V0V2lkdGglMkEwLjc1JTI5JTJCJTI3cHglMjclM0IlN0QlMjBlbHNlJTIwaWYlMjAlMjglMjBkaXZFbGVtZW50Lm9mZnNldFdpZHRoJTIwJTNFJTIwNTAwJTIwJTI5JTIwJTdCJTIwdml6RWxlbWVudC5zdHlsZS53aWR0aCUzRCUyNzEwMCUyNSUyNyUzQnZpekVsZW1lbnQuc3R5bGUuaGVpZ2h0JTNEJTI4ZGl2RWxlbWVudC5vZmZzZXRXaWR0aCUyQTEuNzclMjklMkIlMjdweCUyNyUzQiU3RCUyMGVsc2UlMjAlN0IlMjB2aXpFbGVtZW50LnN0eWxlLndpZHRoJTNEJTI3MTAwJTI1JTI3JTNCdml6RWxlbWVudC5zdHlsZS5taW5IZWlnaHQlM0QlMjc3NTBweCUyNyUzQnZpekVsZW1lbnQuc3R5bGUubWF4SGVpZ2h0JTNEJTI4ZGl2RWxlbWVudC5vZmZzZXRXaWR0aCUyQTEuNzclMjklMkIlMjdweCUyNyUzQiU3RCUyMCUyMCUyMCUyMCUyMCUyMCUyMCUyMCUyMCUyMCUyMCUyMCUyMCUyMCUyMCUyMCUyMCUyMCUyMCUyMCUyMHZhciUyMHNjcmlwdEVsZW1lbnQlMjAlM0QlMjBkb2N1bWVudC5jcmVhdGVFbGVtZW50JTI4JTI3c2NyaXB0JTI3JTI5JTNCJTIwJTIwJTIwJTIwJTIwJTIwJTIwJTIwJTIwJTIwJTIwJTIwJTIwJTIwJTIwJTIwJTIwJTIwJTIwJTIwc2NyaXB0RWxlbWVudC5zcmMlMjAlM0QlMjAlMjdodHRwcyUzQSUyRiUyRnB1YmxpYy50YWJsZWF1LmNvbSUyRmphdmFzY3JpcHRzJTJGYXBpJTJGdml6X3YxLmpzJTI3JTNCJTIwJTIwJTIwJTIwJTIwJTIwJTIwJTIwJTIwJTIwJTIwJTIwJTIwJTIwJTIwJTIwJTIwJTIwJTIwJTIwdml6RWxlbWVudC5wYXJlbnROb2RlLmluc2VydEJlZm9yZSUyOHNjcmlwdEVsZW1lbnQlMkMlMjB2aXpFbGVtZW50JTI5JTNCJTIwJTIwJTIwJTIwJTIwJTIwJTIwJTIwJTIwJTIwJTIwJTIwJTIwJTIwJTIwJTIwJTNDJTJGc2NyaXB0JTNF[/vc_raw_html][/vc_column][/vc_row]

Testimony: Safety Net Plays Key Role in Reducing Poverty

Sarah Bohn, research fellow at the Public Policy Institute of California, testified today, February 14, 2018, before the Senate Budget and Fiscal Review Committee, Informational Hearing on Human Services. The topic of today’s hearing: poverty and social safety net programs. Here are her prepared remarks.

Poverty is high in California, and it has not improved as much as the economy has in recent years. In fact, California’s poverty rate is highest in country, according to our estimates. Throughout this presentation, I will rely on the California Poverty Measure research (a joint effort between PPIC and Stanford) that accounts not only for earnings but also for benefits from major safety net programs and the cost of housing to give a comprehensive, accurate, and state-specific account of the resources families have on hand to meet their basic needs.

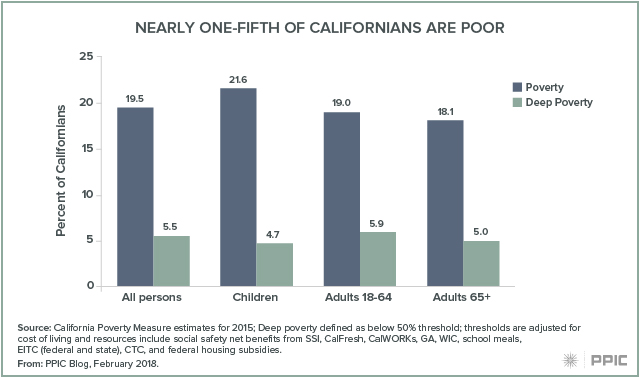
We find that 19.5% of Californians were poor as of 2015—that means 7.5 million people living below a basic needs threshold (less than $30,000 in total resources for a family of four). The poverty rate is slightly higher for children at 21.6%. In addition, 5.5% of Californians are in deep poverty—which means they have less than half of what it takes to meet basic needs, or about $15,000 annually for a family of four. Overall, the share of Californians in poverty remains higher than it was before the last recession started and is relatively high by historical standards.
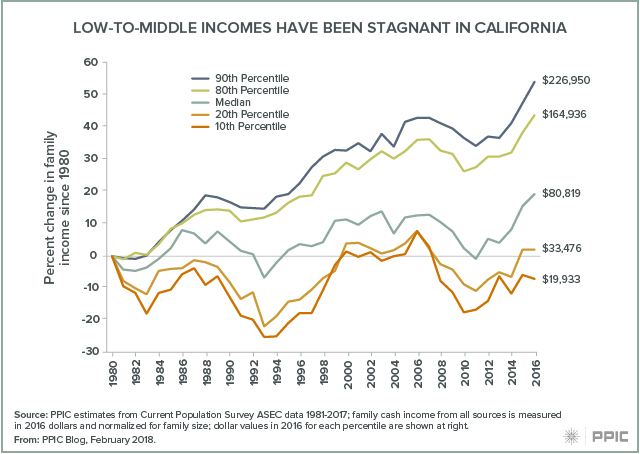
To understand why, providing a long-term picture of how all Californians have fared is helpful. For the bottom half of California families, income has been quite stagnant for at least the past three decades. The bottom 10% are earning less than they were in 1980 (about $20,000) and the bottom 20% are earning just 4% more.  Compare that to the top 10%, which are earning 54% more than they did in 1980.  Much of this is driven by how economic opportunities (especially in the labor market) have changed and polarized – generating both high rates of poverty and high income inequality.
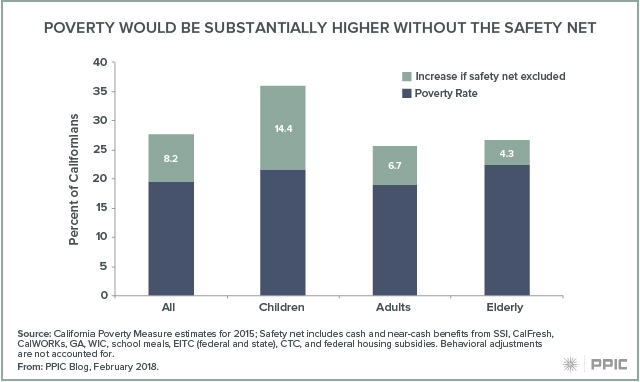
How does this relate to the safety net? With stagnant earnings since 1980, safety net resources become an even more important factor in making ends meet as cost of living increases. Our estimates show that major safety net program benefits play a critical role in mitigating poverty. The California poverty rate would be 8 points higher were it not for these programs—that means an additional 3.1 million Californians would be in poverty. The deep poverty rate would more than double were it not for the safety net.
Looking specifically at CalFresh, CalWORKs, and SSI—the programs we’re focusing on today—we estimate that a large number of Californians are moved out of deep poverty or poverty because of the program benefits they or their family members receive.
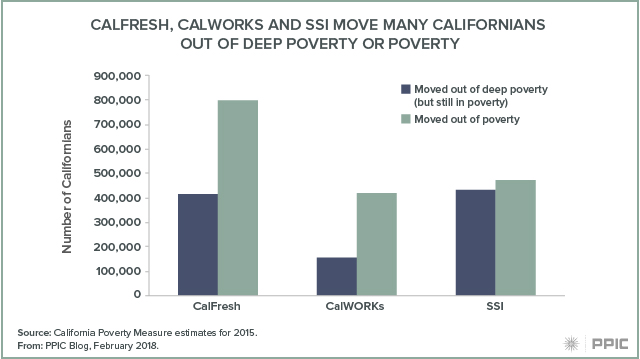
Specifically, CalFresh moves 400,000 people out of deep poverty; 800,000 are moved out of poverty.  The numbers are a bit smaller for CalWORKs families (150,000 from deep poverty and 400,000 from poverty), in part because the program reaches fewer families. And finally, SSI moves about 400,000 out of deep poverty and about the same number out of poverty. Keep in mind that families on these programs may be far from the poverty line, so even if they are not technically moved out of poverty, program resources can still be an important way for them to meet basic needs. Families may also benefit from multiple programs in combination.

The safety net plays a critical role in helping make ends meet but income from work is still the biggest component of family resources, even for families in poverty. And as we saw over the long term, the trend in income alone is not positive for families in the bottom half of the income distribution. So in addition to helping families manage in the short term, ideally social safety net programs could contribute to mobility over the long term, counteracting the trend in income inequality. However, one factor limiting the potential impact of safety net resources is the high cost of living in California, driven mostly by housing but also other living expenses like child care and medical costs.

After we consider these other expenses, we end up with poverty rates that are high compared to other states and high within and across California as well.  This is what the poverty looks like across a number of demographic characteristics.
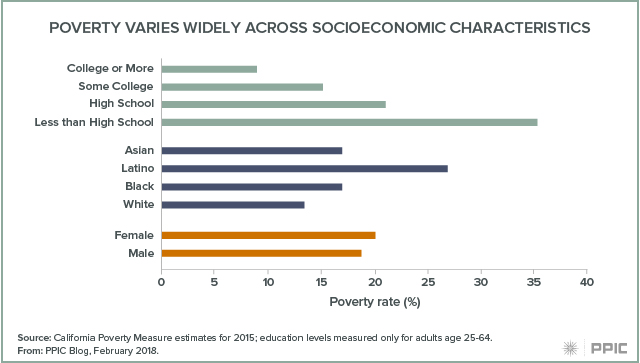
You’ll notice that the incidence of poverty varies the most across education levels (and here we’re only looking at adults age 25–64 who’ve had enough time to acquire education). Men and women are about equally likely to be in poverty. Latinos in California are twice as likely to be poor as white residents (27% vs. 13%), and black and Asian residents fall in between.

Across the state, poverty varies considerably. The highest rate is in Los Angeles, at 25% (with Santa Cruz and Santa Barbara close behind). The lowest is in Placer County at 13% (nearby Sierra counties of Alpine, Mariposa, and others have similar rates).
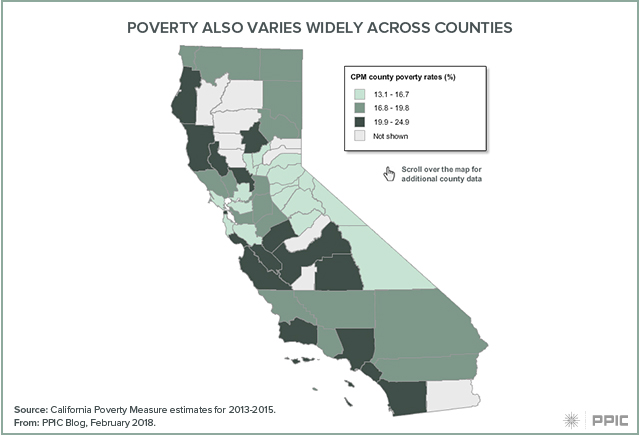
As we all see day to day, poverty is concentrated much more narrowly than at the county level—sometimes it varies neighborhood to neighborhood. In fact, we find that the highest and lowest rates of child poverty in the state are in neighborhoods of Los Angeles that are just 20 to 30 miles apart. Similar differences can be seen in neighborhoods across the Silicon Valley. The concentration of poverty raises concerns that there are other factors about places—beyond just income level—that diminish the chances for residents to get ahead.
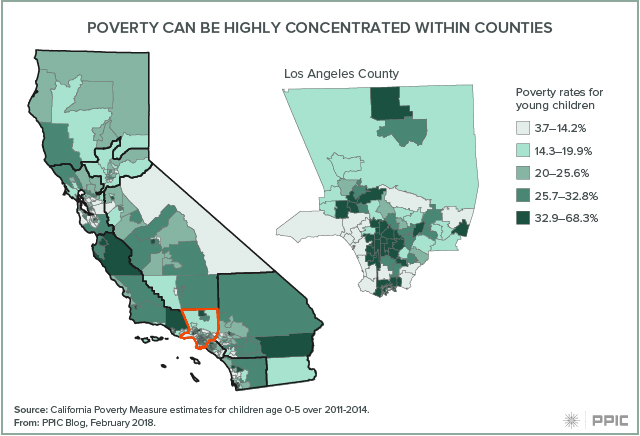
This map is surprising because it does not track one-for-one with unemployment or other economic indicators. Access to good-paying jobs is the number one factor in preventing poverty. But it is not sufficient because the cost of living (housing, child care) looms large—and those expenses tend to be higher in exactly the places where unemployment is lower and wages higher, making it hard to make ends meet even with a full-time job. High living expenses coupled with the long-term stagnation in low to middle incomes yields the high rates of poverty we see today even with very low unemployment rates.

In this context it is critically important to be aware of the role social safety net programs play in helping Californians make ends meet—as I mentioned the poverty rate would be 40% higher were it not for major means tested programs in California.  Nonetheless, California has the highest poverty rate in the country—even with a booming economy—so it is exactly the right time to discuss where the safety net falls short and what needs to be done.

Examining the Federal EITC’s Impact on Poverty

The federal Earned Income Tax Credit (EITC) plays an important role in keeping Californians out of poverty. The credit supplements earnings for low-income workers at tax time, providing $2,400 on average to qualified tax filers.

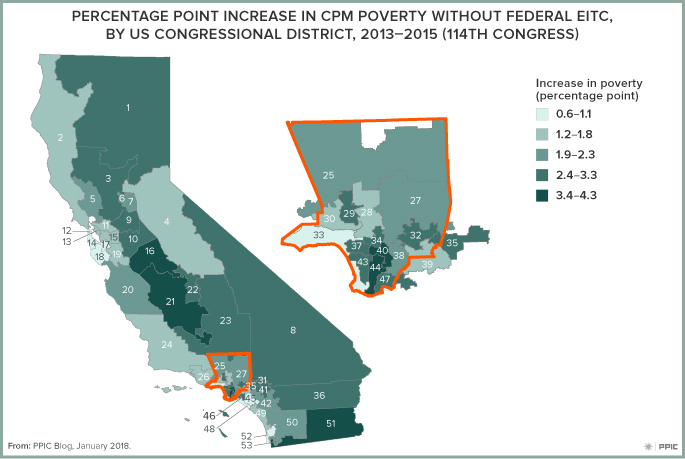
Without the EITC, we estimate an additional 814,000 Californians would live in poverty, according to the latest data from the California Poverty Measure (CPM), an ongoing collaboration between PPIC and the Stanford Center on Poverty and Inequality. This reduction in poverty makes the EITC nearly comparable to CalFresh (formerly known as food stamps), the safety net program that keeps the most Californians out of poverty. Our estimates reflect data from 2013 to 2015 and do not include the state EITC, which was introduced in 2015 and expanded in 2017. The state EITC lowers poverty by very little because the largest credits go to workers with very low earnings, whose families mostly live well below the poverty line.

The role that the EITC plays varies widely across regions. Statewide, the poverty rate would be 2.2 percentage points higher without the EITC (22.6% instead of 20.4%). But in Lake and Mendocino Counties (combined), the poverty rate without the EITC would be 4.1 percentage points higher than it is currently, reaching 26.8%. Poverty in Marin County, on the other hand, would increase only 0.2 points, to 16.5%. Such differences could be due to several factors—for example, the share of eligible families who take advantage of the credit and the local availability of jobs.

PPIC recently released data showing poverty rates, poverty thresholds, and the effects of safety net programs not only by county, but also by state assembly and senate district and by US congressional district. These data provide an opportunity to dig more deeply into the varying roles of safety net programs across the state.

The EITC, for example, has the largest effect in some of the highest-poverty congressional districts, including District 40 (Rep. Roybal-Allard) and District 44 (Rep. Barragán). But in some relatively high-poverty districts it plays a smaller role (District 46, Rep. Correa). The data we provide can be a starting point for investigating—and potentially remedying—incomplete access to the EITC.


Legislative District Data Offers Close-Up View of Poverty

Poverty varies widely across California’s 58 counties—from 13.1% in Placer County to 24.9% in Los Angeles County—according to data from the California Poverty Measure (CPM). The CPM is an ongoing collaboration between PPIC and the Stanford Center on Poverty and Inequality that adjusts for differing housing costs across counties and incorporates major social safety net programs like CalFresh food assistance and the Earned Income Tax Credit (EITC).

For the first time, PPIC recently released CPM data showing poverty rates and the effects of safety net programs not just for counties, but also for state assembly and senate districts and US congressional districts.

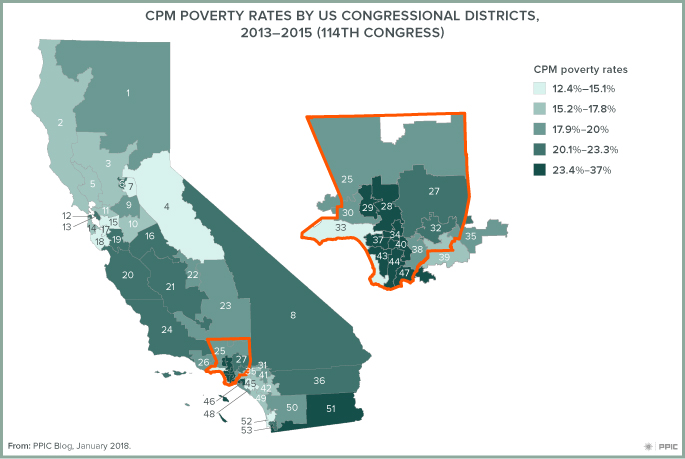
Congressional districts provide a more detailed view of densely populated areas. While counties have static geographic boundaries, California’s congressional districts are adjusted after every decennial census to equalize their populations (in 2010, each of the 53 districts contained 702,905 people). This means that Los Angeles County’s 9.9 million residents, for example, vote in 18 different congressional districts. The county’s average poverty rate of 24.9% reflects both the 13.4% in poverty in District 33 and the 37.0% in District 40, a stark difference illustrated in the map below.

As might be expected, district-level data show even wider geographic variations in poverty than county-level data, from 12.4% in District 15, which includes parts of Alameda and Contra Costa Counties, to 37.0% in District 40, in Los Angeles County. The CPM also shows that without safety net programs, the variation would be even more extreme, ranging from 16.2% in District 33 to 50.3% in District 40.

While counties often take the lead in implementing programs that mitigate poverty, many funding decisions related to social safety net programs are made at the state and federal levels. Understanding the distribution of poverty can help policymakers at all levels develop short- and long-run strategies to alleviate it in every area of the state.