Primary Takeaways: Democracy Is Alive and Well in California

With the release of the official Statement of the Vote, the final tally is in for the 2018 California primary. The election outcomes are encouraging news for California’s democracy—especially in light of criticisms of the top-two primary system by the national media. Several important statewide trends stand out:

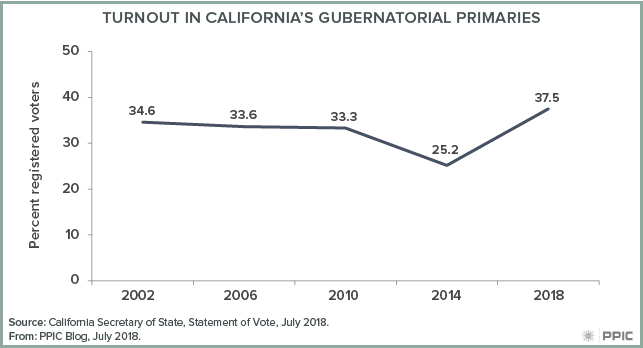
  • Strong political participation. A record-setting 19 million Californians—75.7% of eligible adults—were registered to vote in the gubernatorial primary. This threshold has not been reached since the middle of the 20th century. Moreover, the 7.14 million voters who cast ballots is an all-time high for a gubernatorial primary and, at 37.5% of registered voters and 28.4% of eligible adults, the turnout rates are the highest reported in the five gubernatorial primaries since 2000. Since his election four years ago, California Secretary of State Alex Padilla has been on a mission to make it easier for Californians to register to vote and cast ballots, and the efforts seem to be working. The May PPIC survey found that likely voters’ attention to election news was relatively high, so credit also goes to the media for stoking interest in political participation.
  • More independent voters. Many Californians are responding to the hyper-partisanship of national politics by eschewing the major parties and registering as independents (also known as NPP for “No Party Preference”). In June’s election, for the first time in the state’s history, NPP voters outnumbered Republican voters (25.5% to 25.1%). In the past four years, the number of NPP voters increased (+1,103,602) more than the number of Democratic voters (+745,598), while Republican ranks shrunk (-267,311). The makeup of the June ballot reflected the political clout of NPP voters. Four of the statewide races included NPP candidates, giving voters some nonpartisan choices they did not have under the previous primary system. And in a first for the general election, the top two candidates for insurance commissioner are a Democrat and an NPP candidate (formerly a member of the Republican Party).
  • Diverse statewide candidates. After much consternation about the likelihood of a single-party race at the top of the ticket, five of the eight partisan races—including the governor’s—feature a Democrat running against a Republican. Except for the governor’s race, the top-two primary results offer a diverse pool of candidates to choose from in the fall, at least among Democratic options. The US Senate election and the seven down-ticket races include five Latinos, four women, two Asian Americans, and one African American. Also, eight of the nine statewide races—including the governor’s—are contests between Northern and Southern Californians. While many Republicans are likely to skip voting in a US Senate race with two Democratic candidates, as they did in November 2016, a Democratic-only race for the open lieutenant governor seat will be closely watched for signs of cross-party voting.
  • Popular state ballot measures. Four of the five state propositions placed on the June primary ballot by the legislature passed. This is consistent with the historically high pass rate for legislative ballot measures. With the legislature’s approval holding steady and at a relatively high level in the May PPIC survey, the four state propositions each passed by healthy margins—including a 58% “yes” vote for the state water and parks bond. The latter results bode well for the state housing bonds passed by the legislature and placed on the November ballot. (Citizens’ initiatives appear only on the November general ballot.)

The main takeaway from the June primary is that the vital signs of California’s democracy are healthy. In the wake of California’s many election reforms, records may be shattered in the numbers of registered voters and ballots cast this fall—and throughout the 2020s. The top-two primary system may have its quirks, but it is well suited for the burgeoning number of NPP voters. NPP candidates have found a home in the top-two primary, an NPP will be on the fall ballot, and there will likely be NPP statewide officeholders in the future. The fears about major party voters feeling left out of the fall election were overblown, and most top two candidates reflect the state’s diversity. Positive responses to the June ballot measures suggest an easy time for the state propositions from the legislature this fall; the fate of the nine citizens’ initiatives—including a repeal of the recent gas tax increase—is currently less clear.

At PPIC, the race for governor, US senator, and superintendent of public instruction stand out as uniquely worthy of public attention. We have invited the two candidates in each race to participate in conversations with me about the future of California. Stay tuned for more information about these public events. Meanwhile, throughout the fall the PPIC Statewide Survey will focus on the governor’s race, the US Senate election, and the congressional races—as well as the gas tax repeal and other state propositions that impact our future. We look forward to informing discussions and raising awareness about the importance of this consequential election for the state and nation.

Will California’s Red Districts Turn Blue in November?

One of the important questions hanging over California politics this election cycle is the impact of Donald Trump. In the 2016 presidential race, support for Trump was soft, with some parts of the state voting Democratic for the first time in more than a generation.

This shift encouraged Democrats to target congressional seats that had previously been considered out of reach for the party. The seven Republican-held US House seats considered most competitive all voted for Clinton over Trump. Yet many of these places haven’t voted Democratic for higher office in decades. Is this Democratic optimism warranted, or was 2016 a fluke?

Tuesday’s primary can help answer this question. California’s top-two system—in place since 2012—offers a view into the partisan sentiment in these districts in a year when Donald Trump is not on the ballot. It’s more like a first-stage general election because it lets voters choose any candidate they like regardless of party.

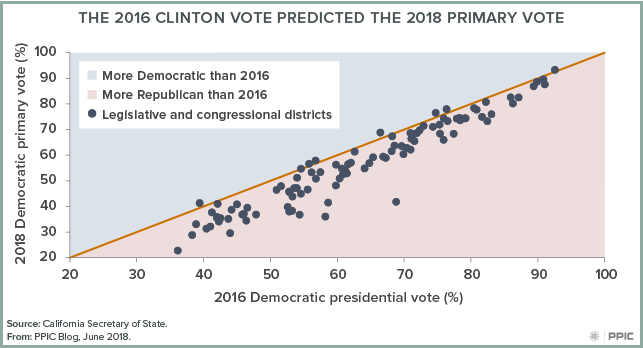
The figure below compares the share of the two-party primary vote for Democratic candidates to the 2016 two-party presidential vote in the same district (primaries without at least one candidate from each major party have been omitted). Each point is a state legislative or US House seat. The more the points cluster in the shape of a line, the stronger the correlation between the two votes. But any point above the line has a 2018 primary vote that is more Democratic than its 2016 presidential vote, while any point below is more Republican.

This figure tells us two things. First, the 2016 presidential vote predicts the 2018 results quite well. As the Democratic presidential vote increases, the Democratic primary vote in 2018 climbs as well. Moreover, the slippage in this relationship (and there is some) is about as large as in previous top-two years.

Second, the Democrats underperformed Clinton’s 2016 vote in almost every district. This too is consistent with the past. Democrats have underperformed the presidential vote in every primary under the top-two system. In fact, the underperformance was actually a little smaller this year than the average. This suggests it’s normal for Democrats to look bad in the primary season, and that it’s no reason for Democrats to be worried or Republicans to be excited.

However, this tells us less about the fall outcome than it might appear. The party vote in the general election usually shifts Democratic, but the magnitude of this shift varies a great deal. It was quite large in 2012: a seat with a 50 percent Democratic outcome in the primary on average voted 56 percent Democratic in the general. But in 2014 there was almost no change at all, and in 2016 the fall outcome was slightly more Republican.

Thus, for Democrats these results are a mixed bag. On the one hand, there are signs that the Trump effect in California has staying power. On the other hand, the consequences for this fall’s election are not altogether clear. The Democrats probably won’t do much worse on average than they did on Tuesday. But beyond that it’s difficult to say, and the consequences for individual seats will have to wait until Election Day.

A Preview of the California Governor’s Election

The people have spoken and the November election for governor has been decided: Democrat Gavin Newsom will face off against Republican John Cox. Let’s look at recent PPIC surveys to help us understand the determining factors of this outcome and the political dynamics that will surface in this fall’s matchup.

In the weeks before the June primary, the May PPIC survey found that Newsom was his party’s favorite in a race with the four major Democratic contenders, while Cox was his party’s top choice in a contest between the two major Republican contenders. The election results confirmed these trends in the voting patterns of red and blue counties. What is it about these candidates that was attractive to their bases?

The primary results were foreshadowed in a January PPIC survey. When likely voters were asked about the qualifications that they are looking for in a candidate for governor, most Democrats (84%) said they wanted a candidate with experience in office, while most Republicans (65%) preferred a candidate with experience running a business. The party faithful chose the person who arguably fit their profile best—Lieutenant Governor Newsom and businessman Cox. While California likely voters favor elected experience to business experience by a wide margin (62% to 31%), the fall election will focus on issues where opinions are more divided. This suggests a more competitive race than one might expect in deep blue California.

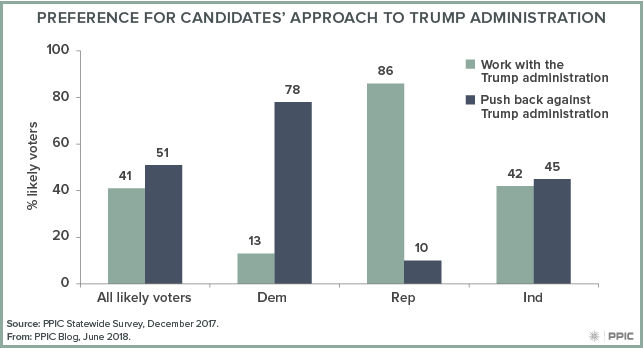
The November gubernatorial election is set in a midterm-election context perceived as a referendum on President Donald Trump and the Republican-led Congress. John Cox is endorsed by President Trump while Gavin Newsom is a vocal member of the Trump resistance. Democrats hope to flip several of the House seats held by California Republicans so that their party can take control of Congress. This election comes at a time when independents are now the second largest voter group at 4.9 million (SOS, June 1).

Slim majorities of California likely voters also say they would vote for the Democratic candidate over the Republican candidate in their House district races in both the March PPIC survey (53% to 39%) and in the May PPIC survey (52% to 38%). Democrats strongly preferred the Democratic candidate (92% March, 91% May) and Republicans strongly favored the Republican candidate (87% March, 86% May) while, again, independents are divided (Democrats: 37% March, 43% May). The independents’ turnout and leanings will thus be a focal point in House races—another reason this voter group is the wildcard in November.

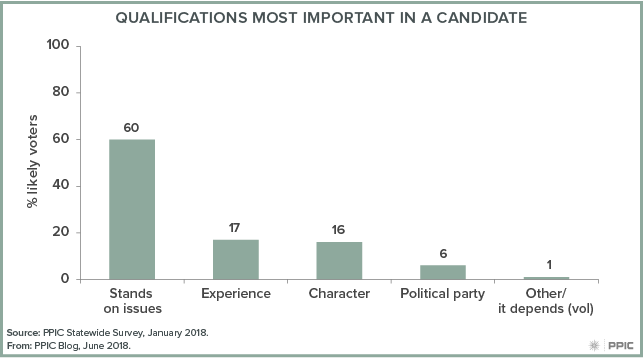
What else will Californians need to know about the two candidates? In the PPIC January survey, 60% of likely voters rank the candidates’ stands on the issues above several traits: experience (17%), character (16%), and political party (6%). Likely voters most often name the economy, immigration, and housing costs as their top issues in the May PPIC survey. Eighty-two percent of likely voters say that the candidates’ performances in public debates will be important in determining their vote for governor.

PPIC has invited the two gubernatorial candidates to participate in a public conversation with me about the issues, their leadership, and vision for California. Stay tuned for more information about when and where it will take place, and how you can attend or watch this special PPIC event.

Commentary: California’s Top-Two Primary, Explained

This commentary was published in the Washington Post on June 6, 2018.

The California governor’s race and all its key House races will feature a Democrat against a Republican in the fall campaign. What would normally be an unremarkable statement counts as breaking news for California.

Read the full commentary on washingtonpost.com.

The Top Two and Turnout in California’s Primary

California voters face many decisions on a long and crowded June 5 primary ballot. None will be more closely watched than the choices made in the top-of-the-ticket governor’s race that will determine the top two candidates in the November election runoff. Six candidates—four Democrats and two Republicans—have been serious contenders in this race. In the May PPIC Survey, Democrat Gavin Newsom continues to lead the pack, with little separation between Republican John Cox and Democrat Antonio Villaraigosa for the coveted second-place finish. It’s a toss-up if the gubernatorial race will include two Democrats or a Democrat and a Republican. Why does this matter so much?

It is likely that a Democratic candidate will prevail—no Republican has won a statewide election since 2006. Since then, the gap in partisan registration has ballooned to 19 points (44% Democrat, 25% Republican; Secretary of State, April 2018). The issue today is turnout. The partisan makeup of this November’s electorate has consequences for the Democrats’ efforts to flip several Republican House seats in competitive California districts (Cook Report, May 10) to gain party control of the US Congress. Without a candidate at the top of the ticket, Republicans have one less reason to vote.

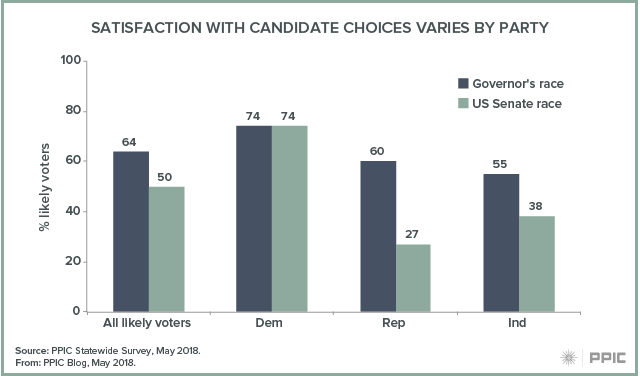
Californians have warmed up to the current gubernatorial contest. The May PPIC Survey finds that likely voters’ interest in news about the gubernatorial candidates has almost doubled since January (30% to 58%). Equal proportions of likely voters across parties are very or fairly closely following election news today (58% Democrats, 61% Republicans, 60% independents). Moreover, likely voters’ satisfaction with the candidate choices has grown since January (54% to 64%)—especially among Republicans, who were the least satisfied earlier this year. Majorities of likely voters across parties are now satisfied with their choices (74% Democrats, 60% Republicans, 55% independents). In addition, more likely voters have found a candidate to support for governor since January (76% to 85%), and by similarly large margins across parties (86% Democrat, 86% Republican, 81% independent) today. Democratic pluralities are favoring Newsom, Republican pluralities are supporting Cox, and independents are dividing their support across two parties and four candidates.

By contrast, we need to look no further than the US Senate primary to foreshadow the impact of a one-party governor’s contest this fall. Democratic US Senator Dianne Feinstein is on the ballot with Democratic California State Senator Kevin de León. There are no major candidates from the Republican ranks in this race. In the May PPIC Survey, likely voters’ satisfaction with senate candidate choices (50%) is much lower than in the governor’s race (64%), with vastly different satisfaction levels across parties (74% Democrat, 27% Republican, 38% independent). More importantly, fewer voters have found a candidate to support in the senate race (64%) than in the governor’s race (85%), and this trend is especially pronounced among the GOP likely voters (87% Democrats, 41% Republicans, 53% independents) today.

The top-two system was created in 2010 to encourage the growing ranks of independent voters to participate in the June primary. Third parties countered that their voters would be shut out of the November election, an outcome that has largely proven true. With the dwindling ranks of Republicans today, another flaw that impacts the two-party system has surfaced—lack of participation from those feeling unrepresented on the ballot. And with deepening partisan divisions in the country, voters cannot be counted on to cross party lines and choose a candidate from outside their ranks. Republicans face an unprecedented obstacle of unknown proportions if a one-party governor’s race depresses their turnout. In the long run, California’s democracy has a bigger problem if many voters are feeling disenfranchised by the top-two primary results and choose not to participate in a statewide election. To fully assess the significance of these issues, PPIC surveys will continue to track voter interest, candidate satisfaction, and ballot choices in this consequential election.

The Top-Two System and Election 2016

This election marked the third outing for the state’s “top two” primary system. The system allows voters to choose any candidate they like in the primary, with the top two vote getters advancing to the fall. One of the reform’s major goals is to promote moderation by removing the partisan barriers that structure candidate and voter choices. What has this election suggested about the reform?

The two candidates who advance to the fall election can be—and often are—from the same party. The most visible example this year was the US Senate race between Democrats Kamala Harris and Loretta Sanchez. It was the first statewide same-party race, and many did not know what to expect. Of the two candidates, Kamala Harris was seen as a traditional liberal Democrat, while Loretta Sanchez made more efforts to appeal to Republicans. In the end, Kamala Harris won by a wide margin—mirroring the substantial margins in most public opinion polls. Polling had also suggested that between a third and half of Republicans were likely to opt out of casting a ballot in this race. At the time of this writing, about 1.1 million more ballots have been cast for president than for US Senate, a number roughly consistent with these polling estimates.

There were also 27 down-ballot same-party races in this cycle, in line with 25 in 2014 and 28 in 2012. These races continue to be a lot closer than cross-party contests: this year, an average of 32 points separated the candidates in cross-party races, compared to 25 points for candidates of the same party. About a quarter of this year’s same-party races were decided by less than 10 points, also similar to previous years.

At the same time, the share of cross-party races decided by narrow margins has been falling over time—from 18% in 2012 to 15% in 2014 to just 11% this year—and is rapidly approaching the average share during the previous redistricting cycle (7%). This most likely reflects the aging of the redistricting plan, which was drawn by an independent commission in 2011. At the beginning the plan was very disruptive to established patterns, but as candidates have come to understand which seats are likely to be competitive and which are a stretch, the level of cross-party competition overall has declined.

Establishment candidates did well this year, as they have on average under the top-two reform. Just 6 out of 123 incumbents lost, and the average margin of victory for incumbents was the same as before the reform. This is not to say that the top-two primary has not altered the playing field in some cases. In fact, three of the six losing incumbents ran in same-party races. But the broader field of play is similar to the past.

Same-party races were in part expected to promote contests between the moderate and liberal/conservative wings of each party. It is not clear that this has happened much on the Republican side, but there are typically several same-party contests that feature this dynamic on the Democratic side. In this election cycle, most of these contests were won by the more moderate, business-backed Democrat. Nonetheless, in at least two cases—Raul Bocanegra vs. Patty Lopez in Assembly District 39 (San Fernando Valley) and Eloise Reyes vs. Cheryl Brown in Assembly District 47 (San Bernardino County)—a less traditional Democratic incumbent lost to a more traditional Democratic challenger (Bocanegra was technically a challenger, but he was also a former incumbent).

In short, this year’s top-two outcomes mostly fit the post-reform pattern, but there were some interesting deviations. It is still early in this reform’s life, so it will be important to keep monitoring it to understand how it unfolds.

Primary Takeaways

With the release of the official Statement of the Vote on Friday, the 2016 California primary is now in the history books. The final tally by the Secretary of State offers many new insights for those of us who closely follow elections and polling in California. This year’s results deserve a particularly close look because of the extraordinary presidential primaries and the first-ever top-two primary for an open US Senate seat.

My colleague Eric McGhee has provided an excellent analysis of primary turnout and the outcomes of top-two legislative district races in two earlier PPIC blog posts. I’m going to focus on some trends that caught my attention in the final numbers regarding the presidential primaries, the top-two US Senate primary, the state ballot measure, voter engagement, and turnout in key regions. 

  • Presidential primaries. Secretary Hillary Clinton (2.75 million) and US Senator Bernie Sanders (2.38 million) were the top-two vote-getters in the state’s presidential primaries. These two Democrats had much more support in their party’s open primary than businessman Donald Trump (1.67 million) had in a closed Republican primary with no active opposition. In addition to facing a sizeable disadvantage in voter registration (45% Democrat, 27% Republican), the presumptive Republican nominee starts the fall election season with one million fewer voters in the state’s primary than the presumptive Democratic nominee. For Republicans, this raises questions about their presidential selection process and whether to have an open primary in the future that invites independent voters to participate. For Democrats, the immediate issue is how many of those devoted, young Sanders supporters will show up to vote this fall.
  • US Senate top-two primary. Attorney General Kamala Harris won more votes (3.00 million) in the primary for the open US Senate seat than Clinton did at the top of the ballot. US Representative Loretta Sanchez finished a distant second (1.42 million) to Harris, setting up the first single-party race for US Senate in the top-two era. As a group, the 12 Republican candidates received more votes (2.15 million) than the second-place Democratic finisher. For Republicans, this raises questions about future strategies to ensure that their party’s voters have a candidate who can qualify for a top-two spot in November. And the question of how many Republicans will opt out of voting for a US Senator this fall will ultimately affect both parties.
  • State ballot measure. Proposition 50 was the biggest vote-getter (5.60 million votes, 76% yes) on the June ballot. A byproduct of recent political scandals, it allows the legislature, with a two-thirds vote, to suspend members without salary and benefits. The legislature placed it on the June ballot with bipartisan support. Proposition 50 received scant media mention and little organized opposition. Its success is consistent with the historically high pass rate for legislative ballot measures found in a recent PPIC report. This trend bodes well for state bonds to fund parks and housing that the legislature may place on the ballot in the fall. Citizens’ initiatives and referenda have been moved to the November general election, and these types of state propositions have a much lower pass rate. That means voters face a cluttered ballot this fall that includes 14 citizens’ initiatives, two legislative initiatives, and one referendum, in addition to local measures. How many will voters decide are worthy of their interest and support? 

In Los Angeles and two of the state’s fastest-growing areas, turnout among registered voters was lower than the state average.

  • Voter engagement. There was a surge in online voter registration as Californians waited for their say in the presidential primaries. Voter engagement was a welcome development after primary turnout reached a new low in June 2014 (4.46 million, 25% registered voters, 18% eligible adults). Turnout this June (8.55 million, 47.7% registered voters, 34.5% eligible adults) reflected a turnaround, although it was well short of the record-setting February 2008 presidential primary (9.07 million, 58% registered voters, 40% eligible adults). Turnout was probably depressed by two events: the elimination of Trump’s competition weeks earlier and the declaration on the day before the primary that Clinton was the presumptive Democratic nominee. Once again, there will be questions about whether it’s in California’s best interests to vote at the end of the primary season in the presidential sweepstakes.
  • Turnout in key regions. Five major counties had lower registered voter turnout than the state average: Los Angeles (41%), Fresno (41%), Kern (41%), Riverside (44%), and San Bernardino (43%). Five less populous counties in the Central Valley also had below-average turnout (41% Kings, 42% Merced, 42% San Joaquin, 44% Stanislaus, 45% Tulare). Moreover, fewer than one in three eligible adults voted in the primary in all 10 of these counties. In sum, these are troubling trends in the state’s most populous county (Los Angeles) and its two fastest-growing areas (the Central Valley and Inland Empire). Are there practical impediments to voting in these regions or is this a symptom of a deeper civic malaise? Until they are fully addressed, these regional disconnects will seriously limit the size and diversity of the state’s electorate.

The 2016 primary results point to several trends to watch in the November general election and beyond. Furthermore, the issues that surfaced this June will likely have longer-term reverberations on the primary process and civic engagement going forward.

At PPIC, the race for US Senate stands out as uniquely worthy of public attention. We invited the two candidates to participate in a conversation with me about the future of California on September 16. Stay tuned for more information about whether the candidates accept our invitation and how you can attend or watch this PPIC event.

Assessing the Top Two Primary

With the voting this week, California has now entered its third election cycle with a “top two” primary. This system marks a radical departure from the “semi-closed” approach in place from 2002 through 2010. Under that system, those voters registered with a party could vote only for candidates of that party. By contrast, the top two gives all voters the same ballot so they can vote for whomever they choose, regardless of party, and the two candidates with the most votes (again regardless of party) advance to the fall.

Among other goals, supporters of the top two hoped that the relatively open nature of the system would encourage more candidates to run and would lead to closer outcomes. There was also a general hope that it would give a leg up to candidates who were not favored by the Democratic and Republican Party establishments. How has the system performed and what do the results indicate?

For the state senate and US House, far more candidates under the top two have faced at least one candidate from their own party, a trend that shows no sign of letting up in 2016. But intra-party challenges for the assembly have faded to the point where such competition is not much more common than before the reform. The top two has actually discouraged some major-party candidates in heavily partisan districts from running, since such candidates are no longer guaranteed a place on the fall ballot. The share of such races without major party competition has declined from the highs of 2012 for state senate and US House races (7% now, 13% 2014, 19% 2012), but it continues to be high for the assembly (25% now, 25% 2014, 14% 2012).

What about threats to the party establishment? Incumbents have had something of a bumpy ride under the top two. But most of that can be pinned on the immediate chaos of the 2011 redistricting. The new districts were drawn by an independent citizen commission with little or no regard for incumbency and prompted many incumbents to retire or run for another office in 2012. Things have settled down quickly since then. Sitting members of the assembly are actually less likely to step down now than before the era of the top two.

In fact, on average the top two has been fairly kind to establishment candidates. In 2012 and 2014, every incumbent advanced to the fall campaign, as did almost every non-incumbent endorsed by a major party (205 out of 225). This election cycle is no different: all incumbents, and 103 of 117 endorsed non-incumbents, have advanced. By contrast, just 2 of the 50 minor party or independent candidates on the ballot have advanced, and in both cases, they were running against an otherwise uncontested Democrat.

Finally, while outcomes have been closer under the top two, competition has dropped off over time. Under the semi-closed primary, the gap between the first- and second-place candidates averaged 32 points; it averaged 16 points between the second- and third-place candidates (a divide that decides the finalists in a top two system). Under the top two, the gap between first and second has grown from 22 points in 2012 to 27 in 2014 to 31 in 2016; the gap between second and third has remained flat, between 11 and 13 points. A large share of races this primary election—73%—have produced one candidate with more than 50% of the vote. This number is still lower than the 88% under the semi-closed primary, but it is similar to the 72% in 2014 and much larger than the 59% in 2012. In most cases these races will be uncompetitive in the fall.

Of course, such broad averages may not be the best way to evaluate the system, since specific races have undeniably been changed. This is most obvious for the same-party contests, which could never have occurred under the semi-closed primary. So far there will be 22 such races this election cycle, similar to but slightly lower than the 25 in 2014 and 28 in 2012. At least some of these same-party races will pit a moderate candidate against a more liberal or conservative one, and some of these moderate candidates might win.

In fact, moderate candidates might succeed despite a disengaged electorate. The best evidence suggests California voters under the top two have tremendous difficulty separating the moderate candidates from the rest, and they rarely cross party lines when voting. In fact, the total Democratic and Republican votes in the primary can be predicted well by looking at a district’s party registration. But a dramatic change in voter behavior may not be required. If moderate candidates are more willing to run, and if they have the means to promote themselves, some of them are likely to win. The result would not be a wholesale change in the state’s leadership, but it might cause an important shift at the margins.

The Special Election and the Top-Two Primary

Two Democrats are heading into a runoff in a big political fight for a seat in the state senate, representing the wealthy bedroom communities of the far eastern Bay Area. The contenders are Susan Bonilla, a Concord assemblymember, and Steve Glazer, the mayor of Orinda. The race was held under the rules of California’s new top-two primary, but the role of this new system in producing the outcome is more complicated than it might seem.

Four Democrats and one Republican were on the ballot for this 7th Senate District seat, which became vacant when Democrat Mark DeSaulnier successfully ran for the U.S. House of Representatives. The race boiled down to a pitched battle between the three best-known Democrats: Joan Buchannan, a former Alamo assemblymember; Bonilla; and Glazer. The fourth Democrat received far less attention and the lone Republican actually withdrew from the race and endorsed Glazer (though her name remained on the ballot). At the time of this writing, Glazer has finished first with 33 percent, followed by Bonilla with 25 percent, and Buchannan with 23.

A goal of the new top-two system is to encourage candidates to build centrist cross-party coalitions. All candidates were on the same ballot, and voters could choose any candidate they liked, regardless of party. The top two vote getters, also regardless of party, now advance to a runoff campaign. (Technically, this special election uses a variant of the top two, in which a runoff occurs only if none of the candidates receives at least 50% of the vote. But that did not end up being a factor in this race.)

Steve Glazer fits well in this new system. He has taken a more business-oriented perspective that has put him at odds with many in the party’s pro-union establishment. With the endorsement of the only Republican in the race, he has been empowered to draw Republican voters to his banner. Moreover, the 7th Senate district is in an area with politics only slightly left of center, with more Republican voters than is typical for the Bay Area. As if that weren’t enough, counts of vote-by-mail ballots just before Election Day suggested Republicans were turning out to vote in disproportionate numbers, making them even more critical to the outcome.

However, it is important to emphasize the precise way in which the top two impacts this race. The open ballot—with all candidates listed regardless of party—is not new to special elections such as this one. Special elections have long had an open ballot, so even before the reform the District 7 candidates would have been free to reach across party lines.

The key difference comes now that the first round is over. Under the old special election system, the top vote-getters within each party would advance to a runoff election. Under the new system, the top two candidates advance even if these candidates hail from the same party. Thus, the May match-up between Glazer and Bonilla would have been impossible before the top two.

The irony is that in this particular case, the same-party race has thrown an extra hurdle in the way of the more moderate candidate. Under the old system, Glazer would have advanced to a runoff against a Republican who is no longer in the race. Now he must fight another Democrat to secure his place in the legislature.

But that doesn’t mean the top two has necessarily hurt Glazer’s chances. The same candidates may not have made the same decisions under the old system. Michaela Hertle, the Republican, might not have withdrawn from the race and endorsed a Democrat, because as the only Republican, she would have been guaranteed a spot in the runoff. Glazer might not have run for fear that he would not finish a clear first among all the Democrats. Though one can never be certain about any particular race, there is evidence that the top two has discouraged candidates like Hertle—those who hail from the major party with fewer registrants in a district—and encouraged more candidates from within the district’s dominant party. So while the top two didn’t enable cross-party coalitions in this race, it may have altered the landscape in other ways.

At any rate, there is no doubt that the top two has changed the contest moving forward, since Glazer and Bonilla never would have faced each other in the runoff without it. The ultimate test of the system lies with the outcome of this same-party race, and the political leanings of the person who wins it.

Three Lessons About California’s Election Reforms

California got its second taste of two important reforms yesterday: legislative and congressional districts drawn by an independent redistricting commission, and a “top-two” primary system that allowed voters to choose any candidate in the primary, regardless of party, and advanced the top two vote-getters, also regardless of party, to the fall election. Both went into effect in 2012.

How did the reforms do this time around? This is really a question about the legislative and congressional races, since the statewide races weren’t affected by the redistricting and there were no same-party races at that level. The new districts were used for the first time only in the state senate races.

A first pass at the results (as they stand at the time of this writing) suggests three important conclusions:

  1. Competition was higher. Races were more competitive this year than before the reforms, though they were a little less competitive than in 2012. Among races between candidates of opposing parties, 15% had a margin of victory of less than 10 points, compared to 18% in 2012 and just 7% in the decade before. There were 25 same-party races (compared with 28 in 2012), almost exclusively in districts that would have been uncompetitive under the old primary system. (The only possible exception was Congressional District 25 just north of Los Angeles, where two Republicans faced off against each other in a district that might have been competitive for a Democrat under the right circumstances). Roughly one-quarter of those same-party races were decided by less than 10 points, down slightly from 2012.
  2. The establishment did pretty well. Despite the extra competition, most races turned out as they might have before the reforms. In other words, incumbents and candidates endorsed by their party fared well. All but seven of the 114 incumbents across state assembly, state senate, and U.S. House races won reelection, although fewer incumbents ran in the senate’s new districts (50%) compared to the assembly (70%) or Congress (89%). One incumbent in a same-party race is losing this cycle (Raul Bocanegra in Assembly District 39), compared to six who lost in 2012 (two of whom were running against another incumbent). The average margin of victory for incumbents (33%) was about the same as in 2012 (33%) and in the decade before (31%). In the same-party races where only one candidate was endorsed by the party, that candidate won 15 out of 18 times, compared to 12 of 16 in 2012.
  3. Minor parties continued to struggle. One criticism of the top-two system is that minor-party and no-party-preference candidates find it more difficult to survive the first-round election to reach the fall runoff. This year, only seven such candidates managed it, four of them by running write-in campaigns in races where there was otherwise no formal major-party opposition. None of these candidates was elected on Tuesday (though such candidates rarely won before the reforms, either).

It will likely take more time for the impact of redistricting and election reforms to be clear, but for the time being, the results are falling into some predictable patterns. As voters, candidates, and campaign consultants wrap their heads around the idea of the top two, we may see further evolution of this system. But for now, the reforms have transformed certain aspects of California elections—such as increasing the number of competitive races and allowing same party runoffs in the fall—while leaving the broader landscape unchanged.