Unfavorable Ratings for Political Parties Persist among Californians

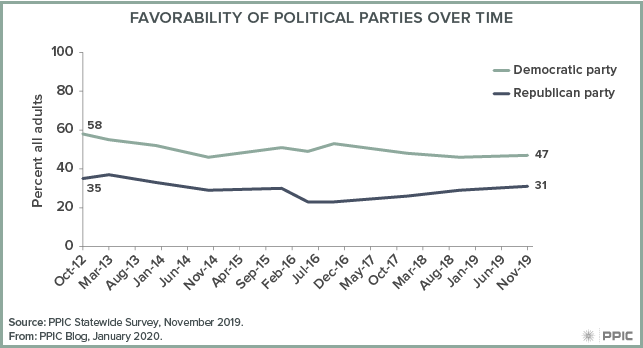
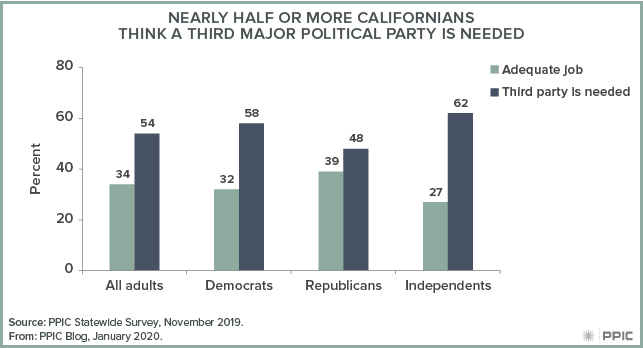
How do Californians view the two major political parties in this era of hyper-partisanship? In our recent survey, 47% of adults and 46% of likely voters report a favorable impression of the Democratic Party and 31% of adults and 34% of likely voters report a favorable impression of the Republican Party. In expressing their relative discontent with how these two parties represent the American people, a majority of adults (54%) and likely voters (57%) say a third major party is needed.

Since we first asked about party favorability in March 2010, positive views of the parties have rarely exceeded 50% and impressions have remained steady among adults and likely voters. Although favorability toward the Democratic Party sits below 50% overall, it rose among certain groups, including African Americans (52% 2010, 71% today), those with annual household incomes of $40,000 to $80,000 (39% in 2010, 49% today), and college graduates (39% in 2010, 48% today). Party favorability remained stable across all other regions and demographic groups.

For the Republican Party, favorability has increased somewhat among Central Valley residents (30% 2010, 38% today) but declined somewhat among 18 to 34 year olds (32% in 2010, 24% today). However, favorability is steady among all other regions and demographic groups.

figure - Favorability of Political Parties over Time

While less than half of adults and likely voters hold positive views about either major party, majorities of partisans continue to regard their party well. Favorability has climbed among party members since 2010 (Democratic 68% 2010, 76% today; Republican 54% 2010, 77% today). Among independents, impressions of both parties remain similar to 2010, but about six in ten independents, who comprise more than a quarter of the California electorate, report a poor impression of both parties (60% Democratic, 63% Republican). Notably, today, 21% of adults and 14% of likely voters have an unfavorable view of both parties.

With both parties facing mediocre ratings, about half or more of California’s residents have consistently called for a third major political party since October 2006. Today, just one in three adults (34%) and likely voters (32%) think that the two major parties do an adequate job representing the American people. About half or more across parties and regions—and a plurality among demographic groups—feel a third major party is needed, with independents (62%) and those earning over $40,000 annually (62%) most likely to hold this view.

figure - Nearly Half or More Californians Think a Third Major Political Party Is Needed

As the electorate changes, and as the 2020 election landscape develops, PPIC will continue to monitor Californians’ views on the major political parties.

Is California Turning Even Bluer?

California is already a fairly Democratic state, but in the last two years many have wondered if it has become even more so. In the 2016 presidential election, California was one of a few states that did not shift away from the Democrats. In most of the country, Hillary Clinton garnered a smaller share of the vote than Obama received in either of his campaigns for president—but in California, Clinton improved on Obama’s 2012 vote share by 1.3%, while Donald Trump fell short of Mitt Romney’s share by 5.6%.

Some areas of the state, such as Orange County, have experienced long-term demographic trends that favor the Democrats, yet the swing to Clinton in these places outpaced these trends. Seven of California’s congressional districts are held by Republicans but were won by Clinton in 2016. Just two years earlier, five of those seats favored Republican Neel Kashkari for governor by at least 10 points—in a race that Democrat Jerry Brown won by 20 points statewide.

The 2016 presidential vote therefore marked a big change of fortune for California Democrats, particularly in some districts. Does this mean that these districts have become more Democratic for good, or was the 2016 result a reaction to the personalities on the ballot?

One way to answer this question is to compare the change in the Democratic presidential vote in each congressional district to the change in party registration. Party registration indicates a more enduring attachment—something closer to a permanent change in allegiance. If party registration changed to match the latest presidential vote, it might indicate that something longer-term is afoot.

The figure below compares the change in the Democratic presidential vote between 2012 and 2016 to the change in party registration in the state’s 53 congressional districts from 2014 to 2018. The blue dots indicate Democratic registration change, and the red dots indicate Republican change.

Statewide, the Democratic Party has mostly held steady in registration while the Republican Party has lost ground. We can see this pattern above: the blue Democratic dots are clustered around zero on the vertical axis, indicating little average change, while all the red dots are below zero, indicating a decline in Republican registration. However, our question is whether a larger 2016 surge led to a larger change in party registration by 2018. If this has happened, the blue dots should be higher toward the right side of the graph and the red dots should be lower. We can see such a pattern, but it is weak. Districts on the left have indeed seen both smaller increases in Democratic registration and smaller decreases in Republican registration. Likewise, those on the right have seen larger Democratic gains and larger Republican losses. But the difference is modest.

The districts with the largest Democratic shifts—seen on the far right of the graph—display the expected pattern more clearly. In fact, most of the competitive congressional races mentioned above are represented here. Of the seven races considered most competitive by the Cook Political Report, four are in districts that shifted more than 6 percent toward the Democrats in the 2016 presidential race. All four districts are in or around Orange County: 39 (outgoing incumbent Ed Royce), 45 (incumbent Mimi Walters), 48 (incumbent Dana Rohrabacher), and 49 (outgoing incumbent Darrell Issa). Each of these districts also saw a Democratic registration gain of at least 1.4% and a Republican registration loss of at least 4.4%. So the districts with the most surprising results in 2016 are generally also the places with the biggest Democratic gains in registration.

Overall, these results do provide some support for the idea that the 2016 election marked a more permanent change in the state’s politics. But party registration tends to change slowly, and the patterns we are seeing suggest there may be years to go before any transition is complete.