California’s Independent Voters and the Presidential Primary

Independents may play a central role in the March primary, as they now comprise the second-largest voting bloc in California. The share of Californians registered as independents, also known as “decline to state” or “no party preference” (NPP), was 26.7% of registered voters as of October—up from 24% at the same point before the last presidential primary. With independents a growing faction, it is critical to understand these voters and their motivations.

In PPIC’s November Statewide Survey, 28% of registered voters were independents. About six in ten say they have always been an independent voter, while four in ten say they previously registered with a major party—with 56% naming the Democratic Party and 40% the Republican Party. Today, about half of independent voters (48%) consider their views closer to the Democratic Party, while fewer say the Republican Party (24%) or neither party (22%).

When asked the main reason they are registered as an independent and not as a member of a political party, a plurality (39%) say they are not satisfied with the parties and they do not reflect their views. Another 15% say they vote for candidates, not parties, and 8% vote for both Democrats and Republicans.
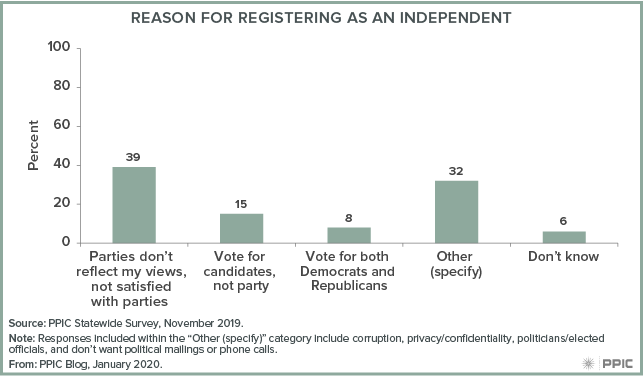
figure - Reason for Registering as an Independent

In California, political parties decide whether independents can vote in their presidential primary, and three political parties allow it: the American Independents, Democrats, and Libertarians. One in four independent voters in our November survey plan to vote in the Democratic primary, while about half say they will vote on the nonpartisan ballot.

Independents seeking to vote in the Republican presidential primary must re-register to vote with that party. Without registering as a Republican, independents will be unable to cast a vote for President Trump or potential challengers in the Republican presidential primary. (Members of the Green or Peace and Freedom parties must also re-register with and request a ballot from the major party of their choice.)

Independents who want to vote for US president in the primary must request a ballot with presidential candidates on it; otherwise, they receive a nonpartisan ballot. Although the deadline to request a ballot has passed, independents can still exchange their ballot at a local elections office or re-register with another party.

PPIC will continue to track voter and party profiles in 2020, with a focus on the state’s evolving independent voting bloc.

Unfavorable Ratings for Political Parties Persist among Californians

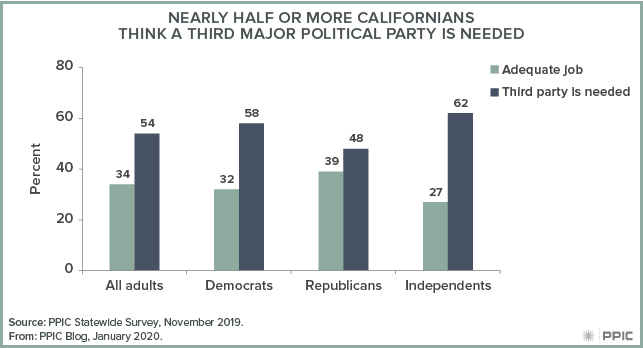
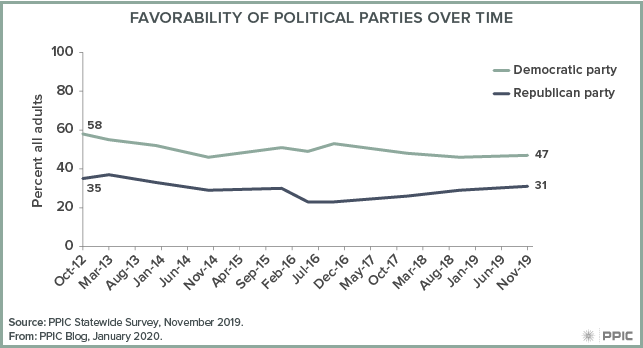
How do Californians view the two major political parties in this era of hyper-partisanship? In our recent survey, 47% of adults and 46% of likely voters report a favorable impression of the Democratic Party and 31% of adults and 34% of likely voters report a favorable impression of the Republican Party. In expressing their relative discontent with how these two parties represent the American people, a majority of adults (54%) and likely voters (57%) say a third major party is needed.

Since we first asked about party favorability in March 2010, positive views of the parties have rarely exceeded 50% and impressions have remained steady among adults and likely voters. Although favorability toward the Democratic Party sits below 50% overall, it rose among certain groups, including African Americans (52% 2010, 71% today), those with annual household incomes of $40,000 to $80,000 (39% in 2010, 49% today), and college graduates (39% in 2010, 48% today). Party favorability remained stable across all other regions and demographic groups.

For the Republican Party, favorability has increased somewhat among Central Valley residents (30% 2010, 38% today) but declined somewhat among 18 to 34 year olds (32% in 2010, 24% today). However, favorability is steady among all other regions and demographic groups.

figure - Favorability of Political Parties over Time

While less than half of adults and likely voters hold positive views about either major party, majorities of partisans continue to regard their party well. Favorability has climbed among party members since 2010 (Democratic 68% 2010, 76% today; Republican 54% 2010, 77% today). Among independents, impressions of both parties remain similar to 2010, but about six in ten independents, who comprise more than a quarter of the California electorate, report a poor impression of both parties (60% Democratic, 63% Republican). Notably, today, 21% of adults and 14% of likely voters have an unfavorable view of both parties.

With both parties facing mediocre ratings, about half or more of California’s residents have consistently called for a third major political party since October 2006. Today, just one in three adults (34%) and likely voters (32%) think that the two major parties do an adequate job representing the American people. About half or more across parties and regions—and a plurality among demographic groups—feel a third major party is needed, with independents (62%) and those earning over $40,000 annually (62%) most likely to hold this view.

figure - Nearly Half or More Californians Think a Third Major Political Party Is Needed

As the electorate changes, and as the 2020 election landscape develops, PPIC will continue to monitor Californians’ views on the major political parties.

Ideology and California’s Independent Voters

Nearly one in four California voters are registered with “no party preference,” and the share of these voters—commonly known as independents—has more than doubled over the past twenty years. Does the growing number of independent voters mean that California’s electorate is becoming less polarized?

Data from the PPIC Statewide Survey suggests that independent voters do not speak with one voice, and they are not, as a rule, more moderate than partisans. In our 2015 surveys, the overwhelming majority of independents say they lean toward either the Democratic Party (41%) or the Republican Party (30%), and these voters often share the views of the party they lean toward.

For example, independents who say they lean toward the Democratic Party are about as likely as registered Democrats to call themselves politically liberal. Similarly, most Republican-leaning independents and registered Republicans call themselves politically conservative. The only group of independents who stand out as more politically moderate than partisan voters are the ones who lean toward neither party—a majority of these independents call themselves politically middle-of-the-road.

Political differences among independents also show up in responses to survey questions about specific issues. On immigration, Republican-leaning independents line up with registered Republicans in saying that overall, immigrants are a burden to California (55% and 61%), while solid majorities of both Democratic-leaning independents and registered Democrats say immigrants are a benefit to the state (80% and 72%). Regarding the taxation of oil extraction in California, Democratic-leaning independents and registered Democrats are in favor (61% and 55%), while Republican-leaning independents and registered Republicans are opposed (70% and 60%). Finally, majorities of Democratic-leaning independents and registered Democrats would prefer to use state budget surpluses to restore funding for social services (52% and 56%), while majorities of Republican-leaning independents and registered Republicans would prefer to pay down debt and build up reserves (73% and 76%).

These findings show that the 24 percent of California voters who are registered as independents do not all occupy the political center—and that these voters often diverge sharply from one another in their political ideologies and their opinions about specific issues.

Chart Source (TOP): Registration totals for Democrats, Republicans, independents, and other parties are from the California Secretary of State. The shares of independents who lean toward the Democratic Party, Republican Party, or neither party are estimated using PPIC survey data.

Who Are California’s Independent Voters?

The partisan composition of California’s electorate continues to evolve as an increasing number of voters register as independent or decline-to-state. Today, independents make up 21 percent of the electorate, while Democrats make up 43 percent and Republicans 28 percent. Since 2006, the share of voters registering as independent has increased 2 points, while Republican registration has declined 6 points and Democratic registration has not changed. Looking back further, we see that independent registration has more than doubled since 1994 (10% to 21%), while Democratic registration has declined 6 points and Republican registration is down 9 points.

What do we know about independent voters in California?

Among independents considered likely to vote by the PPIC Statewide Survey, about three in 10 identify themselves as liberal and the same number say they’re conservative. Four in 10 say they are middle-of-the-road. About four in 10 independent likely voters say they lean toward the Democratic Party, while about three in 10 lean toward the Republican Party. Three in 10 say they lean toward neither major party.

Given these party leanings, it may not be surprising that independent likely voters often agree with Democrats on issues that divide voters along party lines. For example, 77 percent of Democrats and 63 percent of independents are in favor of legalizing same-sex marriage. Republicans are opposed (55% oppose, 41% favor). And 81 percent of Democrats and 57 percent of independents are in favor of taxing the wealthy, while 68 percent of Republicans are opposed. But on other issues that divide partisans, independents are themselves split. For example, while strong majorities of partisan likely voters fall on each party’s side of the debate over the size of government (Democrats: 63% higher taxes and more services; Republicans: 79% lower taxes and fewer services), independent likely voters are divided (51% lower taxes and fewer services, 44% higher taxes and more services).

No matter where they stand on issues and ideologies, independent likely voters tend to have unfavorable views of political parties. Solid majorities have unfavorable opinions of the Democratic Party (59%, 38% favorable) and the Republican Party (73%, 25% favorable), and 41 percent have an unfavorable opinion of both parties.

These weaker ties to the major parties may help explain why independents make up a disproportionate share (30%) of those we consider infrequent voters. Will they turn out this November? In an election year in which only about half of independents (49%) say they are closely following news about gubernatorial candidates, this is an open question for all contenders on the ballot.