Overcrowded Housing and COVID-19 Risk among Essential Workers

[vc_row][vc_column][vc_column_text]Some Californians face substantial risk of illness within their own households under the state’s shelter-in-place order. Physical distancing and self-isolation can be virtually impossible in crowded homes, threatening the health of entire households. In crowded living conditions, individuals are at higher risk of transmitting infectious diseases, a factor that may challenge the state’s efforts to manage the pandemic while reopening the economy.

As the high cost of housing is a stark reality for nearly two-thirds of Californians, finding affordable housing can mean cohabiting with several other people. California’s overcrowding rate is well above the national average; the share of housing units with more than one occupant per room is 8.3% compared with 3.4% across the nation. Furthermore, overcrowding is much more common among renters than homeowners (13.4% vs. 4.0%), and in Latino households (18.4% vs. 2.4% of white households).

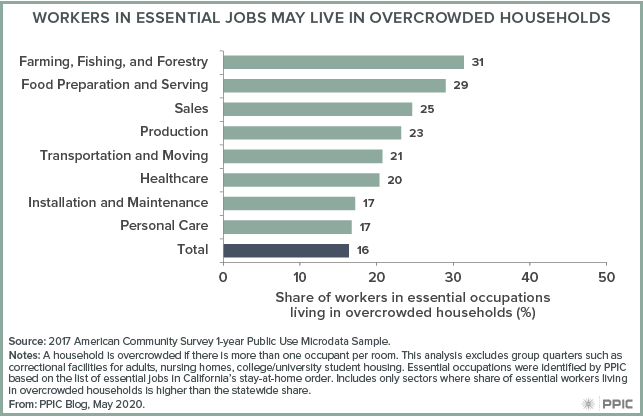
While most Californians have been staying home to reduce coronavirus transmission, essential workers do not have the option to shelter in place. Over one-third of California’s labor force works in essential occupations that require being physically present. Compared to nonessential workers, they are at higher risk of infection because they continue to circulate among others despite the shutdown.

Essential workers are more likely than nonessential workers to live in overcrowded housing—16 percent versus 12 percent. That share is almost double for workers in farming (31%), and food preparation/serving (29%).

Figure - Workers in Essential Jobs May Live in Overcrowded Households

A recent study confirms that essential workers and those in larger households do face a higher risk of contracting coronavirus. It would be ideal to explore the relationship between COVID-19 cases and workers living in crowded conditions. However, inconsistent testing availability across regions makes cases an unreliable measure of the virus’s geographic spread; deaths, which are better measured, are a valuable proxy.

There is a clear link between COVID-19 deaths and essential workers who live in overcrowded homes, though the relationship is muddied by regional differences in terms of the age structure of the population,  underlying health conditions, and other factors. Santa Barbara (25%), Madera (23%), Los Angeles (21%), Orange (20%), and Tulare (19%) counties have the highest shares of essential workers in overcrowded homes. Los Angeles and Tulare are experiencing large numbers of deaths per capita, at 14 and 9 deaths per 100,000 people, but the other counties are not.[/vc_column_text][/vc_column][/vc_row][vc_row max_width=”80″ visibility=”visible-desktop”][vc_column][vc_column_text][infogram id=”1p375951mzw3k9c0mex60d30kdidymqxjlx?live”][/vc_column_text][/vc_column][/vc_row][vc_row max_width=”80″ visibility=”visible-tablet-landscape”][vc_column][vc_column_text]

[infogram id=”1p375951mzw3k9c0mex60d30kdidymqxjlx?live”]

[/vc_column_text][/vc_column][/vc_row][vc_row visibility=”visible-tablet-portrait”][vc_column][vc_column_text]

[infogram id=”1p375951mzw3k9c0mex60d30kdidymqxjlx?live”]

[/vc_column_text][/vc_column][/vc_row][vc_row visibility=”visible-phone”][vc_column][vc_column_text]

[infogram id=”1p375951mzw3k9c0mex60d30kdidymqxjlx?live”]

[/vc_column_text][/vc_column][/vc_row][vc_row][vc_column][vc_column_text]California will lift some shelter-in-place restrictions in the coming days, and more people will leave their homes to work. Examining work and living conditions together can identify areas where people are least able to take effective actions against the spread of the coronavirus. Designing policies to protect the health of workers and their households will be critical to managing COVID-19 while restarting the state’s economy.[/vc_column_text][/vc_column][/vc_row]

Coping with High Housing Costs in College

California’s housing crisis affects college students around the state. Over the past eight years—even as tuition has been stable at California’s public colleges and universities—the cost of attending college has risen because housing costs have gone up. Most students at California’s community colleges and in the California State University system pay more for housing than they do for tuition. At the University of California, housing costs are on par with tuition (for those who pay full tuition).

One way students limit their housing costs is by living with their parents or other family members. For most students, living at home is much cheaper than living in housing provided by the university or in an apartment off campus. Housing costs vary across systems, but in every case living with family is much less expensive than other housing options. And the savings are large—as much as $10,000 a year.

figure - It’s Far Cheaper for College Students to Live at Home

In fact, the large majority of California undergraduates do live at home (69% in 2017), and that share has been increasing over the past few decades, according to the American Community Survey. Moreover, California college students are substantially more likely to live at home than their counterparts in the rest of the nation.

figure - Most California Undergraduates Live at Home

Partly, this difference reflects the mix of colleges in California. Community college students are especially likely to live with parents—not surprising given the broad geographic coverage of this system. And CSU students are more likely to live at home than UC students. But the difference in living situations between California students and their peers nationwide almost certainly reflects California’s higher housing costs.

Living at home while attending college can be a great way to reduce costs. But it also has a downside. Research suggests that students who live at home are less connected to their college—and less likely to graduate.

California’s colleges and universities cannot solve the state’s housing crisis, but many of them are working to expand on-campus housing opportunities. They are also working with the state to develop ways to expand grants to cover housing costs as well as tuition. The governor’s proposed budget includes $40 million to provide emergency housing support for UC and CSU students (including those struggling with homelessness).

With no quick solution to the high cost of housing in California, thoughtful actions will be critical to providing support to college students across the state.

Interactive: Will Housing Costs Drive Californians Away?

[vc_row][vc_column][vc_column_text]Home values and rental markets in California are among the most expensive in the nation, and supply shortages continue to put upward pressure on housing prices. Over the last decade, the state averaged fewer than 80,000 new homes annually—far below the estimated need of 180,000 additional units each year, according to a recent report from the California Department of Housing and Community Development.

In our March survey, we found that a record-high share of Californians (68%) believe that housing affordability is a big problem in their region, and 47% are seriously considering moving away from the part of the state they live in now due to housing costs.

The interactive below allows you to take a closer look at how interest in moving due to housing costs varies across demographic groups. For example, Los Angeles County residents (39%) are the most likely to say housing costs have made them seriously consider moving out of the state, with another 13% saying they’re considering moving elsewhere in California. Overall, half of coastal residents say they’re seriously thinking about moving away from where they live now.

Young adults are also much more likely to have considered moving than older residents. More than half (56%) of young adults age 18–34 have seriously thought about moving due to housing costs—including four in ten who have considered leaving the state—compared to 38% of adults over 55.

We hope this interactive sheds light on Californians’ perceptions of housing costs. As the new governor and state legislature work on their policy agendas for the year, the PPIC survey team will continue to monitor the issue of housing closely.[/vc_column_text][/vc_column][/vc_row][vc_row][vc_column][vc_raw_html]JTNDZGl2JTIwY2xhc3MlM0QlMjd0YWJsZWF1UGxhY2Vob2xkZXIlMjclMjBpZCUzRCUyN3ZpejE1NTU3MDc3NzcyNTUlMjclMjBzdHlsZSUzRCUyN3Bvc2l0aW9uJTNBJTIwcmVsYXRpdmUlMjclM0UlM0Nub3NjcmlwdCUzRSUzQ2ElMjBocmVmJTNEJTI3aHR0cHMlM0ElMjYlMjM0NyUzQiUyNiUyMzQ3JTNCd3d3LnBwaWMub3JnJTI2JTIzNDclM0JibG9nJTI2JTIzNDclM0JpbnRlcmFjdGl2ZS13aWxsLWhvdXNpbmctY29zdHMtZHJpdmUtY2FsaWZvcm5pYW5zLWF3YXklMjclM0UlM0NpbWclMjBhbHQlM0QlMjclMjAlMjclMjBzcmMlM0QlMjdodHRwcyUzQSUyNiUyMzQ3JTNCJTI2JTIzNDclM0JwdWJsaWMudGFibGVhdS5jb20lMjYlMjM0NyUzQnN0YXRpYyUyNiUyMzQ3JTNCaW1hZ2VzJTI2JTIzNDclM0JNYSUyNiUyMzQ3JTNCTWFueUNhbGlmb3JuaWFuc0FyZVRoaW5raW5nb2ZNb3ZpbmdkdWV0b0hvdXNpbmdDb3N0cyUyNiUyMzQ3JTNCQ3Jvc3N0YWJzJTI2JTIzNDclM0IxX3Jzcy5wbmclMjclMjBzdHlsZSUzRCUyN2JvcmRlciUzQSUyMG5vbmUlMjclMjAlMkYlM0UlM0MlMkZhJTNFJTNDJTJGbm9zY3JpcHQlM0UlM0NvYmplY3QlMjBjbGFzcyUzRCUyN3RhYmxlYXVWaXolMjclMjAlMjBzdHlsZSUzRCUyN2Rpc3BsYXklM0Fub25lJTNCJTI3JTNFJTNDcGFyYW0lMjBuYW1lJTNEJTI3aG9zdF91cmwlMjclMjB2YWx1ZSUzRCUyN2h0dHBzJTI1M0ElMjUyRiUyNTJGcHVibGljLnRhYmxlYXUuY29tJTI1MkYlMjclMjAlMkYlM0UlMjAlM0NwYXJhbSUyMG5hbWUlM0QlMjdlbWJlZF9jb2RlX3ZlcnNpb24lMjclMjB2YWx1ZSUzRCUyNzMlMjclMjAlMkYlM0UlMjAlM0NwYXJhbSUyMG5hbWUlM0QlMjdzaXRlX3Jvb3QlMjclMjB2YWx1ZSUzRCUyNyUyNyUyMCUyRiUzRSUzQ3BhcmFtJTIwbmFtZSUzRCUyN25hbWUlMjclMjB2YWx1ZSUzRCUyN01hbnlDYWxpZm9ybmlhbnNBcmVUaGlua2luZ29mTW92aW5nZHVldG9Ib3VzaW5nQ29zdHMlMjYlMjM0NyUzQkNyb3NzdGFicyUyNyUyMCUyRiUzRSUzQ3BhcmFtJTIwbmFtZSUzRCUyN3RhYnMlMjclMjB2YWx1ZSUzRCUyN25vJTI3JTIwJTJGJTNFJTNDcGFyYW0lMjBuYW1lJTNEJTI3dG9vbGJhciUyNyUyMHZhbHVlJTNEJTI3bm8lMjclMjAlMkYlM0UlM0NwYXJhbSUyMG5hbWUlM0QlMjdzdGF0aWNfaW1hZ2UlMjclMjB2YWx1ZSUzRCUyN2h0dHBzJTNBJTI2JTIzNDclM0IlMjYlMjM0NyUzQnB1YmxpYy50YWJsZWF1LmNvbSUyNiUyMzQ3JTNCc3RhdGljJTI2JTIzNDclM0JpbWFnZXMlMjYlMjM0NyUzQk1hJTI2JTIzNDclM0JNYW55Q2FsaWZvcm5pYW5zQXJlVGhpbmtpbmdvZk1vdmluZ2R1ZXRvSG91c2luZ0Nvc3RzJTI2JTIzNDclM0JDcm9zc3RhYnMlMjYlMjM0NyUzQjEucG5nJTI3JTIwJTJGJTNFJTIwJTNDcGFyYW0lMjBuYW1lJTNEJTI3YW5pbWF0ZV90cmFuc2l0aW9uJTI3JTIwdmFsdWUlM0QlMjd5ZXMlMjclMjAlMkYlM0UlM0NwYXJhbSUyMG5hbWUlM0QlMjdkaXNwbGF5X3N0YXRpY19pbWFnZSUyNyUyMHZhbHVlJTNEJTI3eWVzJTI3JTIwJTJGJTNFJTNDcGFyYW0lMjBuYW1lJTNEJTI3ZGlzcGxheV9zcGlubmVyJTI3JTIwdmFsdWUlM0QlMjd5ZXMlMjclMjAlMkYlM0UlM0NwYXJhbSUyMG5hbWUlM0QlMjdkaXNwbGF5X292ZXJsYXklMjclMjB2YWx1ZSUzRCUyN3llcyUyNyUyMCUyRiUzRSUzQ3BhcmFtJTIwbmFtZSUzRCUyN2Rpc3BsYXlfY291bnQlMjclMjB2YWx1ZSUzRCUyN3llcyUyNyUyMCUyRiUzRSUzQ3BhcmFtJTIwbmFtZSUzRCUyN2ZpbHRlciUyNyUyMHZhbHVlJTNEJTI3cHVibGlzaCUzRHllcyUyNyUyMCUyRiUzRSUzQyUyRm9iamVjdCUzRSUzQyUyRmRpdiUzRSUyMCUyMCUyMCUyMCUyMCUyMCUyMCUyMCUyMCUyMCUyMCUyMCUyMCUyMCUyMCUyMCUzQ3NjcmlwdCUyMHR5cGUlM0QlMjd0ZXh0JTJGamF2YXNjcmlwdCUyNyUzRSUyMCUyMCUyMCUyMCUyMCUyMCUyMCUyMCUyMCUyMCUyMCUyMCUyMCUyMCUyMCUyMCUyMCUyMCUyMCUyMHZhciUyMGRpdkVsZW1lbnQlMjAlM0QlMjBkb2N1bWVudC5nZXRFbGVtZW50QnlJZCUyOCUyN3ZpejE1NTU3MDc3NzcyNTUlMjclMjklM0IlMjAlMjAlMjAlMjAlMjAlMjAlMjAlMjAlMjAlMjAlMjAlMjAlMjAlMjAlMjAlMjAlMjAlMjAlMjAlMjB2YXIlMjB2aXpFbGVtZW50JTIwJTNEJTIwZGl2RWxlbWVudC5nZXRFbGVtZW50c0J5VGFnTmFtZSUyOCUyN29iamVjdCUyNyUyOSU1QjAlNUQlM0IlMjAlMjAlMjAlMjAlMjAlMjAlMjAlMjAlMjAlMjAlMjAlMjAlMjAlMjAlMjAlMjAlMjAlMjAlMjAlMjBpZiUyMCUyOCUyMGRpdkVsZW1lbnQub2Zmc2V0V2lkdGglMjAlM0UlMjA4MDAlMjAlMjklMjAlN0IlMjB2aXpFbGVtZW50LnN0eWxlLndpZHRoJTNEJTI3MTAwJTI1JTI3JTNCdml6RWxlbWVudC5zdHlsZS5oZWlnaHQlM0QlMjhkaXZFbGVtZW50Lm9mZnNldFdpZHRoJTJBMC43NSUyOSUyQiUyN3B4JTI3JTNCJTdEJTIwZWxzZSUyMGlmJTIwJTI4JTIwZGl2RWxlbWVudC5vZmZzZXRXaWR0aCUyMCUzRSUyMDUwMCUyMCUyOSUyMCU3QiUyMHZpekVsZW1lbnQuc3R5bGUud2lkdGglM0QlMjcxMDAlMjUlMjclM0J2aXpFbGVtZW50LnN0eWxlLmhlaWdodCUzRCUyOGRpdkVsZW1lbnQub2Zmc2V0V2lkdGglMkExLjc3JTI5JTJCJTI3cHglMjclM0IlN0QlMjBlbHNlJTIwJTdCJTIwdml6RWxlbWVudC5zdHlsZS53aWR0aCUzRCUyNzEwMCUyNSUyNyUzQnZpekVsZW1lbnQuc3R5bGUubWluSGVpZ2h0JTNEJTI3NzgwcHglMjclM0J2aXpFbGVtZW50LnN0eWxlLm1heEhlaWdodCUzRCUyOGRpdkVsZW1lbnQub2Zmc2V0V2lkdGglMkExLjc3JTI5JTJCJTI3cHglMjclM0IlN0QlMjAlMjAlMjAlMjAlMjAlMjAlMjAlMjAlMjAlMjAlMjAlMjAlMjAlMjAlMjAlMjAlMjAlMjAlMjAlMjAlMjB2YXIlMjBzY3JpcHRFbGVtZW50JTIwJTNEJTIwZG9jdW1lbnQuY3JlYXRlRWxlbWVudCUyOCUyN3NjcmlwdCUyNyUyOSUzQiUyMCUyMCUyMCUyMCUyMCUyMCUyMCUyMCUyMCUyMCUyMCUyMCUyMCUyMCUyMCUyMCUyMCUyMCUyMCUyMHNjcmlwdEVsZW1lbnQuc3JjJTIwJTNEJTIwJTI3aHR0cHMlM0ElMkYlMkZwdWJsaWMudGFibGVhdS5jb20lMkZqYXZhc2NyaXB0cyUyRmFwaSUyRnZpel92MS5qcyUyNyUzQiUyMCUyMCUyMCUyMCUyMCUyMCUyMCUyMCUyMCUyMCUyMCUyMCUyMCUyMCUyMCUyMCUyMCUyMCUyMCUyMHZpekVsZW1lbnQucGFyZW50Tm9kZS5pbnNlcnRCZWZvcmUlMjhzY3JpcHRFbGVtZW50JTJDJTIwdml6RWxlbWVudCUyOSUzQiUyMCUyMCUyMCUyMCUyMCUyMCUyMCUyMCUyMCUyMCUyMCUyMCUyMCUyMCUyMCUyMCUzQyUyRnNjcmlwdCUzRQ==[/vc_raw_html][/vc_column][/vc_row]

High Housing Costs Hurt College Affordability

A majority of Californians say affordability is a problem in the state’s public colleges and universities, according to the PPIC Statewide Survey. In addition, three-quarters of residents in the survey agree that the price of college prevents students who are qualified and motivated from going to college. Not surprisingly, state leaders are exploring new strategies to help students and families better cope with college costs. Most current approaches, such as state and institutional financial aid, focus primarily on tuition relief. This makes sense, as tuition more than doubled at California universities from 2006 to 2012—and is on the rise again.

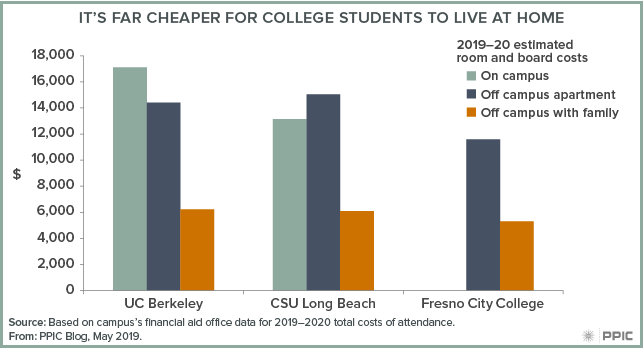
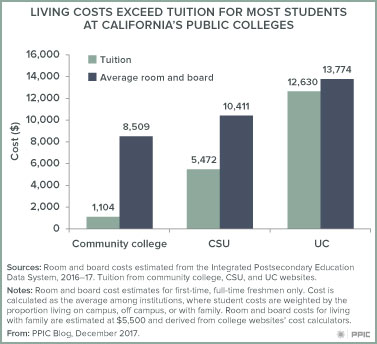
However, housing costs also play a significant role in the total cost of attending college. Californians are well aware of the issue: 85% of residents in the PPIC survey say colleges and universities should do more to make sure that all students have affordable housing options. Indeed, even with the rapid increases in tuition, living costs for many students exceed tuition at California’s public institutions—the state’s community colleges, California State University (CSU), and the University of California (UC). Average room and board costs also differ substantially across the three systems, from $8,509 per year at the community colleges to $13,774 at UC.

These differences in costs are related to whether students live on campus, off campus on their own, or off campus with family. Estimated average costs of housing and food for students living on campus top $13,000 per year, and those living off campus pay an average of $10,000 to $13,000 in room and board. The costs associated with living with family are not estimated in the available federal data, but most college websites suggest these costs range from $5,000 to $6,000—about half the cost of living on or off campus.

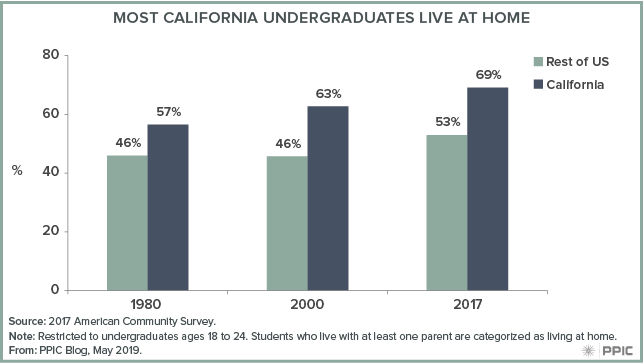
Students’ housing choices also partially depend on where they go to school. Only nine cities in California have UC campuses (excluding UCSF which only enrolls graduate students), and most UC freshmen live on campus in their first year. Historically, the 113 community colleges and 23 CSU campuses have been seen as local and low-cost options. Indeed, both systems show about 30% or more of freshmen living with their families, which helps keep average room and board costs lower than at UC. But it is worth noting that the share of CSU freshmen living on campus may grow. More dorms are being built on CSU campuses as administrators see on-campus housing as a strategy to increase graduation rates. Data on students’ living arrangements are based on institutional reporting on freshmen who receive some sort of federal financial aid, which includes more than 60% of students at most institutions.

As state leaders reexamine the goals in the 1960 Master Plan for Higher Education and consider changes to financial aid, they should take into account the role that living costs play in the total cost of education.

Learn moreRead the PPIC Statewide Survey: Californians and Higher Education
Visit the PPIC Higher Education Center

Video: Strategies for Reducing Child Poverty

High housing costs and low-wage work make it hard for low-income Californians to meet their basic needs. The result? Nearly a quarter of California’s youngest residents live in poverty—a fact with profound educational, health, and economic repercussions now and in the future. Social safety net benefits help low-income families supplement their incomes but do not reach the working poor in high-cost areas and the very poor across the state.

A new PPIC report examines how high housing costs and low wages contribute to child poverty. It also looks at additional policy approaches: an expansion of the Earned Income Tax Credit, establishment of a state child credit, and an overhaul of the state renter’s credit. Each approach holds promise, and each involves trade-offs.

Researcher Caroline Danielson presented the report in Sacramento last week. She also demonstrated an interactive tool that allows for a deeper exploration of how policy changes could affect California’s diverse counties. It underscores the need for policymakers to be strategic in determining how best to help families in need throughout the state.

Explore the accompanying tool Interactive: Reducing Child Poverty in California.

Housing Costs and Higher Education

Homeownership Figure
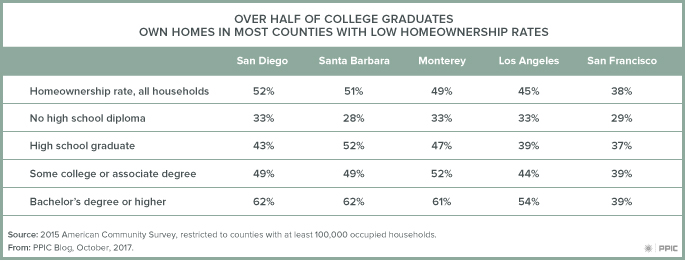
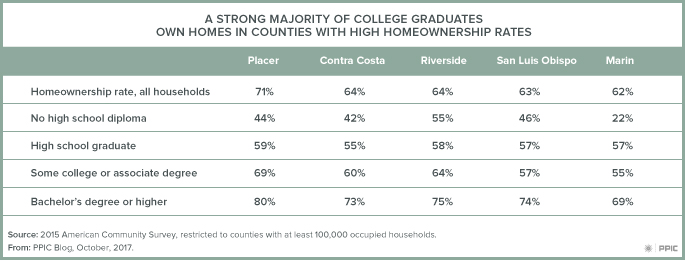
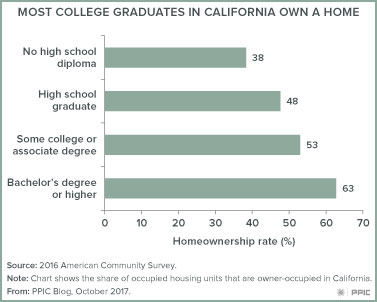
Owning a home has long been part of the American dream. But with the state’s high housing costs, homeownership is difficult for many Californians to achieve. In a recent PPIC Statewide Survey, more than half of renters say the cost of housing is making them seriously consider moving away from the part of California they live in now, with most of those indicating that they are thinking of leaving the state.

Homeownership rates are substantially lower in California than in the rest of the United States (54% vs. 63% in 2016, according to the American Community Survey). But one group in California fares relatively well with respect to homeownership: college graduates. Among heads of household with at least a bachelor’s degree, almost two-thirds own rather than rent, compared to less than half of high school graduates. The higher rates of homeownership among college graduates are a consequence of their economic success. As shown in other PPIC research, college graduates have much higher incomes and lower unemployment rates than other Californians, enabling many of them to purchase a home.  Owning a home, in turn, often leads to greater wealth. Indeed, the higher net worth of college graduates in California is strongly tied to homeownership.

Of course, housing markets are regional, and the coastal areas of California are less affordable for everyone. The five counties with the lowest homeownership rates are all in coastal areas with high housing prices. But even in those counties—with the notable exception of San Francisco—over half of college graduates own a home. At the other extreme, counties with the highest homeownership rates are primarily suburban counties, including some with high housing costs. About 70% or more of college graduates in these areas own a home.


California policymakers have recently enacted a series of measures designed to increase the supply of housing, with a focus on affordable housing units. Certainly, the state’s housing crisis cannot be alleviated without building more housing. But while higher education is not often considered part of a housing agenda, it has played an important role in shielding many Californians from the state’s dramatic increases in housing costs. Because of the labor market advantages experienced by college graduates, many have been able to purchase a home, giving them more stability in their housing costs and allowing many of them to build wealth.

Child Poverty and California’s High Cost of Living

A quarter of young children in California live in poverty, yet the local variation in poverty rates is dramatic. Our recent report shows, for example, that the areas with the lowest and highest rates of child poverty in the state are less than 20 miles apart: child poverty is 4% in Redondo Beach, Manhattan Beach, and Hermosa Beach in Los Angeles County and 68% near southeastern LA City. (Data is for 2011–2014 combined, the most recent available).

Families adapt to California’s high cost of living in ways that vary across the state. The interactive map that accompanies our report allows stakeholders to investigate how their local area (defined to have a population of roughly 100,000) stacks up relative to other areas, their region, and the state as a whole.

For example, Selma, Kerman, and Coalinga make up a local area just west and south of Fresno. The area has a relatively high poverty rate of 30% among young children. Most of these children’s parents have limited education: 55% lack a high school degree compared with a statewide average of 37%. But for the most part they are working full-time (62% vs. 50% statewide). They also report the lowest annual housing costs ($5,888) of any area in the state. (We standardized this cost to represent a family of four.) This means they have a relatively low housing burden. Specifically, 18% of families living in poverty in this area use over half of their family resources to pay for housing, compared to the statewide average of 32%.

At the same time, 52% of poor children in this area live in overcrowded housing—about the same as in the state as a whole (55%) and higher than the regional average in the Central Valley (46%). Also, the share of working parents in these poor families who commute 60 minutes or more each way is relatively high at 14%, compared with 10% in the state as a whole.

In sum, the picture that emerges shows families of young children in poverty in this local area tend to have low housing costs relative to other parts of the state. Nevertheless, the cost of housing in inland California is still high compared to the rest of the country, and the data suggest poor families with young children in Selma, Kerman, and Coalinga are indeed making adaptations to cope with these costs—such as living in more crowded conditions and, in some cases, commuting long distances.

Child poverty is a difficult problem, both because it is so high in California and because the family circumstances that poor children experience can differ so much. Investigating varying patterns of housing and commuting across the state can help suggest how policies aimed at reducing the incidence—or severity—of poverty can be tailored to meet local and regional needs.