Without Testing, Challenges for School Districts Add Up

Distance learning due to COVID-19 is not going to be a temporary phenomenon. Now, with K–12 campuses closed since mid-March and likely to stay shuttered for the remainder of the school year, students will miss out on about a third of their 180 in-person instructional days. The timing of these closures means no statewide end-of-year standardized tests, posing significant difficulties for teachers and districts when schools reopen.

Even before most districts announced the end of in-person classrooms, most California public school parents expressed concerns over providing productive learning at home—70% say they are somewhat or very concerned, in PPIC’s April Statewide Survey.

And success at distance learning for some students is uncertain because access to the internet and devices, curriculum, the demands of home life, and learning needs—especially for English Learners and students with disabilities—can vary so widely. Differences are already being revealed—according to a survey of public school teachers in late April, 25% of students are not logging in or making contact with their teachers during distance learning. In districts where poverty rates exceed three-quarters of the student population, 36% of students are not in contact with their teachers.

When schools do reopen, teachers must determine how to accelerate the learning of students who fell behind—whether opening happens in July, as Governor Newsom has advocated, or through expanded summer school, or on planned fall start dates. And without results from spring 2020 standardized tests, helping students catch up may require a sustained effort.  Some local education agencies are making plans to use formative assessments to assist in reopening, given that California, like all other states, has received a waiver for the federally required statewide assessments.

Typically, students in grades 3–8 and in grade 11 take statewide standardized tests in the spring. These tests of English language arts, math, and science help measure student learning during the year and may be used to place students in fall math courses. Such end-of-year assessments to gauge student learning are essential to California’s accountability system.

The results can also give teachers more insight into the mix of students who show up in their classroom in the fall, as well as identify schools and districts in need of extra support.  For 11th graders, the assessments can signal how prepared they are for the rigors of college coursework: the results are later used to place students in English and math in the CSU system.

Furthermore, few districts completed the standardized tests that measure the English proficiency of English Learners before spring closures, tests that determine if students can exit English Learner status. In some districts, English proficiency test results determine the courses students take in the fall.

Given how rapidly the COVID-19 crisis unfolded, these test cancellations were unavoidable.  But the absence of test results compounds the challenges of reopening schools: teachers will lack vital knowledge about how distance learning has impacted their students.

Teachers and school staff will likely conduct plenty of assessing on their own, planning lessons for the diverse needs of their students. The hope is their efforts can smooth the way for students’ return to their classrooms; but we are at least a year away from understanding how the crisis has impacted our students systemwide.

Are K–12 Students Keeping Pace in English?

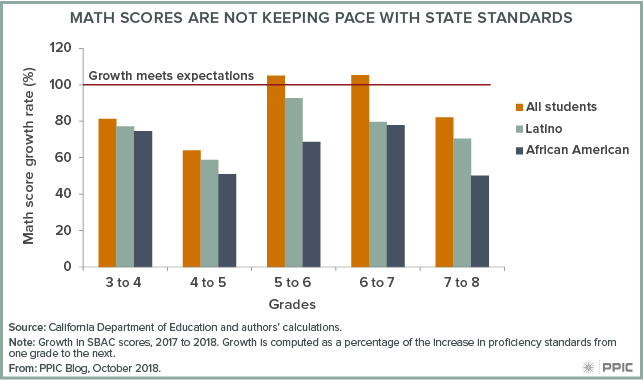
Last month, we wrote about how newly released 2018 SBAC test score data show that student growth in math has been insufficient to keep pace with grade-level proficiency standards. And though student growth in math proficiency is accelerating, racial disparities are widening as students progress through school.

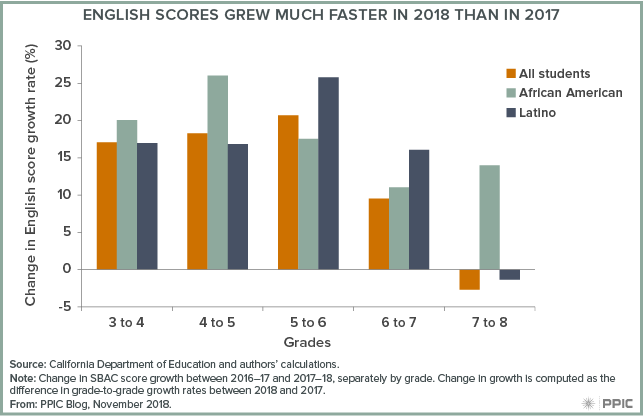
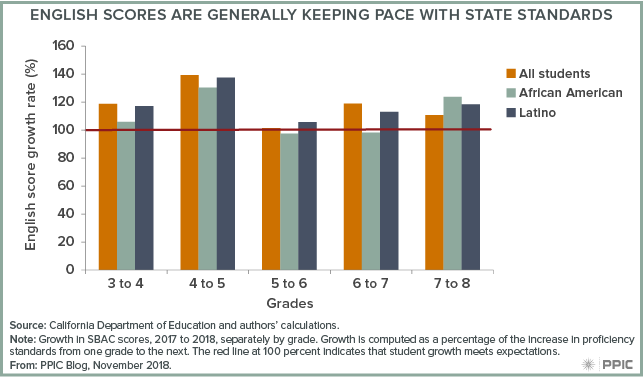
The picture is somewhat more promising for English. Growth in English test scores generally outpaced the state standards—meaning more students were gaining mastery of English than in prior years. Moreover, the growth in 2018 English scores was much higher than in 2017.

The figure below shows the growth in English test scores from grade to grade—how last year’s third graders performed in fourth grade, and so on—relative to the growth in the score required for proficiency in each grade. A growth rate of greater than 100% indicates that average student progress is outpacing what is expected by the standards, while growth of less than 100% suggests progress is not keeping pace with standards.

Across all grades, growth in average student test scores outpaced growth in grade-level proficiency standards. This year’s 5th graders showed particular improvement, with average growth outpacing the standards by 40%. In other words, many more 5th graders are meeting standards in English than they were last year in 4th grade (49.4% vs 45.1% to be exact).

But in most grades, racial disparities in English achievement are still growing with each grade progression: the scores of African American and Latino students grew less than the average student’s scores. However, the pattern is reversed in between grades 7 and 8, where African American and Latino scores grew more than average, reducing these disparities somewhat. In addition, the disparities in English score growth are notably smaller than the disparities in math.

We also see improvements when we compare growth rates between 2017 and 2018. Growth in grades 4 to 7 accelerated considerably in 2018—for example, among Latino sixth graders, English test scores improved a little over 25% more than the scores of their counterparts in 2017—though growth in grade 8 was slightly slower compared to 2017. African American student progress was especially noteworthy, with growth improving more than the average student across four of five grades. While the previous figure shows that achievement gaps still grow slightly as students progress through school, these gaps in growth are small and shrinking.

Looking at the grade-to-grade growth of the same cohorts of students provides a lens to examine whether students are keeping up with grade-level expectations, and whether achievement gaps are shrinking or growing as students advance through school. These findings generate hope that recent reforms are bearing fruit, but there is yet more work to be done. Despite progress in 2018, just under half of our students in grades 3–8 and 11 are proficient at their grade level in English, and less than 40% are in math. Sustaining and improving on this growth will be key to addressing these shortcomings in student achievement.

Are K–12 Students Keeping Pace in Math?

The California Department of Education recently released 2018 SBAC test scores that showed very modest improvement. Since last year, the percent of students meeting or exceeding state standards grew 1.1 percentage points in math. But focusing only on these year-to-year comparisons means that we miss the longer-term picture. That is, we don’t see how the same group of students are progressing over time. When we look at SBAC math scores in this manner, we have some cause for concern—but there are bright spots, too.

In the figure below, we show the growth in math test scores from grade to grade—that is, we can see how last year’s third graders performed in fourth grade, and so on.  If growth is less than 100 percent, students aren’t keeping up with grade-level standards. If it is greater than 100 percent, student growth is outpacing what is expected by the standards. For instance, fourth grade students gained roughly 80 percent of the increase needed to keep pace with the proficiency standards.

Across all grades student scores grew, but only in grades 6 and 7 did the average student growth keep pace with the growth in standards. In all other grades students fell behind, with fewer keeping pace with the growth in grade-level standards. Perhaps more discouraging, the math scores of African American and Latino students grew less than the average student across all grades, meaning that racial and ethnic disparities are growing as students progress through school. These results suggest that growth among low-income students also lags the standards, since African American and Latino students account for more than 75 percent of economically disadvantaged students.

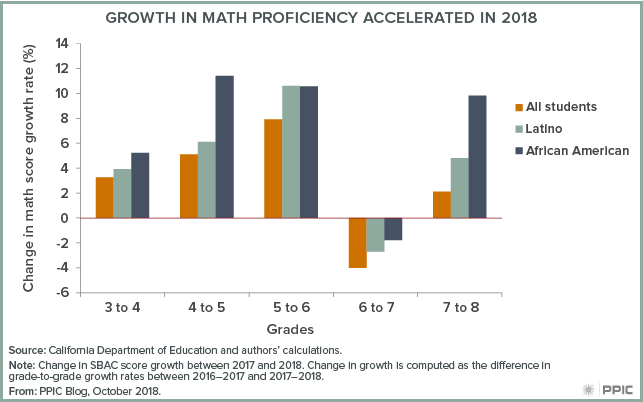
There is a silver lining in the 2018 growth numbers. Across most grades, growth in math was higher in 2018 than it was in 2017, meaning that fewer students are falling behind as they progress through school. This can be seen in the figure below, which shows how math score growth has changed between 2017 and 2018. Growth did slow for seventh graders, yet as the previous figure shows they still managed enough growth to outpace state standards, despite the slowdown.

Also encouraging: racial disparities in growth rates are smaller in 2018 than they were in 2017, as African American and Latino student improvement in math was greater than average student improvement across every grade. For instance, among African American fifth graders math scores improved about 11 percent more in 2018 than their counterparts’ improved in 2017. Thus, while achievement gaps still grow as students advance, gaps in growth are shrinking, and these disparities are growing more slowly than in years prior.

Standardized Testing and College Eligibility

In California and across the nation, there has been a growing focus on increasing college access by improving college readiness for high school students and encouraging more eligible students to attend college. To this end, many states and educational institutions have changed how they use college entrance exams like the SAT and ACT.

One approach has been to have more students take the SAT or ACT in hopes of identifying those who are eligible for college but might not have taken a college entrance exam on their own. As of 2016–17, 25 states use the SAT or ACT as their standardized test for 11th graders.

Assemblymember O’Donnell (D-Long Beach) has proposed AB 1951, which would give districts the option to use the SAT or ACT in place of California’s 11th-grade standardized test. Though Governor Brown vetoed the bill at the end of the 2017–18 legislative session, O’Donnell promised to bring it back in the next session, when California has a new governor.

But even as many states are administering the SAT or ACT to all students, a growing number of colleges and universities are dropping these tests as an entrance requirement. Citing concerns about biases in the exams, as well as the extra financial or time constraints for students, liberal arts colleges like Mills College in California and prominent universities such as the University of Chicago have made submitting test scores optional. Currently, California State University (CSU) does not require students to submit an SAT score (though most still do) if they meet the high school GPA threshold of 3.0 or higher. Despite this trend, most four-year colleges continue to use college entrance exams in their admissions decisions and a growing share of high school graduates take either the SAT or ACT.

In his veto message, the governor suggested another possible way to expand eligibility. California universities could consider using the state’s standardized test (SBAC) as an eligibility measure. All California 11th graders in public schools take the SBAC, which is aligned with the Common Core State Standards and is already used as an early diagnostic of college readiness at CSU and many community colleges. New evidence suggests that the SBAC does as well as the SAT in predicting first-year performance at California’s public universities.

Any of these strategies could increase the number of students eligible for California’s universities—but not all of them would work well together. For example, the University of California and CSU are further scrutinizing the role of the SAT in the admissions process. If the systems decide to drop the SAT requirement, then AB 1951 might have less of an impact. Looking forward, as state policymakers and districts continue to craft policies to improve college access, they should first consider how California’s universities are using—or not using—standardized tests.


California’s K–12 Educational Progress: Good News and Bad News

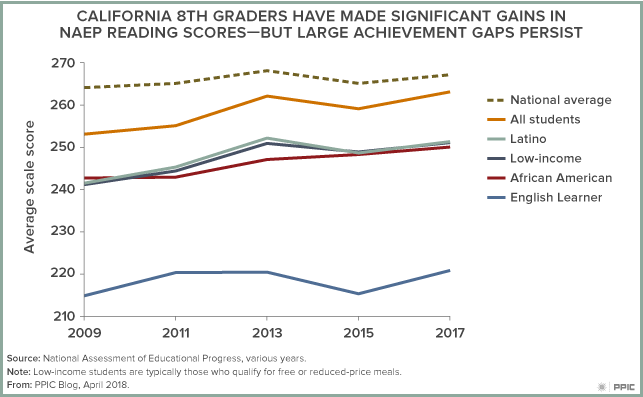
New data on the educational progress of California’s K–12 students offers a mixed picture: there have been sizable gains in grade 8 reading scores, but more work is needed to close achievement gaps for English Learner, low-income, and African American and Latino students.

The data comes from the 2017 National Assessment of Educational Progress (NAEP), commonly referred to as the nation’s report card. Administered periodically in grades 4, 8, and 12, NAEP serves as a common yardstick for states and informs many national policy decisions.

The NAEP results show that the average reading score for California 8th graders has risen from 259 to 263. While the latest score is still below the national average (267), it marks a significant improvement, and the state’s 4 point gain is larger than the 1 point increase at the national level. The increase is driven by improvement at both ends performance scale: fewer students performed at the lowest level and more students performed at the advanced level.

However, there were no significant improvements in grade 8 math and no gains in either subject in grade 4. Also, California did not see any significant narrowing of its student achievement gaps. For instance, the average reading score for Latino students in grade 8 was 27 points lower than that of white students; this gap is not significantly different from the 30 point gap in 1998. Similarly, the average score for low-income students was 28 points lower than that of other students, and that gap is not different than it was as in 1998 (32 points).

Naep Score Figure

The NAEP results provide a useful benchmark of student performance; this is especially important in light of the sea changes under way in California’s public K–12 system. The state revamped its school finance and accountability systems with a focus on improving outcomes among English Learners and other “high-need” students. It also adopted new educational standards in math, English language arts, science, and English language development, and implemented a new assessment system.

A recent PPIC survey finds that a solid majority of adults believe that the financial reforms, in particular, will improve the achievement of English Learners and low-income students. As the reforms take hold, PPIC will continue to monitor their impact.

Improving Math Placement Decisions

A new state law is intended to help ensure that all students—particularly those underrepresented in higher education—have access to rigorous math courses in high school. This is a key step to improving college readiness and closing achievement gaps. The centerpiece of the California Mathematics Placement Act is the requirement that districts create and implement a fair, objective, and transparent math placement policy. The law leaves many aspects of implementation up to the districts.

PPIC surveyed the state’s school districts during the 2015–16 school year to examine their placement policies and identify district needs right before the law took effect in 2016–17. In a new report, Math Placement in California’s Public Schools, research fellow Niu Gao and research associate Sara Adan found that districts face a number of challenges in implementing the law. Gao presented the report at a recent Sacramento briefing.

One issue is particularly complex: teacher recommendations. The new law calls for limiting their use due to concerns that they may be systematically biased against economically disadvantaged or Latino and African American students.

The PPIC report shows that teacher recommendations are among the most widely used measures in determining placement—and the way they are used now is complicated. Recommendations typically address both academic and “soft” skills, such as student maturity, persistence, and motivation, which are predictors of student success. The PPIC authors found cases in which teacher recommendations are biased against high-achieving minority students, but they also found cases in which teacher recommendations are advancing minority students who do not perform well on standardized tests. In other words, eliminating recommendations altogether may help some students but at the expense of others.

Gao said the critical issue is not whether teacher recommendations should be used but how they can be designed to complement objective measures, such as tests.

Early Results from Education Reforms

California’s K–12 system is implementing an unprecedented number of reforms. The state’s school funding system and curriculum standards are new, as are all statewide tests. A new school accountability system is being developed. A number of large urban districts are changing their high school graduation requirements. These reforms are designed to equalize opportunities for students and close achievement gaps among demographic groups.

It will be some time before we know what all of these changes add up to, but PPIC researchers who examined the early results of two reforms presented their findings at a PPIC event in Sacramento last week.

California’s New Standardized Tests

PPIC senior fellow Laura Hill summarized the results of California’s new standardized tests, the focus of a PPIC report she coauthored. The scores show that English Learners and economically disadvantaged students are far behind other student groups—possibly farther behind than initially thought. As the accountability system evolves in the state, the test results are an important call to action for districts and schools struggling to help high-need students, Hill said. High-need students did well in some schools and districts, and the first-year results provide an opportunity to learn from their experiences.

College Prep for All?

Julian Betts, an economics professor at the University of California, San Diego, and PPIC adjunct fellow, examined a high school graduation requirement that makes college preparatory courses mandatory for all students. Major urban school districts—including Los Angeles, San Diego, San Francisco, and Oakland—recently implemented this requirement, making it mandatory for students to complete the a–g sequence of classes required for admission to the University of California or California State University. Based on a PPIC analysis of the San Diego Unified School Districts’ Class of 2016, Betts and his coauthors concluded that this requirement is likely to help many students but damage the prospects of others. He suggested steps that San Diego and other districts can take to help lower-achieving students meet the new graduation goals.

Learn more

Visit PPIC’s K–12 education pages
Visit the PPIC Higher Education Center

Video: Californians’ Views of K–12 Education

Despite increases in state spending on K–12 education, most Californians say state funding for their local public schools is inadequate. And most support an extension of the Proposition 30 tax increase on higher incomes, as well as state and local school bonds. These are among the key findings in PPIC’s 12th annual survey on Californians and education that were presented in Sacramento last week by Lunna Lopes, survey research associate.

Lopes said that concerns about the quality of education are at a record-low 40 percent, and less than a third of Californians say that teacher quality is a big problem. Concern about a teacher shortage is higher, with a majority calling it a big problem.

Among the other findings discussed:

  • There are partisan divisions on Common Core, but public school parents are confident that it will help students be college ready and develop critical thinking skills.
  • Few Californians have heard about Local Control Funding Formula, but when presented with a short description of the policy, most are supportive.
  • Californians see preschool as important for K–12 success and most prefer to spend some of the state budget surplus on early childhood education programs.

English Learners and the New State Tests

California’s K–12 students struggled on the new statewide Smarter Balanced assessments (SBAC) last year. The results highlight the challenges facing students and teachers as the state shifts to computer-based tests on new curricula with higher standards for achievement. Disadvantaged groups like low-income students and English Learners (ELs) saw much lower achievement levels than their peers, and many of the state’s 1.4 million ELs could have a harder time getting reclassified as fluent in English due to tougher testing.

Reclassified ELs are among the best performing students in the state. They consistently outperform continuing ELs and often have higher achievement levels than English-only students. Policymakers are interested in helping ELs with sufficient English skills transition more quickly out of English Learner programs, increasing their access to academic instruction in other subject areas. In the past year, 11% of English Learners—about 155,000 students—were reclassified. Altogether, almost 2.7 million students—about 43% of the state’s total enrollment—are current or former English Learners.

The State Board of Education’s guidelines for EL reclassification incorporate student performance on the state standards tests and English proficiency tests, as well as parent consultations and teacher evaluations. However, districts’ testing requirements often exceed the state’s suggestions. PPIC research found that the state’s prior assessment (the California Standards Test, or CST) was a significant hurdle for English Learners to clear in order to be reclassified. The SBAC may make this hurdle even higher.

To estimate the percentage of students who might meet their district’s reclassification criteria following the shift to SBAC, we analyzed the results of a PPIC survey on reclassification policies. This survey collected data from 300 districts, which together serve more than half of the state’s students. When moving from the CST to the SBAC, the share of students who would have met their district’s reclassification criteria falls considerably. Overall, between 45% and 64% of ELs would have met their district’s criteria on the CST, but only 16% to 26% would have met the standard on the SBAC.

This chart illustrates the share of ELs meeting reclassification standards by the rigor of their district’s CST reclassification requirement. Districts that required a CST level of Basic for reclassification would see a substantial drop in ELs meeting this standard, with 65% of students meeting the reclassification standard under CST, compared to 21% under the analogous SBAC standard. Districts with more rigorous criteria would see the share of students meeting their reclassification standard drop even lower when moving from the CST to the SBAC—from 40% to 17%.

With the new Local Control Funding Formula and the adoption of the Common Core State Standards, much of California’s K–12 education system is in flux. There are several changes looming for EL reclassification policy as well. For example, federal law now requires that the state establish uniform standards for every district, and the Smarter Balanced tests could make it much more difficult for ELs to meet the basic skills criteria for reclassification. Additionally, recent research suggests that relying solely on the English language proficiency test may suffice to determine whether a student can succeed without additional EL supports. Given the changing landscape and emerging research, the timing is right for state and district educators to reassess EL reclassification policy, ensuring that criteria are set to maximize academic success for both English Learners and reclassified students.

Source: Authors’ calculations based on California Standards Tests 2012–13 results and California Assessment of Student Performance and Progress 2014–15 results.

Note: The CST and SBAC use different achievement levels. We consider CST’s Basic and Proficient as analogous to SBAC’s Standard Nearly Met and Standard Met, respectively. About 45% of districts require that ELs score at or above Mid-Basic to be reclassified. However, due to insufficient data, the share of students who would meet that standard on the SBAC is not shown here.

The High School Exit Exam: What’s Next?

The California High School Exit Examination (CAHSEE) is likely to be a topic of discussion in the next legislative session. Enacted in 1999, the CAHSEE involves tests in English and mathematics that high school students must pass in order to graduate. Testing started in 2001, but the graduation requirement was held up for several years by legal challenges that resulted in an exemption for special education students.

The immediate issue for the legislature has to do with the adoption of the Common Core State Standards, which take effect this school year. The state overhauled its testing program in 2013, eliminating most testing in high school except grade 11 English and math tests in that are aligned to the new standards. Because CAHSEE is based on the previous standards, the question is whether to update it so that it aligns better with Common Core, find an alternative measure, or eliminate the requirement altogether. For now, passing the CAHSEE continues to be a requirement for graduation.

The question of the CAHSEE’s impact on students and schools is also an important discussion item. The proportion of 10th graders who pass the test has increased significantly, suggesting that students are better prepared in math and English. The chart below shows that 10th grade pass rates on the math test by students in the four largest racial/ethnic groups has increased each year since 2004. Gains made by Latino and black students are especially significant—their passage rates have increased 18 percent and 20 percent, respectively.

Despite these gains, recent research suggests that exit examinations do little to boost student achievement but create costs in the form of lower graduation rates. In total, 95.5 percent of 12th graders in California passed both the English and math sections of the test, meaning that 4.5 percent of students did not graduate on time at least in part because they did not pass the test. This has a bigger impact on black and Latino students, whose 12th grade pass rates remain about 5 percent below those of white and Asian students. Moreover, because these rates do not include students who dropped out of school, they may understate the impact of the CAHSEE requirement on lower-performing students.

In a 2013 report, state education superintendent Tom Torlakson recommended a number of alternatives to the CAHSEE, including successful completion of specific high school courses, new tests that would be given at the conclusion of specific English and math courses, or the new Common Core tests given in 11th grade. Any discussion of updating the requirement would raise the question of the skills students should be expected to demonstrate. The current exam tests students at an 8th or 9th grade level; making the test more difficult would put more students at risk of finishing high school without a diploma. Thus, instead of focusing on aligning the exit exam to the new standards, the legislative discussion may revolve around the benefits and costs of minimum graduation standards to schools, students, and society.