
California Needs More Math and Science Teachers

Recent reforms in educational standards—including the Common Core math standards and the Next Generation Science Standards—have altered the expectations placed on California’s teachers. Other changes, such as requiring college prep courses for high school graduation, will further increase the demand for math and science teachers. The state’s teacher workforce has already changed significantly in the past 15 years, but it will need to further evolve to meet the demands of the future.

These are a few of the challenges ahead:

  • Although the number of math and science teachers has increased in the state, there are fewer of them than in other core subjects. As a result, the average class size in math and science at all levels is larger in California than in other states. For instance, the average class size for high school science in California is 27, well above the national average (22). Similarly, average enrollment in high school math is 25, which is again higher than the national average (21).
  • The teacher workforce in math and science is aging rapidly. In 2016, the median age of the state’s math and science teachers was 44, three years older than the national average. In the next five years, California will need to replace at least 11% of these teachers due to retirement. About 12% of districts will need to replace at least 20% of their teachers.
  • The composition of the teacher workforce in math and science has changed in recent years, yet it still does not reflect the diversity of California students. In the 2000–01 school year, only 10% of math and science teachers were Latino; today, 17% of them are (while 54% of the student body is Latino). The share of Asian teachers has increased slightly, while the share of African American teachers remains unchanged. Research shows that teachers of color play a critical role in helping students of color succeed.
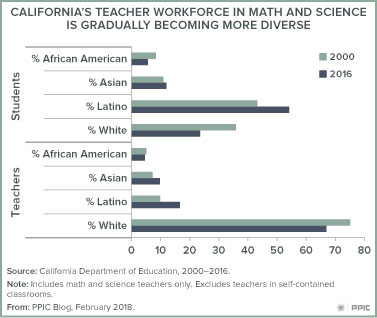
As California’s schools continue to implement new math and science standards, the challenge of developing a larger and more diverse teacher workforce will loom large. There are examples of efforts both in California and in other states designed to address some of these challenges. For example, Call Me MISTER in South Carolina aims to recruit college students to increase the incoming teacher pool, while other programs—like Boston Public Schools’ High School to Teacher Program—reach out to students in high schools. In addition, some programs focus on recruiting members of the local community (e.g., Teach Tomorrow in Oakland, the San Francisco Teacher Residency program, and the Grow Your Own programs in Illinois).

These initiatives represent potential models, but they would need to scale up quickly to address the challenges ahead. PPIC’s ongoing research into the implementation of the Next Generation Science Standards suggests that the high demand for quality science teachers is an emerging implementation concern.

 

Video: Analyzing the Standardized Test Results

California’s public school students did much better the second year they took new standardized tests, and the state is catching up to others that use the same Smarter Balanced tests. PPIC researchers Iwunze Ugo and Laura Hill take a close look at the test results in a new report, Student Achievement and Growth on California’s K–12 Assessments, which Ugo presented at a Sacramento briefing last week.

The researchers used two years of results to assess early implementation of two major statewide reforms—the Common Core curriculum and the new finance system that targets additional funding toward low-income students, English Learners, and foster youth. The PPIC report looks in depth at the test results for English Learners and economically disadvantaged students and finds that achievement gaps are not closing. Of particular concern are the districts and schools experiencing both low achievement and low growth in achievement between the first year and the second year of testing. This suggests that students who were already lagging their peers could be falling further behind.

The researchers conclude that struggling districts may need more guidance from the state—and might also look to schools and districts that have had success with high-need students.

Learn more

Read the report Student Achievement and Growth on California’s K–12 Assessments

Video: Taking the Pulse of Californians’ Views of Schools

California public schools serve more than 6 million children, more than half of them economically disadvantaged and nearly a quarter of them English Learners. Achievement gaps across socioeconomic and demographic groups of students persist despite significant progress on state standardized tests in recent years.

The state has taken steps to address these challenges by changing its school finance system and its curriculum. Implementation of these reforms is proceeding against a backdrop of uncertainty at the federal level. The annual PPIC Statewide Survey: Californians and Education examined the views of state residents generally and public school parents, in particular, of this rapidly changing environment.

The survey finds that most Californians and public school parents alike give their local public schools a grade of A or B. At the same time, majorities in each group see the current level of state funding as inadequate. Most Californians say that the wiser use of existing funds is at least part of the formula to improve school quality. In this context, majorities of residents and public school parents favor providing parents with tax-funded vouchers to send their children to any school they choose.

Asked about the impact of stepped-up federal immigration enforcement, most residents and parents express concern about the effects of these efforts on undocumented students and their families. Majorities say they favor their local district declaring itself a “sanctuary safe zone” to indicate that it will protect its undocumented students and their families.

Learn more

Read the PPIC Statewide Survey: Californians and Education
Learn more about the PPIC Statewide Survey

Three Bills Signal State of Education Policy

In this year’s busy legislative session, Governor Brown signed 316 of the nearly 800 education-related bills sent to his desk. The bills made relatively small changes on a range of issues from local parcel taxes to school disciplinary policy.

In recent years, a series of reforms—including passage of the Local Control Funding Formula (LCFF), adoption of the Common Core State Standards, and the shift to the new computer-based Smarter Balanced tests—have constituted a significant transition for the state’s 6.2 million public school students. These changes were designed to target K–12 funding for students with the greatest needs and focus teaching on the development of critical-thinking skills. Rather than signing off on legislative changes to these reforms, the governor has opted to continue their implementation while shifting some attention to challenges on the horizon.

A review of the fates of three bills, the state budget, and recent administrative actions helps illustrate the current state of education policy in California:

  • Aligning state and federal accountability rules. Earlier this year, the State Board of Education adopted a new accountability system for evaluating the progress of schools and districts in the eight priority areas—including parental involvement, school climate, and student achievement—laid out in the LCFF. The governor vetoed Assembly Bill (AB) 2548, which would have compelled the state board to align the accountability system with new federal regulations requiring the state to intervene in the lowest-performing 5% of schools. By using multiple measures, the state’s system takes a more holistic view of student achievement. But this approach makes it difficult to assign a number to each school in order to identify those that need the most help—putting it at odds with the federal government. The governor resisted changing course with his veto, but the state may need a waiver to meet the federal requirement.
  • Addressing the teacher shortage. The budget included several teacher workforce initiatives to address the state’s looming shortage, including financial assistance for classified employees interested in teaching and grants to universities encouraging four-year teacher credential programs. The governor signed AB 2248, allowing those with out-of-state credentials to teach English Learners in California. This relatively small change—which addresses one of the subject areas with an acute teacher shortage—stood out in contrast to related legislative efforts that failed, like a bill that would have provided student loan forgiveness for teachers who serve in schools with the most needs.
  • Preparing California’s students for the future. The governor also signed AB 2329, creating a 23-member advisory panel tasked with developing a strategic implementation plan to expand access to courses in computer science—a critical field for the 21st century economy. The plan would lay out the standards for a computer science curriculum and increase the number of computer science teachers, with the goal of ensuring access for all students.

These examples show that as the implementation of major education reforms continues, the governor has focused on making small tweaks to the state’s system and laying the groundwork for the coming years. As California’s leaders look toward the future, it is vital that they build a robust educational system that will be able to address both near- and long-term challenges.

Comparing College Readiness across States

How does California compare to other states in preparing students for college? This isn’t necessarily a straightforward question to answer, because most cross-state metrics, such as Advanced Placement or SAT performance, only capture the subset of students who are thinking seriously about college. However, California’s new 11th-grade assessments are aligned to college-readiness standards and administered in many other states—allowing us see how California compares to other states in preparing all students for college.

These new Smarter Balanced Assessment Consortium (SBAC) tests are aligned with the Common Core curriculum standards. The 2015–16 school year was the second year of statewide administration of these tests for students in grades 3–8 and grade 11 in California.

A high enough score on the 11th-grade test is an early guarantee that students can take college-level courses, rather than remedial courses, upon enrolling at any California State University (CSU) and most community colleges in the state. As part of California’s Early Assessment Program, students who score in the highest level (“standard exceeded”) in English language arts (ELA) or math are exempt from remediation at participating colleges. Students who score in the second highest level (“standard met”) are considered conditionally ready for college coursework and may become exempt from remediation upon successfully completing a specified course in the 12th grade. Ten other states also participate in the exam, and while the test scores don’t affect college remediation for all colleges in every state, over 200 colleges across most of the states accept the scores.

In California, 13% of 11th graders were ready for college courses in math and 20% were conditionally ready. In English, 26% were ready and an additional 33% were conditionally ready. California ranks about in the middle of all other states taking the exams, a surprising result considering previous standardized tests such as the National Assessment of Educational Progress have consistently placed California students as among the lowest-performing in the nation. Moreover, of the states using the exams, California has the largest share of students in the federal free or reduced-lunch program (a proxy for low-income status) and by far the largest share of English Learners. Students from both groups are about half as likely to be prepared for college compared with their peers. In other words, the California scores are perhaps more impressive in light of the barriers to college readiness that more California students face.


Does this mean that California is doing a good job preparing students for college? This 11th-grade test is meant to be an early signal to students of their college readiness. Students also have their senior year to prepare for college, and the readiness levels of 59% in English and 33% in math will likely improve by the end of 12th grade. However, for students who do go to college, remediation rates are still high at CSU (40%) and community colleges (80%), and haven’t changed much since the new assessments began. These results and cross-state comparisons show us that California has room for improvement and may face more challenges than other states moving forward.

Learn more
Visit the PPIC Higher Education Center

Early Results from Education Reforms

California’s K–12 system is implementing an unprecedented number of reforms. The state’s school funding system and curriculum standards are new, as are all statewide tests. A new school accountability system is being developed. A number of large urban districts are changing their high school graduation requirements. These reforms are designed to equalize opportunities for students and close achievement gaps among demographic groups.

It will be some time before we know what all of these changes add up to, but PPIC researchers who examined the early results of two reforms presented their findings at a PPIC event in Sacramento last week.

California’s New Standardized Tests

PPIC senior fellow Laura Hill summarized the results of California’s new standardized tests, the focus of a PPIC report she coauthored. The scores show that English Learners and economically disadvantaged students are far behind other student groups—possibly farther behind than initially thought. As the accountability system evolves in the state, the test results are an important call to action for districts and schools struggling to help high-need students, Hill said. High-need students did well in some schools and districts, and the first-year results provide an opportunity to learn from their experiences.

College Prep for All?

Julian Betts, an economics professor at the University of California, San Diego, and PPIC adjunct fellow, examined a high school graduation requirement that makes college preparatory courses mandatory for all students. Major urban school districts—including Los Angeles, San Diego, San Francisco, and Oakland—recently implemented this requirement, making it mandatory for students to complete the a–g sequence of classes required for admission to the University of California or California State University. Based on a PPIC analysis of the San Diego Unified School Districts’ Class of 2016, Betts and his coauthors concluded that this requirement is likely to help many students but damage the prospects of others. He suggested steps that San Diego and other districts can take to help lower-achieving students meet the new graduation goals.

Learn more

Visit PPIC’s K–12 education pages
Visit the PPIC Higher Education Center

Video: Californians’ Views of K–12 Education

Despite increases in state spending on K–12 education, most Californians say state funding for their local public schools is inadequate. And most support an extension of the Proposition 30 tax increase on higher incomes, as well as state and local school bonds. These are among the key findings in PPIC’s 12th annual survey on Californians and education that were presented in Sacramento last week by Lunna Lopes, survey research associate.

Lopes said that concerns about the quality of education are at a record-low 40 percent, and less than a third of Californians say that teacher quality is a big problem. Concern about a teacher shortage is higher, with a majority calling it a big problem.

Among the other findings discussed:

  • There are partisan divisions on Common Core, but public school parents are confident that it will help students be college ready and develop critical thinking skills.
  • Few Californians have heard about Local Control Funding Formula, but when presented with a short description of the policy, most are supportive.
  • Californians see preschool as important for K–12 success and most prefer to spend some of the state budget surplus on early childhood education programs.

Why Students Found New Tests Tough

Recently the California Department of Education released the first results from the new Smarter Balanced Assessment test (SBAC), the standardized tests that were administered in spring 2015 to public school students in grades 3 through 8 and 11. As PPIC reported in a recent post, educators were not surprised to learn that proficiency rates in math and English language arts fell, relative to prior tests. However, when polled last April, a majority of public school parents (71%) had expected students to do at least as well on these new tests as they did on the state’s previous standardized tests.

There are a variety of explanations for why students did not do as well, but it is as yet impossible to untangle which, if any, is the primary driver.

  • The new Common Core State Standards (CCSS) have changed the testing landscape.The test is based on the new standards, which are intentionally more challenging. This would logically lead to lower rates of proficiency.
  • The CCSS have not been fully implemented yet. California is still fairly early in the implementation process, and administrators, teachers, parents, and students are all getting used to the new standards, curricula and materials, and teaching methods. Implementation of any new program takes time. Mike Kirst, president of the State Board of Education, has suggested that full implementation of the CCSS might be completed by 2019.
  • The SBAC test is harder. Both tests rely on multiple choice questions to gauge what students know. The new test also uses open-ended questions that require students to analyze, solve problems, and explain their answers.
  • The test is different than other tests students have taken. It is given online instead of with paper and pencil and it is adaptive rather than the same for all students. This means that if a student answers a question correctly, the next question will be a bit harder but if the student answers incorrectly, the next question will be easier. Students may not be used to using computers for testing and may be experiencing enhanced testing anxiety due to the changes in format and content. In addition, recent PPIC research indicates that not all schools and districts are at full capacity with regard to the computer technology needed to seamlessly test all students.
  • Teachers don’t know what is on the test. Scores on the state’s previous tests may have been inflated because of “teaching to the test,” which reportedly occurred frequently in the old testing regime. With its open-ended questions and adaptive approach, the SBAC test is designed to resist teaching to the test.

California is not the only state to see lower rates of proficiency on the SBAC. Other states, including Connecticut, Delaware, and Washington, have experienced the same phenomenon of lower rates of proficiency. In contrast, Kentucky has seen an increase in its proficiency rates. In some states, even if proficiency rates were low, state policymakers reported being pleased that the results were not as dire as had been expected based on field tests of the SBAC.

The CCSS and SBAC represent a way of guiding California’s K-12 system that addresses shortcomings in the previous standards and tests. Educators have learned that the standards need to encourage teachers to help students use what they learn to answer real-world questions. They also have tried to design the SBAC tests so they no longer drive instruction, but simply provide a snapshot of what students can do. The 2015 SBAC scores represent a starting place for this new regime, and the scores reflect that fact.

College Readiness and the New State Exams

Last week, California released the results of the new statewide tests aligned with the Common Core State Standards for students in grades 3-8 and grade 11. The 11th-grade test—from the Smarter Balanced Assessment Consortium (SBAC)—is designed to measure whether students are on track to be ready for college and careers after graduation. In fact, the CSU and community colleges can use scores from the test to determine if students are ready for college level courses. The results show that about half of 11th-grade students are at least conditionally ready for college level courses in English and less than a third are ready for college level math courses.

The fact that most 11th-grade students are not yet ready for college is not necessarily news for California. Since 2004, California students have been able to participate in California’s Early Assessment Program (EAP), which used an optional statewide test to determine college readiness levels of 11th-grade students. The college readiness identification component of the new tests is based on the EAP and informs 11th grade students whether they are ready, conditionally ready, or not ready for college.

We cannot directly compare the test results to see if students have improved, as the EAP was optional for all students and the math section was only offered to students in advanced math courses, meaning a large portion of students were untested by the EAP. But the two tests are similar in that they show that a majority of high school juniors are likely not ready for college in both English and math. The new test data does show that a large majority of students are now tested in English and math, meaning more students now know whether they are ready for college level work.

But there is also some good news here for California. For students, new ratings regarding college readiness come early enough for the information to help before they enroll in their 12th-grade classes. Prior research on the EAP suggests that the optional testing helped lower the likelihood that a student would need remediation. Now, because the SBAC test is mandatory, almost all students in California will know whether they are ready for college or need to make improvements during their senior year.

This year, over 90,000 more students than last year were given a rating of “conditionally ready” in English. This will give them an opportunity to avoid remediation in college, by taking a prescribed 12th-grade English class and receiving at least a C grade.

And while it might seem that informing almost 200,000 more math students that they are not ready for college would be discouraging, prior research on the EAP suggests that a “not-ready” rating did not discourage students from enrolling at a CSU. Finally, the SBAC can serve as one of multiple ways for students to demonstrate college readiness. Research suggests that using multiple measures—rather than relying solely on a placement exam—can keep students from being misdirected into remediation.

For the state, the new test provides a benchmark by which to measure future progress and a way to compare across states. Of the eight states that have released test scores, California is 4th and 5th in the proportion of students who are at least conditionally ready for English and math, respectively. As more states release their scores, California will have a clearer picture of how well it is preparing high school students for college on a national scale.

Chart notes: Data from the EAP and CDE websites. The number of students in each category of the SBAC are estimated from the total numbers tested and the percentages given by CDE.

Students Struggle on Test of New Standards

California gave its first statewide tests aligned with the Common Core standards last spring. The scores have just come out, with 40% of fourth-graders scoring proficient or better on the English Language Arts (ELA) test and 35% doing so in math. Scores for 8th and 11th grade are somewhat higher in ELA and lower in math. This new test is called the Smarter Balanced Assessment.

The share scoring proficient or higher on the new test is lower than on the old test, the California Standards Test (CST). In the final year that students were tested using CST—and on the old state standards—67% of fourth-graders scored proficient or higher. Most public school parents (71%) expected students to score at least as well on the new tests as on the old ones, according to a recent PPIC Statewide Survey. But most educators did not. Here’s why: the Common Core standards are more demanding than California’s old ones, students and teachers are in the early years of transitioning to these standards, and what it means to be proficient on the new test is different than on the old one. California is not the only state finding that the first year of Common Core testing reset perceptions of student performance.

To the right we present results for the CST and the Smarter Balanced tests, alongside California students’ scores on the National Assessment of Educational Progress (NAEP), a national ongoing assessment of what children know in a variety of subject areas. While these three test results are not directly comparable because each measures competence relative to different standards and each has its own definition of what it takes for a student to score “proficient,” it is important to have a clear sense of how our students are faring on each. The Smarter Balanced test results for each student group are higher than the NAEP, but low relative to the most recent CST.

We find gaps in proficiency for economically disadvantaged students and English Learners (ELs). Each group is specifically targeted for higher funding levels by the Local Control Funding Formula (LCFF). The CST gaps between EL and white students (61%) and between economically disadvantaged and white students (31%) are both smaller than those for the Smarter Balanced test (79% and 54%, respectively). Gaps for the NAEP are somewhat larger than in the Smarter Balanced tests. Educators will not be surprised by these findings.

California’s public school system has seen dramatic changes in recent years, and the 2014–15 Smarter Balanced test results are an important baseline to measure how these changes are affecting students. In the past, California students’ test results improved almost every year that the CST was administered. Today, both the Common Core State Standards and the LCFF aim to improve outcomes for all students and close achievement gaps. Multiple years of Smarter Balanced test results will be needed to monitor progress. These new higher standards are meant to improve outcomes well beyond secondary schooling, and the least advantaged students have the farthest to go. The new curriculum and new funding should help get them there.

Note (TOP CHART): NAEP is given to a representative sample of California students. FRPL refers to students who qualify for free or reduced price meals. Source: 2012-2013 California Standards Test, 2012-13 National Assessment of Educational Progress, and 2014-15 Smarter Balanced Assessments.
  
Note (BOTTOM CHART): We calculate the percentage gap by subtracting EL and economically disadvantaged students scores from white student scores and dividing by white students’ scores. Source: Authors’ calculations from the SBAC, NAEP, and CST.