K–12 Test Scores Vary Widely across Student Groups

The 2017 test results for California’s public K–12 school students were essentially unchanged from 2016. But behind the overall results, there were significant differences among student groups. Economically disadvantaged students—mostly those who are eligible for free or reduced price school meals—continued to score far below students not in this category. Students with disabilities and English Learner (EL) students performed at levels significantly below those of low-income students. Gaps in achievement among these groups were essentially unchanged in 2017.

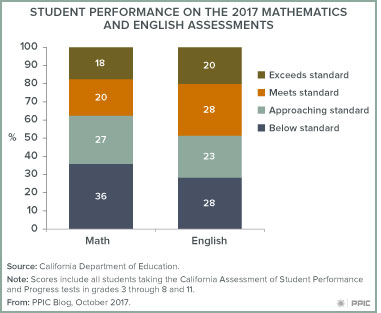
Known as the California Assessment of Student Performance and Progress (CAASPP), tests in English and mathematics are administered to virtually all K–12 students in grades 3 through 8 and in grade 11. Students take the computer-based assessments in late spring each year. The scores are reported across four performance levels. In English this year, 45% percent of students performed at the top two levels, which signal that they are working at or above the state’s standard for proficiency. About 28% of all tested students fell into the lowest performance level, “below standard.” In comparison, fewer students had mastered the mathematics skills needed to meet state standards, with 38% earning a proficient score. More than a third (36%) scored at the lowest performance level.

When we look at the proportion of students in each grade who scored at the two top performance levels on the mathematics test, we see that 47% of third graders meet the standard, while fewer students in subsequent grades meet state standards. By grade 11, only 34% are at the top two levels.


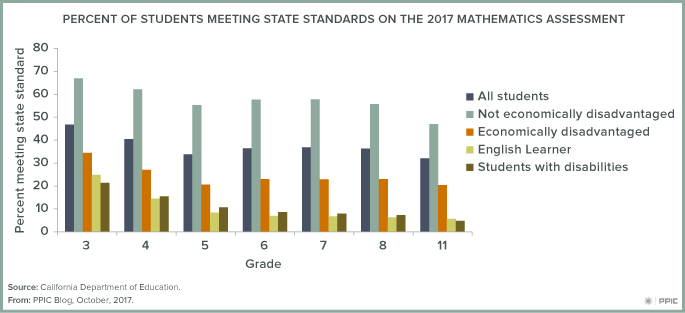
The state’s Local Control Funding Formula recognizes that family income is highly related to student success, and the test results reflect that relationship. Only 33% of economically disadvantaged students in third-grade and 20% in eleventh grade scored at proficient levels in mathematics. For students who are not economically disadvantaged, proficiency rates are more than twice as high—68% in third grade and 48% in eleventh grade. This divide is particularly important because 60% of students tested are economically disadvantaged.

Fewer than one-quarter of third grade students with disabilities or English Learners met the state’s mathematics standard. Performance is lower in the higher grades, and by grade 11 only about 5% of these groups are scoring at proficient levels. These data, however, understate the performance of these students. English Learner students who master English are reclassified as fluent, and are therefore no longer included in the EL group; the testing data show that reclassified students perform at higher levels than native English speakers. Also, newly arrived EL students in grades 3 through 11 tend to lower average EL test scores. These dynamics result in the data showing persistently low EL proficiency rates. A similar dynamic affects special education scores.

The new test scores reemphasize the need to boost outcomes for California’s low-income students. Students who are not considered low-income perform pretty well, yet even this group’s mathematics achievement lags in the higher grades. The data also underscore the need for better information on English Learners and students with disabilities. It is likely that the progress of these students is better than suggested by these scores. The state should consider using the individual student data to develop more accurate measures of progress for EL students and other groups.

Can Mandatory College Entrance Exams Boost College Access?


This post is part of an occasional series examining how California can learn from policies in other states.

California ranks 47th out of the 50 states in the proportion of recent high school graduates that attend a four-year college. There are big recognizable barriers to attending a four-year college, such as cost. However, there are also smaller barriers—like taking a college entrance exam such as the SAT or ACT—that can keep students from even being eligible for entry to a four-year college.

Policy: Mandatory College Entrance Testing in High School

Several states have recently instituted statewide college entrance exams for high school students through allowances in the federal Every Student Succeeds Act (ESSA), which mandates that states test their students for accountability purposes. The ESSA allows states to use college entrance tests as their high school tests. Students in states that use college entrance exams have one less hurdle to college eligibility, as well as experience taking the test and a signal of their level of college readiness. These benefits could help students make their way to a four-year college. Does the policy work?

Policy Impact

Because many states are only recently requiring a college entrance exam, there has not been enough time to analyze long-term trends. However, a 2015 study by Daniel Klasik evaluates the college-going behavior of students in three states (Illinois, Colorado, and Maine) that have long required all students to take national college entrance exams in high school. The study shows that statewide college enrollment may not necessarily increase, but students may have enrolled in different types of institutions than they otherwise would have. In Illinois and Maine the entrance exam policy was associated with a shift in enrollment away from public two-year colleges, which generally don’t require entrance exams; Illinois saw increases in four-year college attendance. Students in Maine and Colorado were more likely to enroll in institutions that required entrance exams for admission. All three states saw a positive impact on attendance at private four-year colleges.

Lessons for California

California currently uses the Smarter Balanced Assessment Consortium (SBAC) tests, which students take in grades 3-8 and 11. Of the fifteen states in SBAC, six use a college exam for federal accountability for their high schools and another three states require (and pay for) all students to take a college exam in addition to their normal state test.

The trend is catching on in California. Right now only 60% of students take the SAT, but several California districts are offering the test free to all students. In fact, Long Beach Unified School District recently asked the state if it could replace the SBAC test with the SAT, citing similar schoolwide accountability scores and the additional college-going benefits. The state declined, citing concerns about alignment with the Common Core State Standards, the ability of the SAT to accurately assess lower-performing students, and accommodations for students with limited English proficiency or learning disabilities.

But mandatory college entrance exams could remove a barrier to college entry for California students. As we have examined in prior research, the SBAC tests already link high school testing to college readiness at the California State University (CSU) and some community colleges through the Early Assessment Program. However, the University of California and many private schools still require a college entrance exam score. And while CSU does not require an entrance exam for all students, it does require an ACT or SAT score for students with GPA that is below 3.0 and for those applying to some impacted campuses or majors.

A statewide entrance exam program may not solve all of California’s enrollment issues—in part because California’s master plan limits entry to public universities and many campuses are not currently able to accept all qualified applicants. California could still benefit if the policy increases enrollment at four-year private schools, as students starting at four-year institutions are generally more likely to obtain a bachelor’s degree than those who start at a community college. In a state that is facing a 1.1 million degree gap by 2030, removing barriers to college entry is an important step toward producing more college graduates.

Comparing College Readiness across States

How does California compare to other states in preparing students for college? This isn’t necessarily a straightforward question to answer, because most cross-state metrics, such as Advanced Placement or SAT performance, only capture the subset of students who are thinking seriously about college. However, California’s new 11th-grade assessments are aligned to college-readiness standards and administered in many other states—allowing us see how California compares to other states in preparing all students for college.

These new Smarter Balanced Assessment Consortium (SBAC) tests are aligned with the Common Core curriculum standards. The 2015–16 school year was the second year of statewide administration of these tests for students in grades 3–8 and grade 11 in California.

A high enough score on the 11th-grade test is an early guarantee that students can take college-level courses, rather than remedial courses, upon enrolling at any California State University (CSU) and most community colleges in the state. As part of California’s Early Assessment Program, students who score in the highest level (“standard exceeded”) in English language arts (ELA) or math are exempt from remediation at participating colleges. Students who score in the second highest level (“standard met”) are considered conditionally ready for college coursework and may become exempt from remediation upon successfully completing a specified course in the 12th grade. Ten other states also participate in the exam, and while the test scores don’t affect college remediation for all colleges in every state, over 200 colleges across most of the states accept the scores.

In California, 13% of 11th graders were ready for college courses in math and 20% were conditionally ready. In English, 26% were ready and an additional 33% were conditionally ready. California ranks about in the middle of all other states taking the exams, a surprising result considering previous standardized tests such as the National Assessment of Educational Progress have consistently placed California students as among the lowest-performing in the nation. Moreover, of the states using the exams, California has the largest share of students in the federal free or reduced-lunch program (a proxy for low-income status) and by far the largest share of English Learners. Students from both groups are about half as likely to be prepared for college compared with their peers. In other words, the California scores are perhaps more impressive in light of the barriers to college readiness that more California students face.


Does this mean that California is doing a good job preparing students for college? This 11th-grade test is meant to be an early signal to students of their college readiness. Students also have their senior year to prepare for college, and the readiness levels of 59% in English and 33% in math will likely improve by the end of 12th grade. However, for students who do go to college, remediation rates are still high at CSU (40%) and community colleges (80%), and haven’t changed much since the new assessments began. These results and cross-state comparisons show us that California has room for improvement and may face more challenges than other states moving forward.

Learn more
Visit the PPIC Higher Education Center