How Are School Districts Spending Their LCFF Dollars?

Since the enactment of the Local Control Funding Formula (LCFF) in 2013–14, funding for K–12 education has risen to record highs. Much of the increase is due to the improved state economy, which has seen nearly a decade of continuous growth and led to dramatic expansions in the state budget. Even so, the LCFF has significantly altered the funding landscape, with the intention of providing more resources to the districts, schools, and students who need them most. Six years in, what can we say about how this system is faring?

Under the LCFF, districts with more high-need students (those who are low income, English Learners, homeless, or foster youth) have seen larger funding increases. Between 2013–14 and 2017–18, high-need districts (those with student populations that are at least 55% high need) increased student spending more than $500 more per-pupil than did lower-need districts (where fewer than 30% of students are high need). Districts with especially large shares of high-need students (80% or 90%) saw an even greater funding increase under the new funding formula.

Are higher-need districts spending differently than lower-need districts? We can address this question by comparing the changes in spending between 2012–13—the year prior to LCFF’s enactment—and 2017–18, the most recent year for which K–12 financial data is available.

The data reveal two patterns of note. First, despite greater total increases, spending on teacher salaries actually grew more in lowest-need than in the highest-need districts: $570 per student in the lowest-need districts (where fewer than 30% of students are high need) vs $495 in the highest-need districts (where more than 80% of students are high need). Higher-need districts hired more teachers and saw greater reductions in teacher-pupil teacher ratios. However, a greater reliance on novice teachers (whose salaries are lower) reduced the overall spending increase among these districts. Benefits spending also increased by much more in higher-need districts, mainly due to the greater increases in staffing levels.

Second, higher-need districts have been spending more on support staff and other non-teaching staff. They have also spent more on services, materials, and other student spending (excluding capital outlay, debt service, pre-K, and adult education): these expenditures increased by $822 per student in the highest need districts, as opposed to $336 in the lowest need districts. Higher-need districts are most likely attempting to address the additional challenges that higher-need students face outside the classroom. The hope is that these additional services and support staff will translate into improvements in academic performance that will narrow achievement gaps. Research on similar reforms in other states suggests that this approach will eventually pay off.
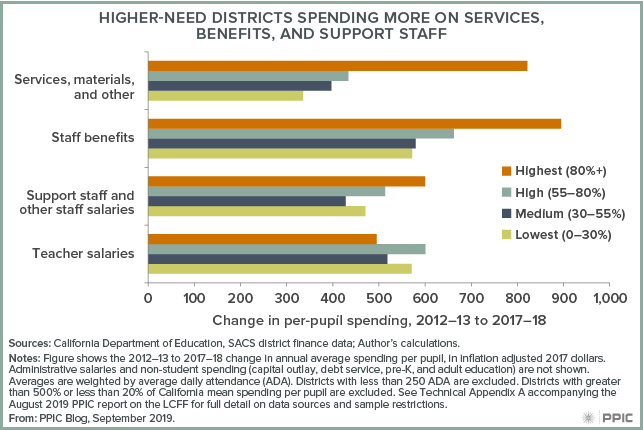
figure - Higher-need Districts Spending More on Services, Benefits, and Support Staff

Currently, however, concerns are growing about whether additional funding is reaching the highest-need students within districts. Because districts are not required to report their school-level spending publicly, it is difficult to assess how this funding is allocated within a district. However, public staff records and salary schedules do allow us to examine differences in teacher spending across schools in the same district. Such comparisons show that districts tend to spend more on their highest-need schools but that the difference is modest.

Fortunately, federal requirements will soon make more comprehensive school-level spending data available. While we don’t yet know how accurate and comparable it will be, this data will bring new and much-needed transparency to our K–12 finance system.

The Russian River: Managing at the Watershed Level

This is part of a series on issues facing California’s rivers.

Water managers across the state face new and more extreme challenges as the climate warms—from balancing the sometimes conflicting needs of urban, agricultural, and environmental water users to reducing risks from fires, floods, and droughts. We talked to Grant Davis, general manager of the Sonoma County Water Agency, about how his agency is approaching these challenges comprehensively, at the scale of the entire watershed.

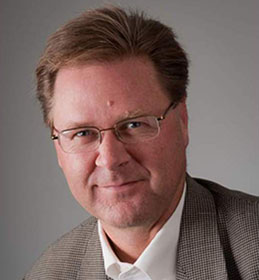
photo - Grant Davis

PPIC: In your experience, what does it mean to manage at the watershed level?

Grant Davis: At its core, managing the Russian River watershed requires careful consideration of different land uses, stakeholders, water demands, environmental regulations, and ecosystem needs. We have to balance the competing needs of our 600,000 customers, a number of endangered species, recreational users, and a thriving farm community. In practice, we’ve changed our management considerably over the years. For example, we now intentionally release water from our two major reservoirs to improve estuary and fisheries management, while still meeting water supply needs.

In 2008, we began implementing what is known as a “biological opinion” designed to protect three endangered species—coho, Chinook and steelhead. An important element is restoring habitat on Dry Creek, a major tributary below our major drinking water reservoir. The idea is to slow water released from the reservoir to provide refuge for the fish. In the short run, it will likely make water deliveries harder, but it’s key to operating our system sustainably long term. When complete, we’ll have 6 miles of restored habitat out of a 14-mile stretch. It’s a multi-million-dollar effort—and a major undertaking in cooperation. Our agency has worked very closely with the regulating agencies and private landowners, who granted easements that enabled this restoration to occur.

PPIC: How do you use data sources to help you manage this watershed?

GD: We’re establishing information networks that bring multiple benefits. For example, we’re collaborating with the US Geological Survey on an integrated rainfall and stream gage network, which can help us evaluate whether storms might cause flash floods after fires. The rainfall data also helps with ecosystem management. In a changing climate, rainfall data is the primary input for understanding our watershed.

Since the Tubbs fire, we’ve begun working with more parties to leverage our respective data needs. For example, working with emergency responders, we’ve established a network of fire cameras that inform a text alert system. And working with PG&E, we’re looking at installing equipment to forecast atmospheric rivers and fire weather at the same weather stations.

It’s also critical that we use science to better understand atmospheric rivers, which will in turn allow us to better manage reservoirs as the climate warms. These large storms contribute to most flooding in California, and up to 95% of floods in our watershed. And the lack of atmospheric rivers leads to drought. We’re now working with the US Army Corps of Engineers, NOAA (the National Oceanic and Atmospheric Administration), the Scripps Institute of Oceanography, the Department of Water Resources, and other colleagues to study this phenomenon. Together, we’re developing a joint project that uses improved forecasting of atmospheric rivers to better manage water releases from reservoirs. We’ve built a coalition with other water agencies—including those in Orange County, Turlock, and Yuba—that are interested in exploring these same issues in their rivers. Data from the project will help us improve how we manage water supply, floods, and the environment.

PPIC: Talk about how the interaction between surface water and groundwater has affected Russian River water management.

GD: Our watershed is ground zero for efforts to understand the links between groundwater and surface water, and to better manage both together. In 2014, Mark West Creek was selected as one of five priority creeks as part of the California Water Action Plan. The creek goes through a depleted groundwater basin, which has affected its flows. The Department of Fish and Wildlife is now developing recommended flow levels to protect and restore the creek’s critical habitat. The project will also quantify human needs within the watershed.

In places like Mark West Creek, groundwater recharge can play a critical role in addressing the “timing divide” for maintaining freshwater fisheries—because the question is not always whether water is available, but when it’s available. A pilot project in the town of Sonoma will use Russian River surface water in wet winters to recharge the aquifer. We can then pump it when it’s needed in dry summer months for critical uses.

Thanks to Jay Jasperse and Carlos Diaz, both of the Sonoma County Water Agency, for their contributions to this article.

Most Californians Favor Requiring Vaccinations

The United States is currently experiencing its worst measles outbreak in more than 20 years, with more than 1,234 people diagnosed with the disease this year—including 67 cases in California. One of the year’s most contentious bills, Senate Bill (SB) 276 addresses this issue by establishing stronger standardization and oversight of medical exemptions from vaccines. (In 2015, California was the first state to repeal religious and personal belief exemptions.) Approved by the assembly and senate and awaiting the governor’s signature, the bill has attracted numerous protests in Sacramento. With public health concerns on one hand and parental choice on the other, how do Californians view vaccinations?

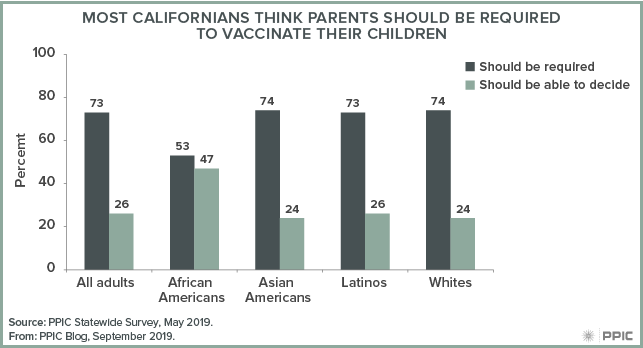
In PPIC’s May Statewide Survey, an overwhelming majority of Californians (73%) said parents should be required to vaccinate their children for diseases like measles, mumps, and rubella. This view is held by at least seven in ten across genders, political parties, and those with and without children in the household. Majorities across demographic groups and regions say vaccinations should be required, as do about three in four Asian Americans, whites, and Latinos—compared to 53 percent of African Americans.

figure - Most Californians Think Parents Should Be Required To Vaccinate Their Children

Vaccine safety has been an ongoing matter of concern, despite assurances from the scientific community. Today, nearly all Californians say that the vaccines given to children are safe (62% very, 27% somewhat). The share that say vaccines are very safe is held by strong majorities across parties, as well as majorities across regions and demographic groups. Notably, among Californians who say parents should be able to decide whether or not to vaccinate their children, 73% say vaccines are safe.

At the same time, eight in ten residents are concerned that measles outbreaks will become more widespread (43% very, 36% somewhat). This view is held by majorities of Californians, although the share who say they are very concerned is higher among older Californians than younger Californians (48% to 34%) and among women than men (48% to 38%).

Even as most Californians support vaccination requirements—and worry about public heath—the discussion around SB 276 remains volatile. PPIC will continue to monitor public opinion as this important issue unfolds.

Predicting California’s Economic Health

After a record expansion, recent signs suggest the nation’s economy may be softening. Unusual patterns in the bond market, signs of slower growth overseas, and the uncertainty of the ongoing trade conflict with China have all raised fears that a downturn may be on the horizon. Yet it is still unclear whether the country is actually headed for a recession. Moreover, all these signs focus on the United States as a whole (or even the whole world). It would be helpful to have more signs for the California economy in particular.

The PPIC Statewide Survey can offer one such sign. The survey has amassed an enormous amount of data on Californians’ views of the economy. For more than 20 years, it has asked survey participants whether they think California will have good or bad economic times in the next 12 months. This question was adapted from the University of Michigan Index of Consumer Sentiment and has been asked of everyone: rich and poor, politically engaged and disaffected, citizen and non-citizen.

Given the broad scope of the survey, in the aggregate these respondents may be good at predicting the direction of the economy. They see what everyone else sees on the news, but they can also report on their own private circumstances and those of close friends and relatives. This might pick up on information that has not yet emerged in official statistics. Indeed, when we look at survey responses alongside recent recessions, an interesting pattern emerges.

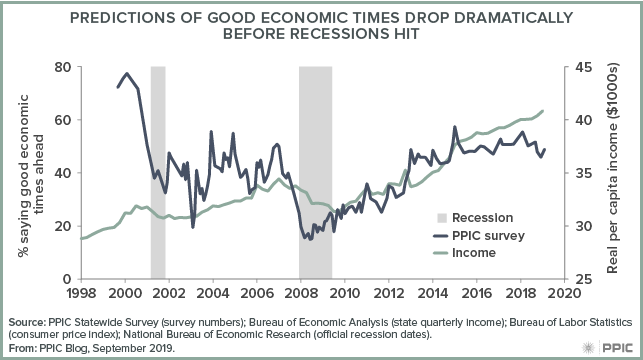
The figure below shows the share of survey respondents who have predicted good economic times for California, and plots it against the state’s per capita income and the periods officially labeled recessions. PPIC respondents appear to have anticipated the last two downturns. The share expecting a good economy plunged a few months in advance of each recession and a slide in state incomes. The drop happened a couple months before the 2001 recession, but as much as nine months before the Great Recession.

figure - Predictions of Good Economic Times Drop Dramatically Before Recession Hit

What do the numbers tell us today? The last few surveys have seen a slight drop in the share expecting good times, but the shift hasn’t yet matched the magnitude seen before the last two recessions. At this point the trend is ambiguous, but well worth watching. It can supplement other California-specific information such as the State Fiscal Health Index from the Legislative Analyst’s Office, but a few months earlier. A sharp and sustained drop in Californians’ optimism about the economy may signal dark storm clouds on the horizon.