The Rise and Fall of Enrollment at For-Profit Colleges

Increased demand for postsecondary education in California has contributed to dramatic growth in enrollment at for-profit colleges. But in recent years, this trend has begun to reverse. Many students who saw for-profit colleges as a viable alternative to public and private nonprofit institutions are in debt and without a degree, and some for-profit colleges are now the focus of state and national investigations, lawsuits, and sanctions.

California is home to almost 400 private, for-profit postsecondary institutions that are eligible to participate in federal financial aid programs. These colleges vary widely in size and mission, from small independent vocational schools enrolling only a few dozen students to large national chains that enroll thousands and offer graduate as well as bachelor’s degrees. Altogether, for-profit colleges make up more than half of all postsecondary institutions in the state and enroll one in eight postsecondary students.
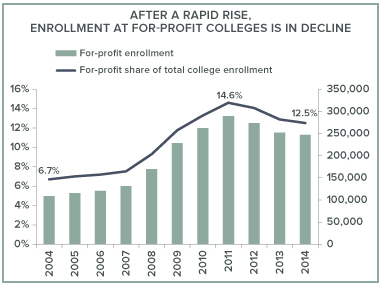
Enrollment at for-profit colleges in California almost tripled between 2004 and 2011, growing from 109,000 students to 289,000 students (as measured by full-time equivalent enrollment). Over the same period, enrollment in other colleges changed very little (increasing only 12%). By 2011, one in seven college students attended a for-profit institution. For-profit colleges enrolled more students than the University of California system and all private nonprofit colleges in the state.

But since 2011, enrollment in for-profit colleges has declined by more than 40,000 students, a 15% drop. Every sector of for-profit colleges experienced declines, with the sharpest reduction (29%) occurring among two-year institutions. Meanwhile, public and private nonprofit colleges saw slight enrollment increases during this same time frame.

What accounts for the rise and fall of enrollment at for-profit colleges?

Certainly, students were attracted to the easy access and convenient course times that for-profit colleges offered—something that other colleges can and have been learning from. But investigators have also found that a number of for-profit colleges engaged in predatory marketing practices, targeting vulnerable students and making false promises about job placement. Such practices may have helped enrollment growth at first, but as these practices became more well-known, and as regulatory and legal actions became more widespread, enrollment began to decline.

The decline also coincides with restrictions on institutional eligibility for the state’s large financial aid program, Cal Grants. In 2011, institutions with a high share of students receiving federal loans were required for the first time to meet minimum standards for graduation rates and loan default rates for their students to remain eligible for Cal Grants. In 2014, only 40 of the 383 for-profit colleges in California met these standards and remained eligible for Cal Grants. Enrollment declines were smaller (9%) at the for-profit colleges that retained Cal Grant eligibility. (Students at colleges that do not meet the minimum standards for Cal Grant eligibility can still receive federal financial aid.)

The future of for-profit colleges is uncertain. In the near term, enrollment losses are likely to continue. Though not yet available, 2015 enrollment data will show further declines due to the closing of Corinthian Colleges, the parent company for Heald, Everest, and WyoTech colleges, in California. Those institutions enrolled over 15,000 students in fall 2014.

Meanwhile, the US Department of Education has taken aim at the Accrediting Council for Independent Colleges and Schools (ACISC), the largest accrediting agency of for-profit colleges in the nation. Continued actions such as this one could eventually lead to a loss of accreditation and hence federal funds for hundreds of for-profit institutions nationwide. Without federal funding, many for-profit colleges would be unable to operate, leading to further enrollment declines.

Chart source: Integrated Postsecondary Education Data System (IPEDS), fall full-time equivalent enrollment in California.

Learn more

Visit the PPIC Higher Education Center

Community Colleges and Career Technical Education

The governor’s January budget proposal allocates increased funding to support the Strong Workforce Program, which will enable California’s community college system to expand access to career technical education (CTE), commonly referred to as vocational education.

This proposal comes at a time of renewed attention to CTE. The federal 2014 Workforce Innovation and Opportunity Act focuses in part on improving community colleges’ engagement in workforce training. In California, in addition to the investment proposed by the governor, the California Career Pathways Trust—a pilot program created by 2014 legislation—aims to ensure the development and strengthening of career pathway training programs.

California’s community colleges have always played a key role in providing CTE training opportunities. While CTE training can start as early as high school, CTE at the community colleges provides a closer tie to workforce opportunities—to meet both student and employer needs. For-profit colleges, which offer a number of CTE programs, are under increased scrutiny due to poor graduation rates, mounting student debt, and questions about the value of their degrees—putting even more focus on the state’s public two-year colleges to provide training opportunities in high-demand programs.

Training programs in the health care field are a prime example. The health care sector in California is large and growing, providing essential services to the state’s population as well as employment opportunities to a wide variety of workers. And according to our recent report, nearly 200,000 new health care jobs over the next decade will require some college training but not a bachelor’s degree. Given the state’s interest in serving employment needs and diversifying the health care workforce, it is crucially important to understand the ability of California’s community colleges to effectively train health workers for needed jobs.

Beyond meeting the state’s workforce needs, career technical education also has the potential to substantively improve labor market outcomes for a wide range of students. Research has identified sizable labor market returns to obtaining a career technical credential, and the California Community College Chancellor’s Office makes this information publicly available through its Salary Surfer web tool. But much remains unknown, especially why economic returns vary across programs and student groups and why more students do not complete a credential at all. To ensure recent state and federal investments—and future reforms—are effective, it is important to fill the knowledge gaps on the student, institutional, and policy choices that lead to optimal outcomes.

Perhaps more importantly, if vocational training is to be a viable mechanism for improving economic mobility, especially for disadvantaged groups, we need a better understanding of the most promising pathways. Upcoming PPIC research will examine this very issue, looking at student success at California’s community colleges across health CTE programs and student demographic groups to provide a clearer picture of effective career technical education.

What the New College Scorecard Can—and Can’t—Tell You

Last month, as high school seniors were beginning to apply for college, the US Department of Education released its yearly scorecard to help students and their parents make informed choices. In addition to information on graduation rates, access, net price, this year’s scorecard includes earnings data for former students. The earnings profiles will be especially helpful—until now, students, parents, and the public lacked access to official information about earnings nationwide. They may also help hold colleges accountable for student outcomes.

The new earnings data is exciting—but not perfect—so it is important to determine what it actually tells us. The US Department of Education—which administers financial aid, mostly in the form of Pell Grants and federal student loans—generates the earnings profiles by linking its data on college students who get federal aid with earnings data from the US Department of the Treasury. This covers about 70 percent of students nationwide. Of course, the shares of students receiving federal aid vary across colleges—at some postsecondary institutions, fewer than half receive it. But the scorecard’s explanation of its methodology suggests that, aside from family income, college students who receive federal aid are similar to those who do not.

Another caveat is that the earnings measure for each institution represents all students receiving federal aid who started there—including those who didn’t graduate and those who transferred to other schools or pursued post-graduate degrees.

Still, it is instructive to compare the earnings of former students across institutional sectors. The table shows what you would see if you looked up earnings profiles for different types of California colleges. We chose colleges with median earnings that were closest to the median of each sector.

The median student who started at UC Davis earns about $8,000 more than a student from Azusa Pacific University, about $10,000 more than a student from Sacramento State. The differences among the sectors align with what we know from prior research: earnings of former students of colleges that grant bachelor’s degrees are, on average, higher than those of former students of colleges that grant only associate degrees or certificates. Moreover, research has found that students at private for-profit institutions end up with lower earnings than those of comparable students from public or private non-profit four-year universities.

What the scorecards don’t show is that the difference between colleges is far smaller than the difference within colleges. The figure shows the variation in earnings at the same campuses included in the table above. First, note the tremendous overlap: many students who start at community college end up earning more than some students who started at UC and CSU. The difference in median earnings between the typical CSU and the typical UC is approximately $10,000. But the difference between the 25th percentiles and the 75th percentile of UC Davis student earnings is almost $50,000.

Looking at these differences alone is not enough to judge the quality of an institution. The differences that we observe across colleges might reflect differences in the type of students who enroll in different institutions, or variations in completion rates. They may also have to do with differences in the fields of study that attract large numbers of students. For example, some colleges have high concentrations of students enrolled in STEM (science, technology, engineering, and math) fields—these students traditionally go into higher-paying jobs. Other colleges may have a high concentration in less remunerative majors. Similarly, the dispersion that we observe in student earnings within institutions is likely tied to a number of factors, including fields of study and rates of completion.

PPIC research has found that a worker’s wages vary tremendously depending on his or her college major. At the high end, those with engineering degrees earn a median annual wage of $96,000. At the low end, those with degrees in education administration and teaching have a median annual wage of $57,000. The Department of Education plans to include earnings by area of study in future versions of the scorecard, and we think this will make the scorecards much more valuable to students and families.

Californians will find the federal scorecard particularly useful, since the state currently lacks a student tracking system. Many other states have maintained more robust and inclusive student tracking systems for years. These systems allow calculation of more precise earnings information by major and degree for all graduates in a state—and some states are collaborating to track outcomes and earnings of former students who move from one state to another.

In California, only the community college system provides salary information for its graduates. At a time when state and national leaders are urging that colleges and universities be held accountable, the state’s parents, students, and taxpayers would benefit from more and better information about student outcomes.

Testimony: Low-Income Students and Financial Aid

As the legislature considers a number of bills aimed at increasing access and affordability of public higher education, the state assembly’s subcommittee on education finance invited PPIC to testify this week. The focus was the unmet financial aid needs of low-income college students. Hans Johnson, PPIC senior and Bren Fellow, presented data from the recent PPIC report Making College Possible for Low-Income Students: Grant and Scholarship Aid in California, which details the importance of federal and state grant aid in ensuring that higher education remains a ladder of economic opportunity for all Californians.

Johnson noted that as the state has cut funding for the University of California (UC) and California State University (CSU), tuition has increased and grant aid has become increasingly important to help students afford college. Research has also shown that grants and scholarships help students persist in their education and enables students to focus on their coursework and complete college faster. UC and CSU remain less expensive options for low-income students in terms of “net price”—the cost of attending college after accounting for federal, state, and institutional aid—than non-profit and for-profit private colleges. However, students whose family incomes are $30,000 or less still pay nearly a quarter of their incomes, or $8,000 per year, to attend a public four-year college.

Improving college access and completion is vital to California’s economic well-being, and aid for students has become increasingly necessary. The legislature’s attention to this issue comes at a time when 60% of California high school students qualify for free and reduced price lunch and three-quarters of California’s low-income college freshmen are enrolled in a UC or CSU.