2020 Census: Counting Imperial County

The decennial census plays an essential role in American democracy. Our series of blog posts examines what’s at stake for California and the challenges facing the 2020 Census, including communities that are at risk of being undercounted.  

PPIC’s interactive census maps are an important tool for Californians working to ensure an accurate census count. Using estimates from the Census Bureau and the Federal Communications Commission, they highlight hard-to-count communities across the state and pinpoint reasons why certain areas may be hard to reach.

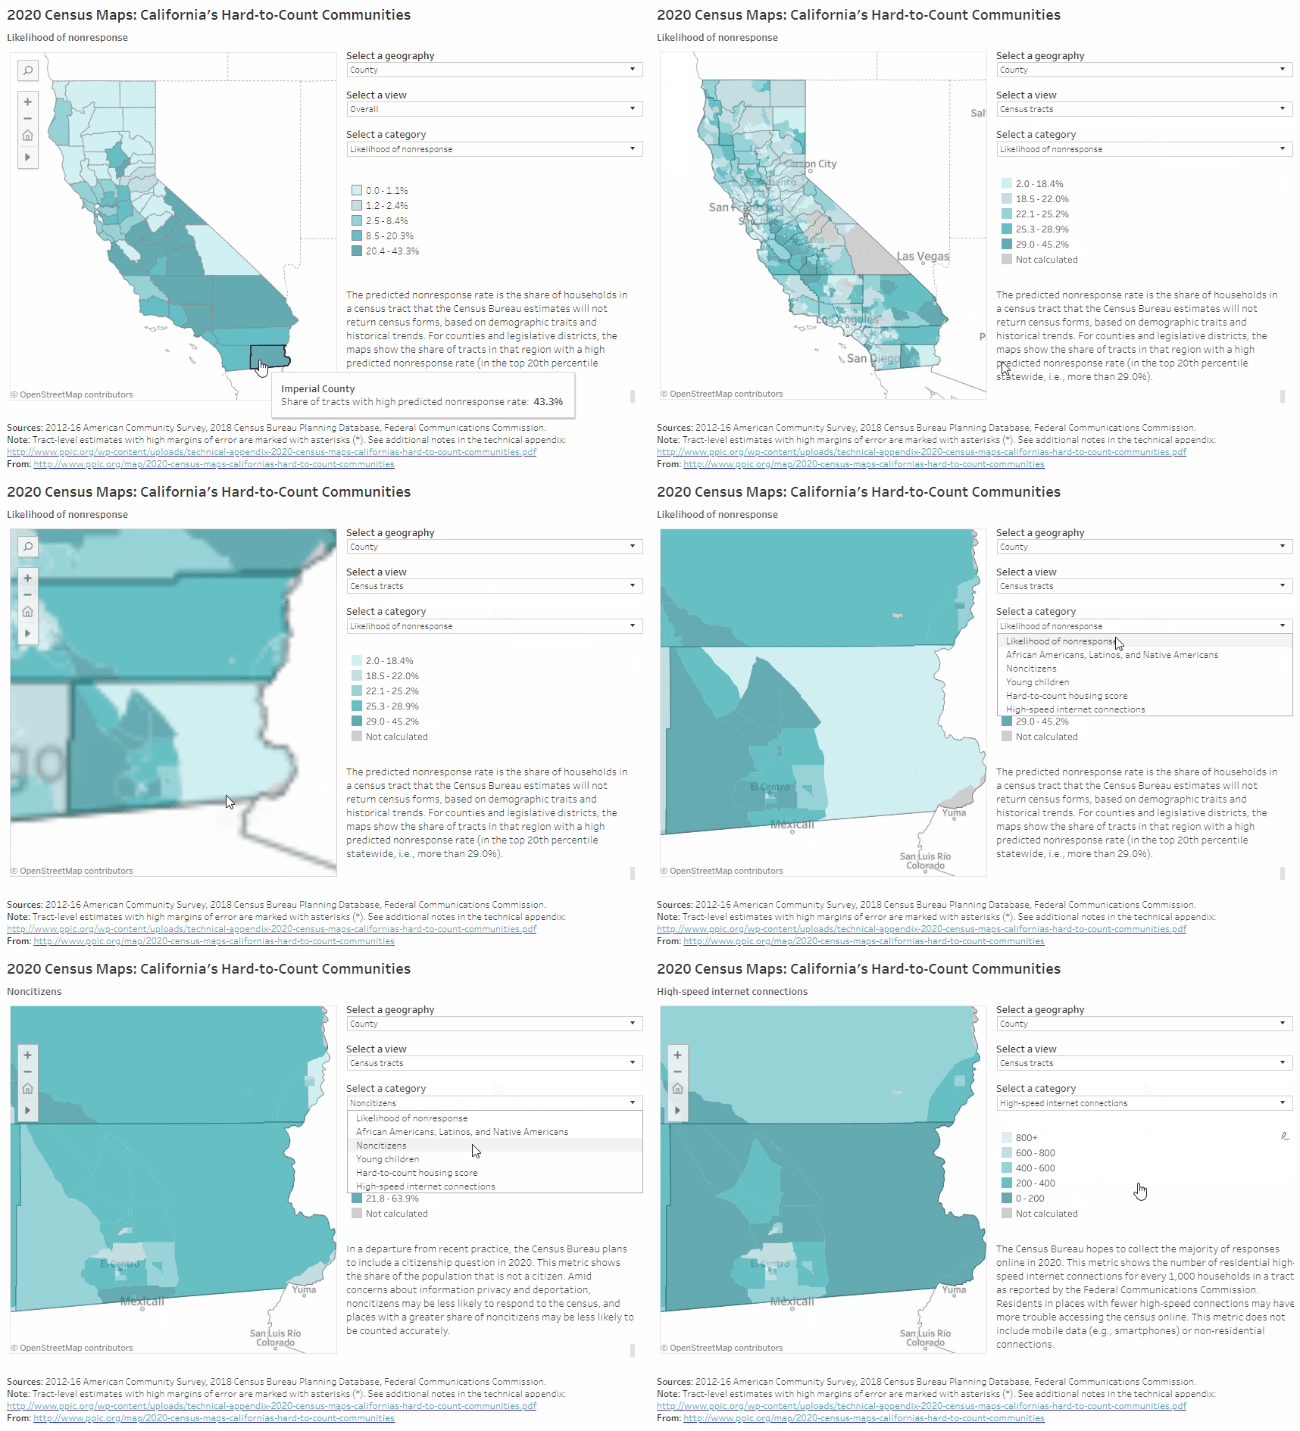
Home to nearly 200,000 people, Imperial County will likely be one of the hardest-to-count counties in California. According to Census Bureau estimates that draw on demographic characteristics (e.g., race/ethnicity, age, citizenship, and housing conditions) and historical trends, 43% of census tracts in the county will be very hard to count—the highest percentage of any county in the state. Households in these very hard-to-count areas—which are concentrated in the western half of the county, around the Salton Sea and El Centro—are the least likely to respond initially to census forms and are therefore at risk of being undercounted.
Some highlights:

  • Legislative districts representing Imperial County are among the hardest to count in California. Between 33% and 52% of census tracts are considered very hard to count in Congressional District 51 (Vargas), State Senate District 40 (Hueso), and State Assembly District 56 (Garcia). Undercounting residents of these districts could result in political representation shifting away from Imperial County and toward areas with higher population counts, since district lines will be redrawn based on the results of the 2020 Census.
  • Almost all residents belong to demographic groups that have been historically undercounted. In the past, the census has disproportionately undercounted African Americans, Latinos, and Native Americans, as well as young children. The large majority of Imperial County’s population is Latino—with higher shares of Latinos in the western half of the county—and the Fort Yuma Indian Reservation is located in the southeast. Altogether, 86% of county residents are African American, Latino, or Native American (compared to 45% statewide). Noncitizens—who may be less likely to respond in 2020 due to the planned addition of a citizenship question and concerns about deportation and privacy—make up 17% of residents in this border county (compared to 14% statewide).
  • Imperial County has a high share of young children, particularly in its cities and towns. Children under five years old make up 8% of Imperial County residents, compared with 6.5% statewide. Most young children live in the Imperial Valley, along the corridor from the Salton Sea to Calexico, or outside Yuma, Arizona. In the more rural areas to the east and west, less than 3% of county residents are children under five.
  • Housing conditions could make it difficult to accurately count residents. Compared to the rest of the state, Imperial County has relatively high shares of renters (44%), overcrowded rental units (15%), and mobile homes (8%), all of which can make residents harder to count. Reaching residents at home will require strategies that vary by geography and reflect local understanding of how families make ends meet. In the eastern part of the county, for example, almost 60% of housing units are mobile homes, and about 20% are rentals, while in and around El Centro and Calexico less than 20% of units are mobile homes but more than 60% are rentals.
  • Much of the county lacks high-speed residential internet access. The Census Bureau plans to collect the majority of responses online in 2020—a change from previous practice. Imperial County has one of the lowest rates of internet access in the state: with the exception of only one neighborhood in El Centro, fewer than 800 households per thousand in the county have high-speed internet connections. In places with limited residential internet access, census participation may rely more heavily on paper forms, in-person census takers, or internet provided by local institutions.

We hope these maps serve as a starting point to help local, regional, and state leaders think about which activities, resources, and partnerships—including language assistance, awareness raising, and community outreach—might be most effective for accurately counting different parts of California. While this concludes our regional series on hard-to-count communities throughout the state, stay tuned for future posts on the decennial census as we near 2020.

Reducing Drought Risks in Rural Communities

Disadvantaged rural communities are disproportionately exposed to drinking water risks in California. Too many experience insecure supplies and contamination of their water sources. While there are growing efforts by policymakers to address water contamination, many communities will need further help to prepare for future droughts. Improved planning efforts could help avert water shortages.

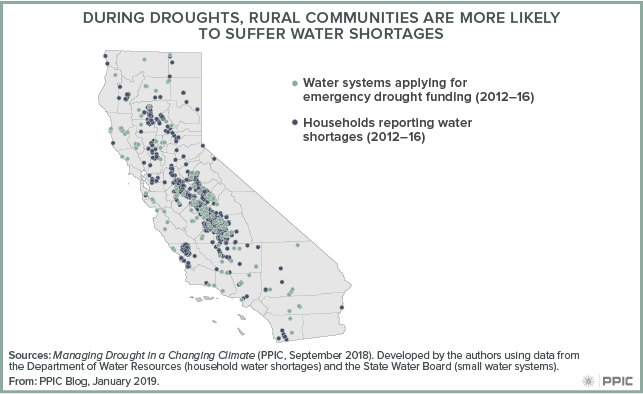
Rural residents are more vulnerable to running out of water during droughts because they are more likely to rely solely on groundwater from small community wells or domestic wells. These wells tend to be relatively shallow, so they are susceptible to running dry when pumping lowers groundwater levels. During the 2012‒16 drought, farmers and cities pumped extra groundwater to make up for surface water shortages. Thousands of wells went dry―mostly domestic drinking water wells in rural communities, especially in the San Joaquin Valley. And roughly 150 small community water systems sought emergency assistance to keep the taps flowing.

Although the state’s Sustainable Groundwater Management Act (SGMA) is expected to lead to balanced groundwater use and reduce over-pumping in the long term, California’s highly variable climate means that groundwater levels will still drop during droughts. This could result in more drinking water wells going dry. In a recent submission to the California Water Data Challenge, several colleagues from UC Davis and I found that a drought similar to the latest one could cause more than 4,000 domestic wells to go dry in the Central Valley.

A recent PPIC report on managing drought in a changing climate offers two ideas for reducing these risks:

  • Develop drinking water plans for rural communities and identify durable funding sources. Small rural systems do not have the financial capacity for drought planning and mitigation. State and local partners should use their experience from the recent drought to identify communities at highest risk, connect them to larger systems where feasible, and devise drought response programs for the others with reliable funding sources. The newly formed groundwater sustainability agencies, working with local partners such as counties and agricultural and urban dischargers, could help coordinate actions and streamline funding mechanisms.
  • Ensure groundwater sustainability plans include mitigation actions for dry drinking wells. Sustainability plans should describe preparation for groundwater drawdowns during severe drought similar to the one in 2012‒16. For instance, as groundwater sustainability agencies develop their plans, mapping drinking water wells that might be at risk for different drought scenarios and proposing mitigation actions that proactively decrease the risks are both imperative.

Studies of institutional responses to the latest drought largely find that planning for drought response and recovery paid off. Making an action plan to avoid further water-supply risks in disadvantaged rural communities―as well as identifying reliable funding mechanisms to implement it―should be top priorities for California policymakers.

2020 Census: Counting Orange and San Diego Counties

The decennial census plays an essential role in American democracy. Our series of blog posts examines what’s at stake for California and the challenges facing the 2020 Census, including communities that are at risk of being undercounted.  

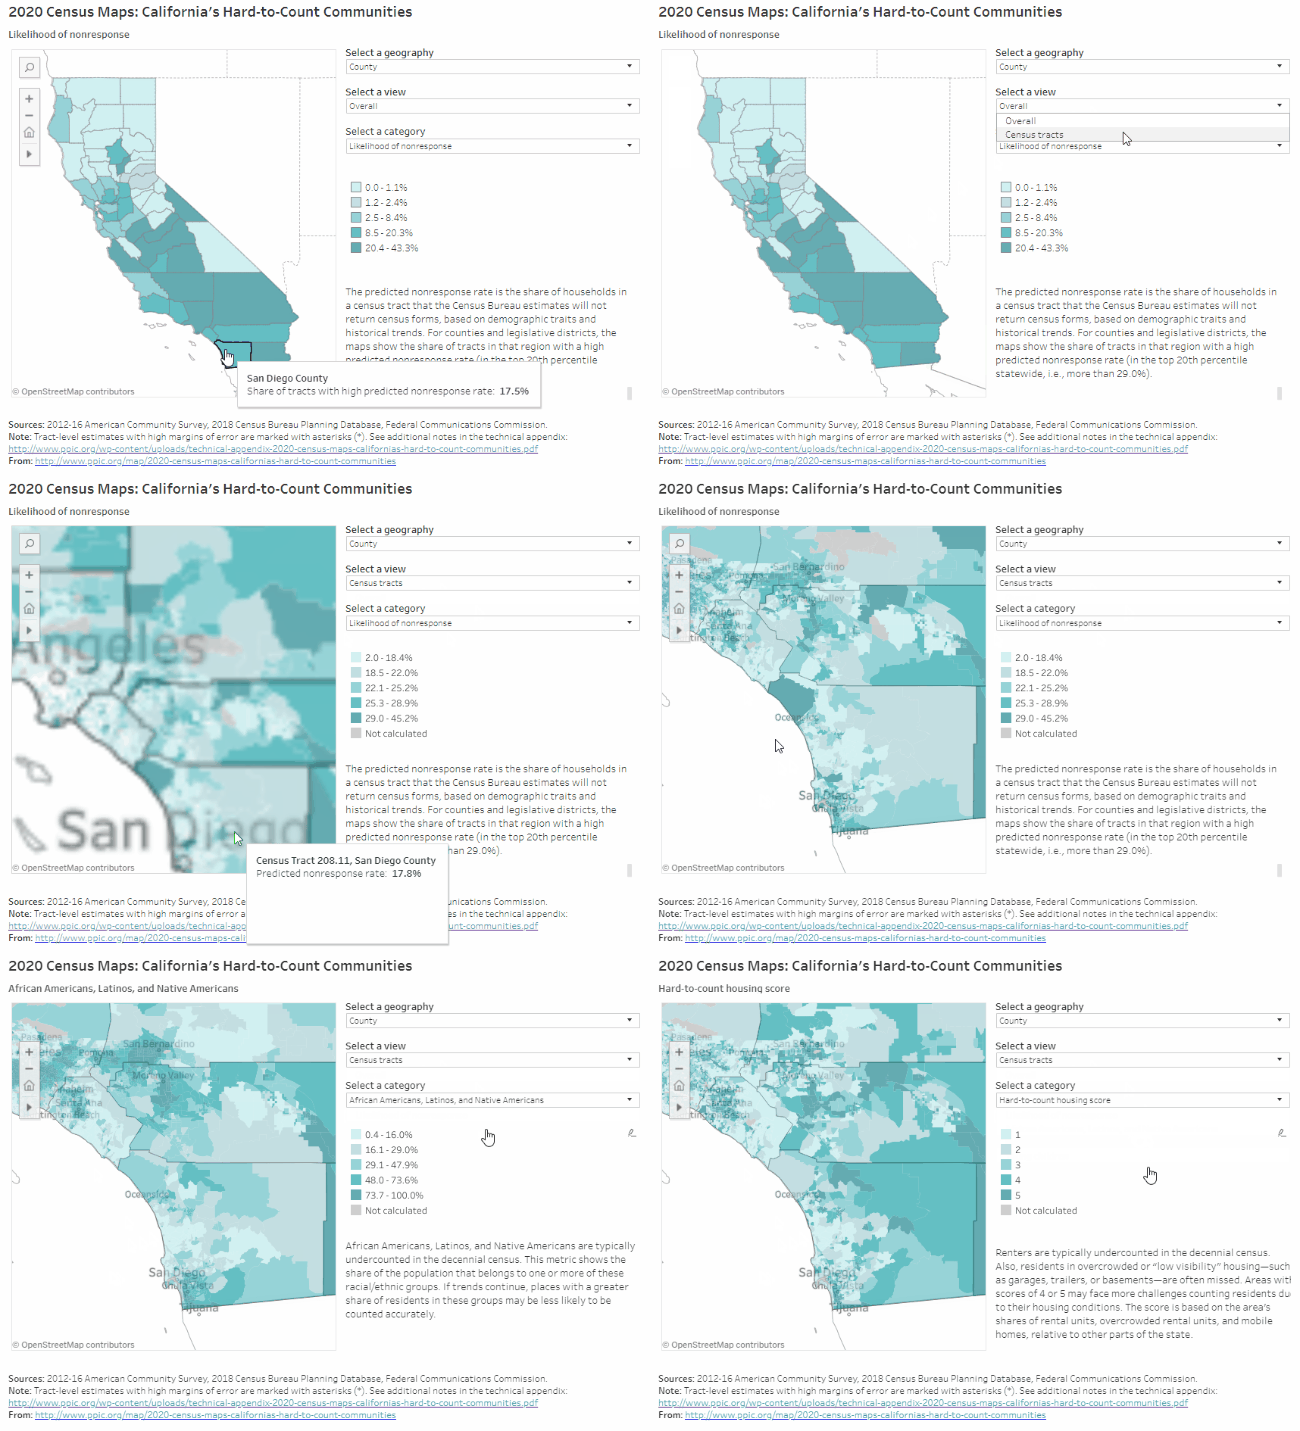
PPIC’s interactive census maps are an important tool for Californians working to ensure an accurate census count. Using estimates from the Census Bureau and the Federal Communications Commission, they highlight hard-to-count communities across the state and pinpoint reasons why certain areas may be hard to reach.

More than 6.5 million Californians live in Orange and San Diego Counties. In Orange County, the hardest-to-reach neighborhoods are found in Anaheim, Buena Park, Santa Ana, and Tustin. In San Diego County, the hardest-to-count areas include parts of Oceanside and Escondido in the northwest and, in the southwest, pockets of the cities of San Diego and Chula Vista. Altogether, San Diego County has a higher share of these very hard-to-count areas (18% of census tracts) than Orange County (11%), according to Census Bureau estimates that draw on demographic characteristics (e.g., race/ethnicity, age, citizenship, and housing conditions) and historical trends. Both counties have higher shares of these areas than 60% of counties, statewide. Households in these very hard-to-count areas are the least likely to respond initially to census forms and are therefore at risk of being undercounted.

Some highlights:

  • Undercounting hard-to-reach areas could affect political representation in the region. Since the 2020 Census will be used to redraw legislative district lines, political representation could shift away from certain neighborhoods if they are undercounted relative to other areas. For example, in Assembly District 80 (Gonzalez Fletcher), which covers southern parts of the cities of San Diego and Chula Vista, as well as a stretch of the southern border with Mexico, 52% of households are predicted to not respond initially to the census—compared to 19% in the surrounding districts.
  • Knowledge of local population trends can help guide effective outreach. Some neighborhoods in the region have higher concentrations of African Americans, Latinos, or Native Americans—populations that have historically been undercounted in the census. Latinos make up the large majority of residents around Anaheim and Santa Ana in Orange County, as well as in parts of the cities of San Diego and Chula Vista in San Diego County. In some of these same neighborhoods, more than a quarter of residents are noncitizens, who may be less likely to respond in 2020 due to the planned addition of a citizenship question. Moreover, in central and eastern parts of San Diego County, working with tribal governments to reach Native Americans will be necessary to count all residents.
  • Housing conditions may present challenges to an accurate count, particularly in urban areas. Renters and people living in overcrowded conditions or mobile homes can be harder to count accurately. Hard-to-count housing in the region is concentrated in urban parts of Orange County and in urban and eastern San Diego County. For example, in several neighborhoods in Anaheim, Stanton, and Santa Ana in Orange County, more a quarter of rentals are overcrowded. The same is true for many neighborhoods in the southwest corner of San Diego County, which also often have high shares of mobile homes. San Diego County has hard-to-count housing in inland areas as well, including in Bostonia, El Cajon, and several tribal lands.
  • The region has small pockets of relatively low internet access. The Census Bureau plans to collect most responses online in 2020—a change from previous practice. Though urban areas generally have better internet access than rural areas do, a number of neighborhoods in the cities of San Diego and Chula Vista actually have fewer high-speed residential internet connections than the surrounding suburbs. Central and eastern San Diego County also have relatively low internet connectivity. In these places, it may be harder to collect responses online, and participation will rely more heavily on paper forms, in-person census takers, or internet provided by local institutions.

We hope these maps serve as a starting point to help local, regional, and state leaders think about which activities, resources, and partnerships—including language assistance, awareness raising, and community outreach—might be most effective for accurately counting different parts of California. Stay tuned for future posts that examine hard-to-count communities in other regions of the state.

Making Career Education Affordable in California

Secretary of Education Betsy DeVos recently announced plans to eliminate rules put in place during the Obama administration that require career-education colleges to show that the credentials they award lead to gainful employment. In California, these rules have helped shift enrollment from expensive for-profit institutions to public community colleges, which offer career education programs at much lower cost. Indeed, California’s community college system is one of the most affordable higher education institutions in the country.

Many are concerned that eliminating gainful employment rules will lead to a loss of accountability and even a resurgence of enrollment in for-profit colleges. Some of those colleges have engaged in predatory recruiting practices, and many have high dropout rates and exorbitant student debt. In California, there are also concerns about a reversal of recent gains in affordable access to higher education—particularly among groups that have historically been underserved.

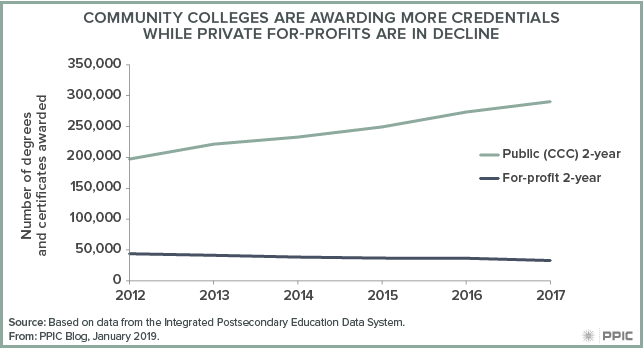
Partly because of the information provided by the gainful employment rules, career education students in California have been increasingly seeking degrees and certificates at the state’s large public community college system rather than at for-profit colleges. Between 2012 and 2017, the number of associate degrees and certificates conferred by for-profit institutions dropped by 25%. In comparison, the state’s community colleges saw an increase of 47%; in 2017, the number of degrees and certificates they awarded was more than eight times the number awarded by for-profit colleges.

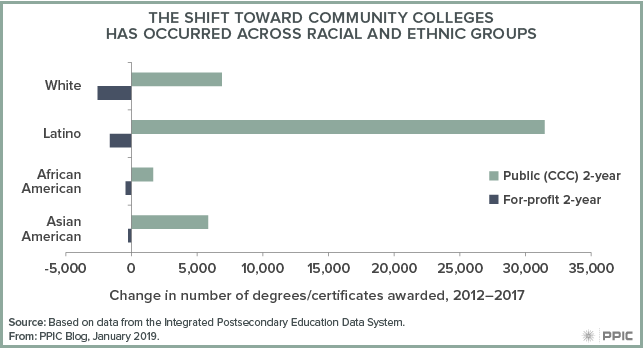
Many for-profit institutions have targeted workers looking to get into in-demand fields such as health or family and consumer sciences. These for-profits have marketed options that lead to credentials—known as short-term certificates—that can be earned in less than one year. In 2012, private for-profit colleges awarded almost 21,000 short-term certificates compared to 38,000 awarded at the community colleges. But by 2017 the number of short-term certificates awarded had declined to fewer than 7,000 at for-profit colleges and risen to more than 55,000 at the community colleges. Many of the students who have shifted to the community colleges in recent years are from historically underserved backgrounds (e.g., African American, Latino, older, and low-income students). These students now have opportunities for career education without the hefty price tag attached to programs at for-profit colleges.

The elimination of federal gainful employment rules could have a negative impact on affordable access to career education. However, efforts by California’s community colleges to attract students who might be drawn to for-profit institutions will continue. So too will state rules that make institutions with low graduation rates and high loan default rates ineligible for Cal Grants. These state-level initiatives might not be able to prevent a resurgence of exploitative for-profits, but they could make a difference for many Californians.

PPIC Turns 25

Times were tumultuous in the California of the 1990s: recession, strife over police-community relations, a voter revolt that ushered in term limits, contentious immigration debates.

There was an urgent need to address these and other issues that affected every Californian. But government had few resources to research the facts and perform the analysis necessary to help leaders to make informed decisions. PPIC was born of this need. Twenty-five years later, the necessity of nonpartisan, fact-based research has never been greater.

PPIC was founded by three exceptional leaders: Roger W. Heyns, former chancellor of University of California, Berkeley; Arjay Miller, former president of Ford Motor Company and former dean of Stanford Business School; and William R. Hewlett, co-founder of Hewlett-Packard Company. These visionaries wanted to help California’s leaders better understand policy issues through objective, evidence-based research. An endowment by Hewlett made their vision of a nonpartisan, nonprofit think tank a reality.

In 1994, the year PPIC was founded, a major earthquake shook Northridge; Orange County became the largest municipality in US history to file for bankruptcy; and California voters passed Proposition 187, which would have banned undocumented immigrants from using public services. The proposition was later declared unconstitutional, but the issues it raised and the backlash it created have powerfully influenced politics and policy ever since.

The issues that surfaced in the ’90s were complex, challenging—and are still with us, even though the state’s demographics, economy, and political climate have changed. PPIC has grown and evolved because it was built to be relevant and resilient. As the state has dealt with a gubernatorial recall, a major recession, and a lengthy drought, our work has evolved to meet its changing needs.

During the recent drought, we created the PPIC Water Policy Center to help spur innovative water management solutions. After our research demonstrated that California is not producing enough college graduates to meet the needs of our future economy, we founded the PPIC Higher Education Center. Our work there is focused on finding practical solutions that enhance educational opportunities for all Californians.

We do not do this work alone. PPIC has developed an extensive network of advisors and other engaged Californians to ensure our relevance, expand our reach, and deepen our impact. Our colleagues in local, state, and federal government often put our research into practice. Our board of directors and statewide leadership council provide us with valuable insights, and members of the business and nonprofit communities serve as our ambassadors.

In this year of transition, PPIC will be an essential resource for new leaders—the governor, legislators, members of Congress, and others who care deeply about public policy. We will offer analysis and advice on a number of key topics. Through the PPIC Statewide Survey, our leaders will regularly have the opportunity to find out what the public thinks of new policies and proposals.

In our Speaker Series on California’s Future, we plan to draw on the vast experience of past leaders by inviting all living former governors to share the stage. They will talk about lessons they have learned and offer their thoughts about the state’s future.

PPIC’s first 25 years have been exciting, rewarding, and challenging. We expect no less of the next 25—and we invite you to join us by keeping up to date with our activities and offering your support.

Commentary: Peace in California’s Water Wars is Within Grasp

This commentary was published in CALmatters on December 19, 2018.

Dare we say it? The outlines of a truce in California’s unending water battles began to come into focus last week, though not everyone is willing to sign the treaty. The State Water Board adopted the first phase of a far-reaching revision to the Water Quality Control Plan for the Sacramento‒San Joaquin Delta and its watershed.

This is an effort to improve conditions for dwindling populations of endangered native fish such as salmon and steelhead. It also means an increase in water scarcity for farms and cities.

The mere adoption of the plan was significant. But something else happened in the board meeting that may in fact be more important and longer-lasting: state officials presented the framework of a peace treaty for Central Valley water wars.

With support from Governor Jerry Brown and Governor-Elect Gavin Newsom, most of the combatants negotiated the outlines of a comprehensive settlement agreement.

The Natural Resources Agency—including the Department of Water Resources and the Department of Fish and Wildlife—spent countless hours over several years convincing water users to develop a voluntary approach to improve ecosystem conditions for native fishes.

The approach state officials presented to the board would increase flows in rivers and the Delta and make major investments in habitat. And perhaps most important, it would create sustainable funding for these efforts (including fees on water diversions), while improving scientific research on and governance of restoration efforts.

To be clear, a framework was presented, not an actual settlement. But the framework contains commitments of water, habitat restoration and funding.

It also includes timelines for action from water users across the greater Sacramento–San Joaquin River watershed, and a willingness to get this settlement completed by the end of 2019. A few districts—such as the Oakdale, South San Joaquin and Merced Irrigation Districts—balked at the framework and are threatening litigation. But most of the watershed has signed on.

If this settlement is achieved and adopted by the board, it will be a major step forward in water management in the Central Valley. But a lot of work lies ahead. Water and habitat commitments—along with sources of funding—need further negotiation, and a robust governance and science program still needs to be designed. Additionally, many of the non-governmental environmental organizations that were mostly left out of negotiations need to be more involved.

Finally, the federal government can either be a partner or a roadblock to this effort. Federal representatives actively participated in negotiations and helped spur innovative approaches along the way.

But after the State Water Board’s vote, the US Bureau of Reclamation threatened litigation, and the Trump administration is seeking to roll back environmental standards in the Delta. Both actions have the potential to undo the settlements.

Despite these hurdles, there’s reason for optimism that there can be a truce in California’s water wars. What’s clear is that negotiated solutions to water conflicts are fairer and longer-lasting than top-down regulatory solutions or, worse yet, litigated solutions where judges end up trying to manage water.

Incoming Governor Newsom’s support and involvement will be essential to carry this effort to a positive conclusion. It should be a priority for his new administration.

Video: Californians and Their Government

As Governor-Elect Gavin Newsom prepares for his first term, half of Californians think he should take a different policy direction than Governor Brown. Four in ten approve of Newsom’s plans and priorities—while three in ten don’t yet know enough to have an opinion. These and other key findings of the latest PPIC Statewide Survey were outlined by Dean Bonner at a Sacramento briefing last week.

The survey asked Californians about four major policy areas that were highlighted in the governor’s campaign. Most see universal health coverage and free community college as top priorities, while fewer see universal preschool as a high or very high priority and only one in four prioritize high-speed rail.

The survey also asked how the state should use the projected surplus in the next budget year. A majority of Californians say they would prefer to use the surplus to increase funding for education and health and human services. Far fewer prefer to use it to pay down debt and build up a reserve or to spend on one-time funding for transportation, water, and infrastructure.

When asked to identify the state government’s highest priority in planning for the future, 39% name improving jobs and the economy, 20% say protecting the environment, and 15% say updating water and transportation infrastructure. Improving jobs and the economy is the highest priority across all parties and demographic groups.

Other survey highlights:

  • Two-thirds of Californians say the state is divided into two economic groups: the “haves” and the “have nots.” Four in ten characterize themselves as haves and 45% say they are have nots.
  • While more than half of Californians think the state is generally headed in the right direction, only about a third are satisfied with the way things are going in the nation. Half have no confidence that President Trump will make the right decisions for the country’s future.
  • Only two in ten likely voters approve of Congress; more than half see the shift in control of the US House from the Republicans to the Democrats as a good thing.
  • Two-thirds of state residents continue to see immigrants as a benefit, and there is still bipartisan support for allowing undocumented immigrants to stay in the US legally if certain requirements are met.

What Approval Ratings Say about Jerry Brown’s Legacy

Perhaps Governor Jerry Brown’s most important contribution—rooted in the higher approval ratings for the executive and legislative branches—was to restore public confidence in state government.

That’s my conclusion after we at the Public Policy Institute of California have taken 64 surveys since Brown took office in January 2011 asking the same question: “Overall, do you approve or disapprove of the way that Jerry Brown is handling his job as governor of California?”

For most of the time since 2011, political gridlock stymied Barack Obama, Donald Trump, and Congress.

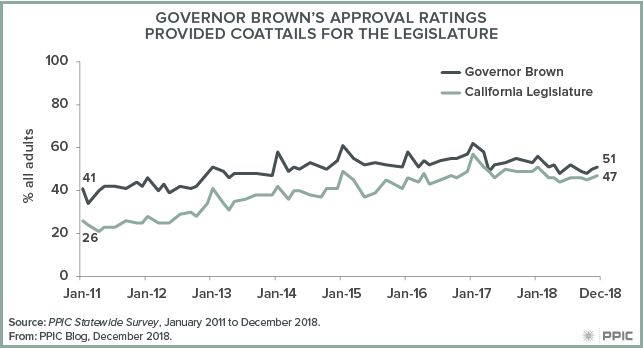
But in California, Brown and the state legislature were solving problems. Survey results show that the public responded. Brown’s latest (and our final) approval rating stands at 51 percent. That’s 10 points higher than his approval rating in our January 2011 survey. Brown’s approval rating surpassed 60 percent twice—after his 2014 reelection and after Trump’s election, when our January 2017 survey had the governor at a 62 percent approval rating. Not surprisingly, Brown’s highest approval ratings today are among Democrats and self-identified liberals, 68 percent and 69 percent, respectively, and is least popular among Republicans at 18 percent and self-identified conservatives at 36 percent.

Notably, his canoe theory of politics—paddle to the left, and then paddle to the right—seems to have worked well. About half of independents and moderates approve of the governor. Brown’s approval rating has never dipped below 47 percent since the voters passed his Proposition 30 tax increase in October 2012. The recent campaign for the Proposition 6 gas tax repeal and the race for his successor apparently had no effect on Brown’s popularity.

Brown steered through troubled fiscal waters that damaged other political careers. The approval rating for Gray Davis hit 31 percent in the September 2003 PPIC survey as he faced the recall that ended his time in office. His replacement, Arnold Schwarzenegger, had a 25 percent approval rating in the November 2010 PPIC survey, as the state suffered from massive budget deficits and he and the legislature struggled with unpopular spending and tax decisions.

The state legislature had been mired in low approval ratings for years. Perhaps the legislature rode the coattails of Brown’s success—its approval rating increased by 21 points, from 26 percent in the January 2011 PPIC survey to 47 percent in December. California’s fiscal recovery was certainly tied to more positive views of the governor and legislature. The perception that the state budget situation “is a big problem” fell by 25 points, from 68 percent in January 2011 to 43 percent in January 2018. At the same time, during Brown’s time in office, the belief that the state is generally going in the right direction grew by 16 points to 54 percent in December 2018.

Brown and the legislature took the drama out of the annual budget process, passed popular laws on education funding and climate change, responded to crises such as drought and wildfire, and maintained a united front against Trump’s unpopular policies.

Will Brown be be a hard act to follow for Gavin Newsom?

Maintaining fiscal stability and an effective partnership with the state legislature will be the key ingredients. Jerry Brown will be leaving office with Californians in a better state of mind than they were in eight years ago. His tenure offers a successful model for governing the state in the future.

Election Takeaways: Golden State of Mind

With the release of California’s official Statement of the Vote, the state’s final tally is in for the November 2018 election. This midterm election will mostly be remembered for California’s role in changing party control of Congress. But several other statewide results also stand out:

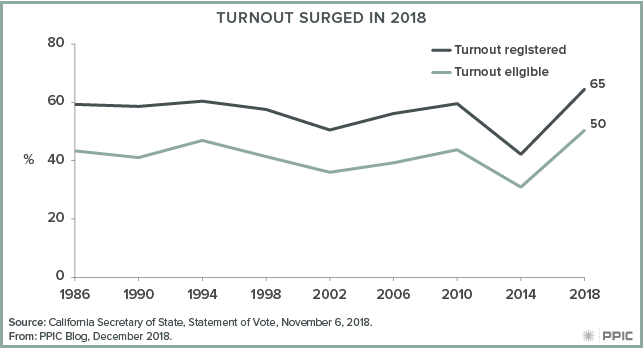
  • High turnout. A record-setting 19,696,371 Californians—78% of eligible adults—were registered to vote by the deadline for the general election. An increase of 1,892,548 registered voters since the 2014 general election represents the biggest surge in voter registration between midterm elections in the past 20 years, according to California’s Secretary of State. The 12,712,542 voters who cast ballots is an all-time high for a midterm and, at 65% of registered voters and 50% of eligible adults, this is the highest midterm turnout in the past 30 years. These increases follow record low turnout in 2014. Many factors were at work in heightening political engagement this fall, including intense media interest in California congressional races that carried over from the June primary; voter participation that was stoked by disapproval of President Trump and dislike of his immigration, environment, and tax policies; and new state laws that are being implemented to make it easier for Californians to register to vote and cast ballots.

  • Blue wave. Democratic candidates won every statewide race and gained enough state legislative seats to have well over a two-thirds majority in the state assembly (60 Democrats, 20 Republicans) and state senate (29 Democrats, 11 Republicans). Democrats also increased their grip on the California congressional delegation (46 Democrats, 7 Republicans). What accounts for this one-party dominance? Midterm elections are often described as a referendum on the president, and President Trump’s approval rating was at 39 percent in the October PPIC survey. PPIC surveys also found an “enthusiasm gap” in voting for congressional candidates, which further skewed the partisan turnout in favor of Democrats. But the difficulties facing Republican candidates go beyond this fall’s political headwinds. The November ballot did not even include Republican candidates for US senator, lieutenant governor, or insurance commissioner—no Republicans made it past the top-two June primary for these offices. The Republicans have not won a statewide race since 2006 and, in this time, their share of the electorate has declined by 10 points (34% to 24%) while their ranks have also diminished (5.4 million to 4.7 million), according to the Secretary of State.
  • Diverse officeholders. Gavin Newsom was elected governor in the only statewide race featuring two white men. California’s other statewide winners were four women, three Latinos, two Asian Americans, one African American, and one openly gay man. Notably, women candidates won all their races while all those who lost—five Republican candidates, the sole No Party Preference candidate, and a nonpartisan candidate—were white men. However, regional diversity was missing, with six successful candidates from the San Francisco Bay Area and three from the Los Angeles region. There were none representing the populous regions of the Central Valley, the Inland Empire, and the South Coast (Orange/San Diego)—or the more sparsely settled central coast and far north.
  • Words matter. Propositions 1 and 2, placed on the November ballot by the legislature, passed—consistent with the historically high pass rate for legislative ballot measures. However, just three of the eight citizens’ initiatives passed, consistent with the historically low pass rate for these types of initiatives. Among the most notable failures were the Proposition 6 gas tax repeal and the Proposition 10 rent control measure. The September PPIC Survey found that about half of likely voters favored the general idea of both the gas tax repeal (50%) and rent control (52%), but only four in ten said they would vote yes when they were read the ballot titles and labels. The defeat of Proposition 6 (56.8% no) and Proposition 10 (59.4% no) once again demonstrates that the devil is in the details when it comes to voter support for citizens’ initiatives on the ballot.

It’s no coincidence—given what PPIC studies say about the profiles of likely voters and nonvoters—that rising political participation in California means that the Democratic Party is becoming more dominant and that statewide officeholders are more likely to reflect the state’s diversity. And it is important to note that Californians continue to be highly selective about making public policy at the ballot box as more and more voters engage with the citizens’ initiative process. Still, millions of Californians are not registered to vote and don’t cast ballots. These residents tend to identify as “have nots” and are often most in need of government services. For this reason, the PPIC Statewide Survey will continue to provide a voice—for all adults in addition to likely voters—on state and national issues. Tracking policy preferences across the broadest swath of Californians is especially critical today, as newly elected state officeholders and state and federal legislators switch from campaign mode to policymaking.

Video: Higher Education as a Driver of Economic Mobility

Higher education plays a key role in helping Californians move up the income ladder—but equity gaps are a big challenge. Among young adults born in California, 60% of Asian Americans and 40% of whites have at least a bachelor’s degree, compared to 21% of African Americans and 18% of Latinos. At a Sacramento briefing yesterday, PPIC researcher Sarah Bohn outlined these and other key findings of a new report.

Bohn noted that “higher education is correlated with a host of benefits in today’s society.” Workers with at least a bachelor’s degree earn 73% more than high school graduates. While earnings levels are affected by many factors—including the subject area of a college major, geographic location, and the field of employment—Bohn stressed that “the higher the level of education you have, the greater the economic return that you experience.”

California has historically enjoyed strong economic and education gains. However, while the economy is currently booming, recent trends in educational attainment are not as encouraging. Young adults in California today are only slightly more likely to have graduated from college than older adults. Moreover, graduation rates are lower for low-income residents and underrepresented race/ethnic groups.

These equity gaps are especially troubling because low-income, Latino, and African American students—as well as students who would be the first generation in their families to attend college—make up the vast majority of California’s high school population. The community colleges, UC, and CSU have undertaken serious efforts to narrow these gaps—but, as Bohn noted, all educational sectors, including K–12 schools and private institutions, play an important role.

California’s higher education systems have been implementing policies and programs that are likely to increase college graduation rates among the state’s diverse population. Bohn concluded by highlighting the progress that has been made and outlining additional actions that can help more Californians—particularly underrepresented students—benefit from higher education.