2020 Census: Counting the Sacramento Area

The decennial census plays an essential role in American democracy. Our series of blog posts examines what’s at stake for California and the challenges facing the 2020 Census, including communities that are at risk of being undercounted.  

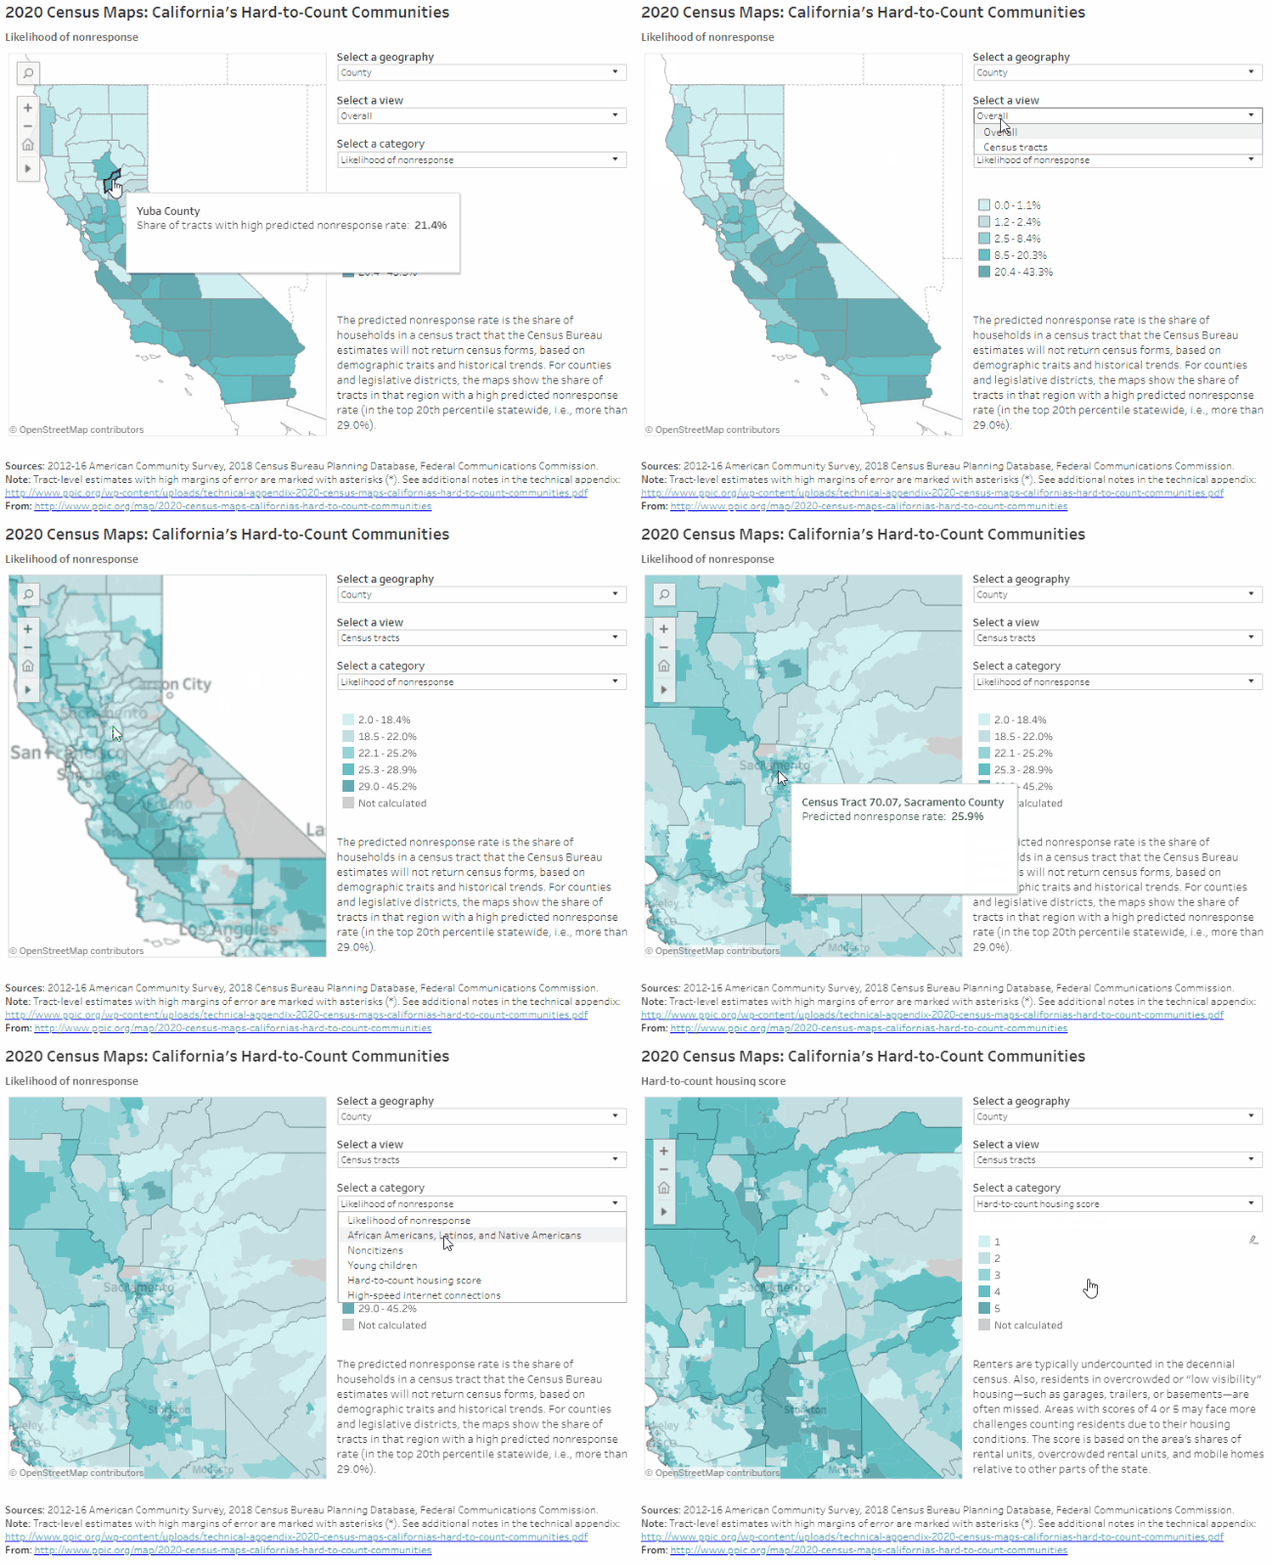
PPIC’s interactive census maps are an important tool for Californians working to ensure an accurate census count. Using estimates from the Census Bureau and the Federal Communications Commission, they highlight hard-to-count communities across the state and pinpoint reasons why certain areas may be hard to reach.

Home to about 2.5 million people, the Sacramento area includes the counties of El Dorado, Placer, Sutter, Yolo, and Yuba, in addition to Sacramento. Within this region, Yuba has the highest share of very hard-to-count areas (21%)—in the top fifth of hardest-to-count counties across the state—and Sacramento has the second highest (10%). Households in these very hard-to-count areas are less likely to respond initially to census forms and are therefore at risk of being undercounted, according to Census Bureau estimates that draw on local demographic characteristics (e.g., race/ethnicity, age, citizenship, and housing conditions) and historical trends.
Some highlights:

  • Legislative districts that include the fast-growing city of Sacramento will likely be the hardest to count. In Congressional District 6 (Matsui), Senate District 6 (Pan), and Assembly District 7 (McCarty), between 14% and 19% of neighborhoods are considered very hard to count. Other legislative districts in the region tend to cover more suburban or rural areas and have much smaller shares of very hard-to-count communities.
  • There are small pockets of hard-to-reach areas across the region. Within Sacramento County, hard-to-reach areas are concentrated in the city of Sacramento, as well as around Rancho Cordova and Folsom. In some neighborhoods, 30% or more of households are predicted to not respond initially to the census. Other relatively hard-to-reach areas include Yuba City and Marysville at the border of Sutter and Yuba Counties, Davis and Woodland in Yolo County, and the eastern border of Placer and El Dorado Counties, directly north and south of Lake Tahoe.
  • Local population trends can help guide effective outreach. African Americans, Latinos, and Native Americans have historically been undercounted in the census. Overall, these groups make up a lower share of the population in the Sacramento area compared to the rest of the state. However, in much of the city of Sacramento, around Woodland and northwest Yolo County, and in South Yuba City and northeastern Sutter County, more than half of residents are from historically undercounted communities—primarily African American and Latino. Some of these areas have relatively high shares of noncitizens as well. Noncitizens may be less likely to respond to the 2020 Census because of the planned addition of a citizenship question and concerns about deportation and privacy.
  • Parts of the Sacramento area have high shares of young children. Young children are historically underrepresented in the census. In census tracts in the eastern parts of Sutter County and southern Yuba County, in the city of Sacramento and surrounding suburbs, and the southwestern tip of Placer County, 9% or more of residents are children under five years old, compared to 6.5% statewide.
  • Housing conditions may make an accurate count challenging. High shares of rentals, overcrowded rental units, and mobile homes can make it more difficult to count residents accurately. Around Yuba City and Marysville, all of these factors are prevalent: in some neighborhoods, more than 65% of housing units are rented, about a quarter of those are overcrowded, and 15% of households live in mobile homes. In the city of Sacramento, housing conditions vary, with some neighborhoods seeing high rates of overcrowding but low rates of mobile homes, while others see the reverse. Reaching residents in nontraditional housing will be critical to an accurate count—and will depend on local knowledge of how families make ends meet.
  • Limited internet access may be an issue in rural areas throughout the region. The Census Bureau plans to collect the majority of responses online in 2020—a change from previous practice. Each county in the region has some census tracts with minimal residential high-speed connectivity, with the lowest access outside of the city of Sacramento, Lake Tahoe, Yuba City, and Marysville. Outside of these areas, it may be harder to collect responses online, and participation will rely more heavily on in-person census takers or internet provided by local institutions.

We hope these maps serve as a starting point to help local, regional, and state leaders think about which activities, resources, and partnerships—including language assistance, awareness raising, and community outreach—might be most effective for accurately counting different parts of California. Stay tuned for future posts that examine hard-to-count communities in other regions of the state.

 

2020 Census: Counting the Central Coast

The decennial census plays an essential role in American democracy. Our series of blog posts examines what’s at stake for California and the challenges facing the 2020 Census, including communities that are at risk of being undercounted.  

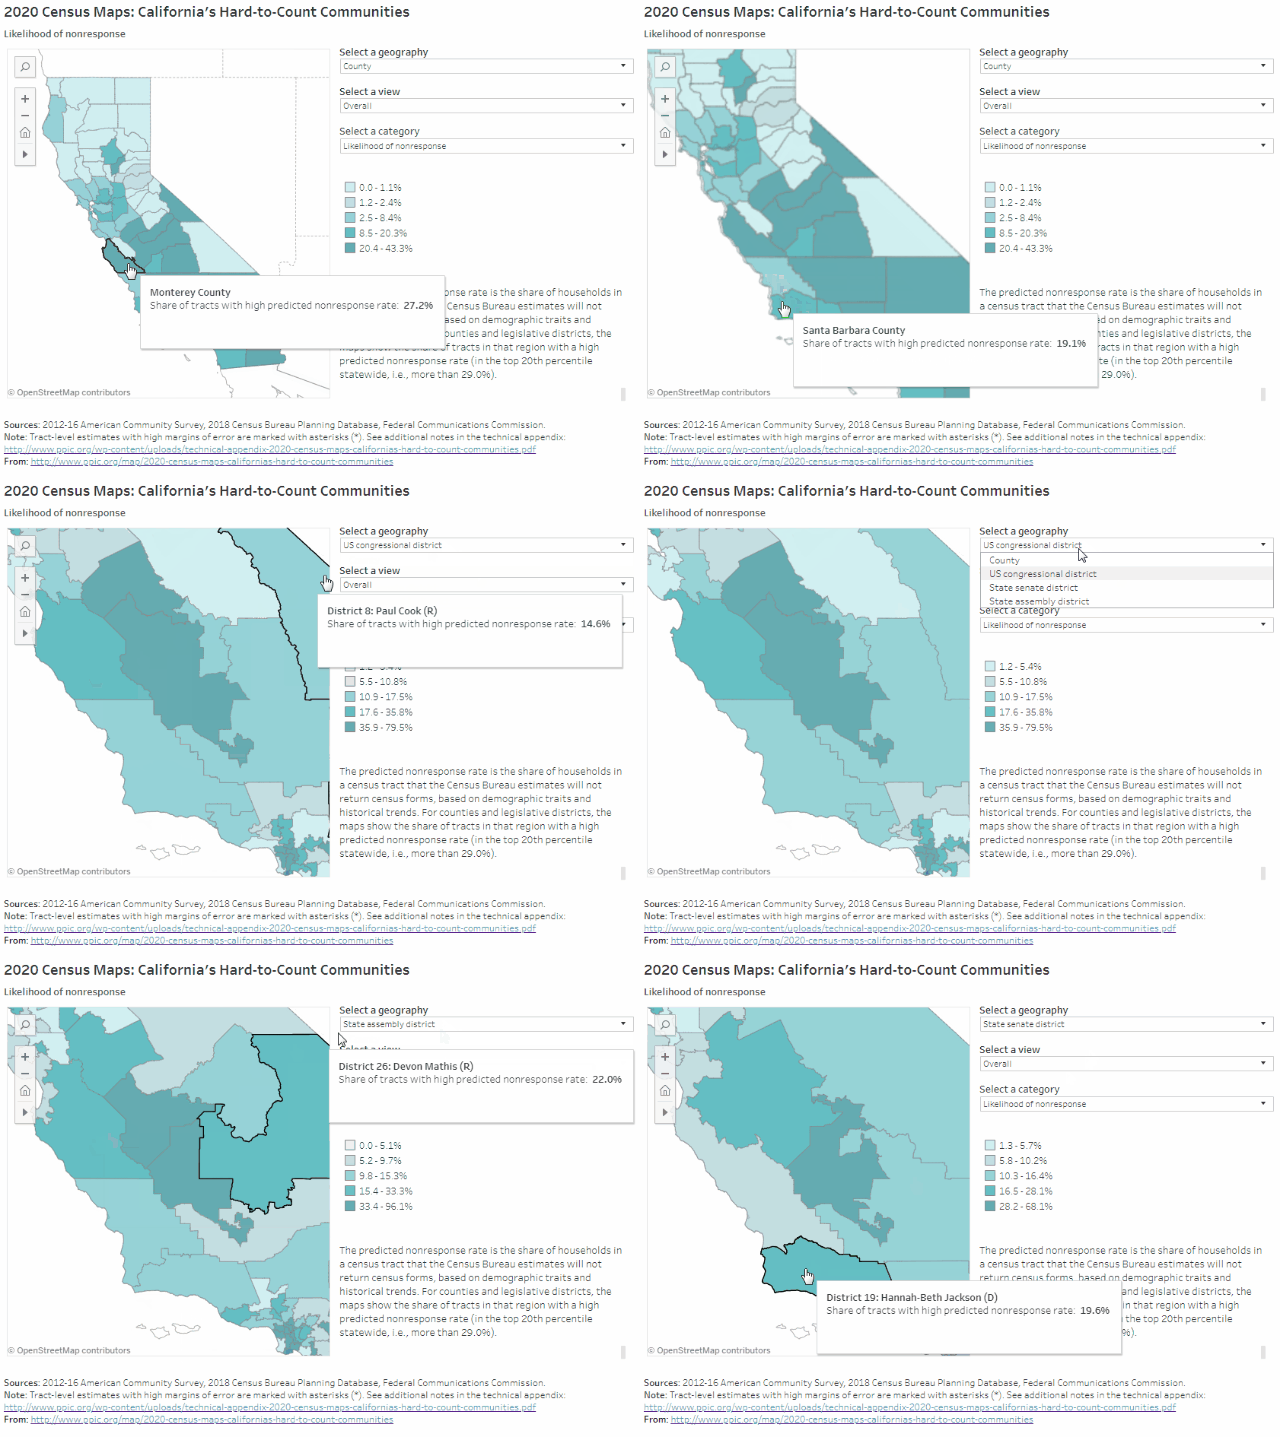
PPIC’s interactive census maps are an important tool for Californians working to ensure an accurate census count. Using estimates from the Census Bureau and the Federal Communications Commission, they highlight hard-to-count communities across the state and pinpoint reasons why certain areas may be hard to reach.

More than 2 million Californians live in the Central Coast counties of Monterey, San Benito, San Luis Obispo, Santa Barbara, and Ventura. Monterey County has by far the region’s highest share of very hard-to-count census tracts (27%), followed by Santa Barbara (19%) and Ventura (12%). Households in these very hard-to-count areas are at risk of being undercounted because they are less likely to respond initially to census forms, according to Census Bureau estimates that draw on historical trends and local demographic characteristics (e.g., race/ethnicity, age, citizenship, and housing conditions).

Census Central Coast

Some highlights:

  • The implications of undercounting very hard-to-reach places differ widely for Central Coast legislators. In two districts representing much of Monterey County—Assembly District 30 (Caballero) and Congressional District 20 (Panetta)—about a fifth or more of census tracts are likely to be very hard to count. The same is true for Senate District 19 (Jackson), covering Santa Barbara and most of Ventura County. Other Central Coast districts have relatively low shares of hard-to-count areas. Given this wide variation, understanding the overlapping factors that can make populations hard to reach will be key to ensuring an accurate count of the Central Coast.
  • There are hard-to-reach areas scattered throughout the region. In Monterey County, areas around Salinas and the Salinas Valley are likely to be the most difficult to count, with 30% or more of households predicted not to respond initially to the census. Other hard-to-reach areas can be found in the city of San Luis Obispo; Santa Maria, Santa Barbara, and Isla Vista in Santa Barbara County; and around Oxnard and Port Hueneme in Ventura County.
  • Monterey and San Benito Counties have relatively high shares of historically undercounted racial/ethnic groups. The census has typically undercounted African Americans, Latinos, and Native Americans. These groups make up about 60% of residents in Monterey and San Benito Counties—but just 24% of San Luis Obispo residents. In Santa Barbara and Ventura Counties, these racial/ethnic groups comprise about 45% of the population, similar to the state overall.
  • Undercounting young children and noncitizens would dramatically misrepresent Monterey County. Young children have been historically undercounted in the census. In addition, noncitizens may be less likely to respond in 2020 due to the planned addition of a citizenship question and fears about privacy and deportation. Almost 22% of Monterey County residents are noncitizens, and about 8% are under five years old—some of the highest concentrations in the state.
  • Outreach to residents in hard-to-count housing will be key to accurately representing the Central Coast. Monterey and Santa Barbara Counties have especially high shares of rental units, overcrowded rentals, and mobile homes. These conditions make it difficult for the Census Bureau to find and count residents. In both counties, nearly 1 in 10 housing units is an overcrowded rental. Northern San Benito County, coastal San Luis Obispo County, Santa Maria, Oxnard, and the Santa Clara River Valley also have hard-to-count housing and will require targeted outreach to fully count residents.
  • Limited internet access may be an issue in rural areas throughout the region. The Census Bureau plans to collect the majority of responses online in 2020—a change from previous practice. Each county along the Central Coast has some census tracts with minimal residential high-speed connectivity, with the lowest access outside cities. In Monterey County, for example, fewer than 400 out of every 1,000 households around Prunedale have high-speed internet connections, compared with 600–800 in neighboring Salinas. While people in these areas may have internet through smartphones or public libraries, in general they may have more trouble responding to the census online.

We hope these maps serve as a starting point to help local, regional, and state leaders think about which activities, resources, and partnerships—including language assistance, awareness raising, and community outreach—might be most effective for accurately counting different parts of California. Stay tuned for future posts that examine hard-to-count communities in other regions of the state.


Video: 2020 Census: ¿Por qué es tan importante el censo?

El censo decenal juega un papel muy clave en la democracia estadounidense. Es bastante lo que está en juego para Californiay el año 2020 se acerca rápidamente.

En este video grabado en español, Joe Hayes, investigador de PPIC, explica la importancia del censo del año 2020, y comenta sobre la propuesta de incluir una pregunta sobre la ciudadanía.

Vea más videos en esta serie.


The decennial census plays an essential role in American democracy. The stakes are huge for California—and 2020 is fast approaching.

In this Spanish-language video, PPIC researcher Joe Hayes explains the importance of the 2020 Census and discusses the proposed citizenship question.

View more videos in this series.


An English transcript of the video is available here.

The 2020 Census and Political Representation in California

California’s political representation will be affected by the 2020 Census—but an accurate count is far from guaranteed. Inadequate funding and fear in the state’s large immigrant population are heightening concern about an undercount. At a briefing in Sacramento last week, PPIC researcher Eric McGhee outlined a new report that draws on population trends and research on past undercounts to develop plausible scenarios for 2020.

“I think it’s fair to say that we are unlikely to lose a congressional seat if there is an accurate count,” said McGhee. However, California is more vulnerable to an undercount than most other states. Three in four Californians belong to at least one of the populations that are difficult to count: children, young men, Latinos, African Americans, immigrants, and renters.

An undercount could cause the state to lose one of its 53 seats in the House of Representatives. It could also have an impact on political representation within California. If the state does a poor job of reaching hard-to-count populations, it might end up drawing congressional and state legislative districts that shift representation from poorer areas with larger communities of color to areas that are wealthier and less diverse.

Privacy concerns have increased both the difficulty and the cost of conducting census surveys. The current political climate is likely to exacerbate these concerns, especially now that a question on citizenship status has been added to the 2020 survey. (The addition is being contested in the courts.) Moreover, the 2020 Census will be the first to collect a majority of responses online. The Census Bureau is testing the Internet survey but lacks the resources to test outreach and follow-up. Because California has a disproportionate share of historically undercounted residents, these challenges are of particular concern.

But, as McGhee pointed out, “California’s fate is still in its own hands.” This year’s state budget allocates about $90 million for census outreach, which should help community organizations and state and local governments educate residents about the importance of the census and the security of the information collected. Californians need to know that “a better count in California could make a big difference.”

2020 Census: Counting Los Angeles County

The decennial census plays an essential role in American democracy. Our series of blog posts examines what’s at stake for California and the challenges facing the 2020 Census, including communities that are at risk of being undercounted.

PPIC’s interactive census maps are an important tool for Californians working to ensure an accurate census count. Using estimates from the Census Bureau and the Federal Communications Commission, they highlight hard-to-count communities across the state and pinpoint reasons why certain areas may be hard to reach.

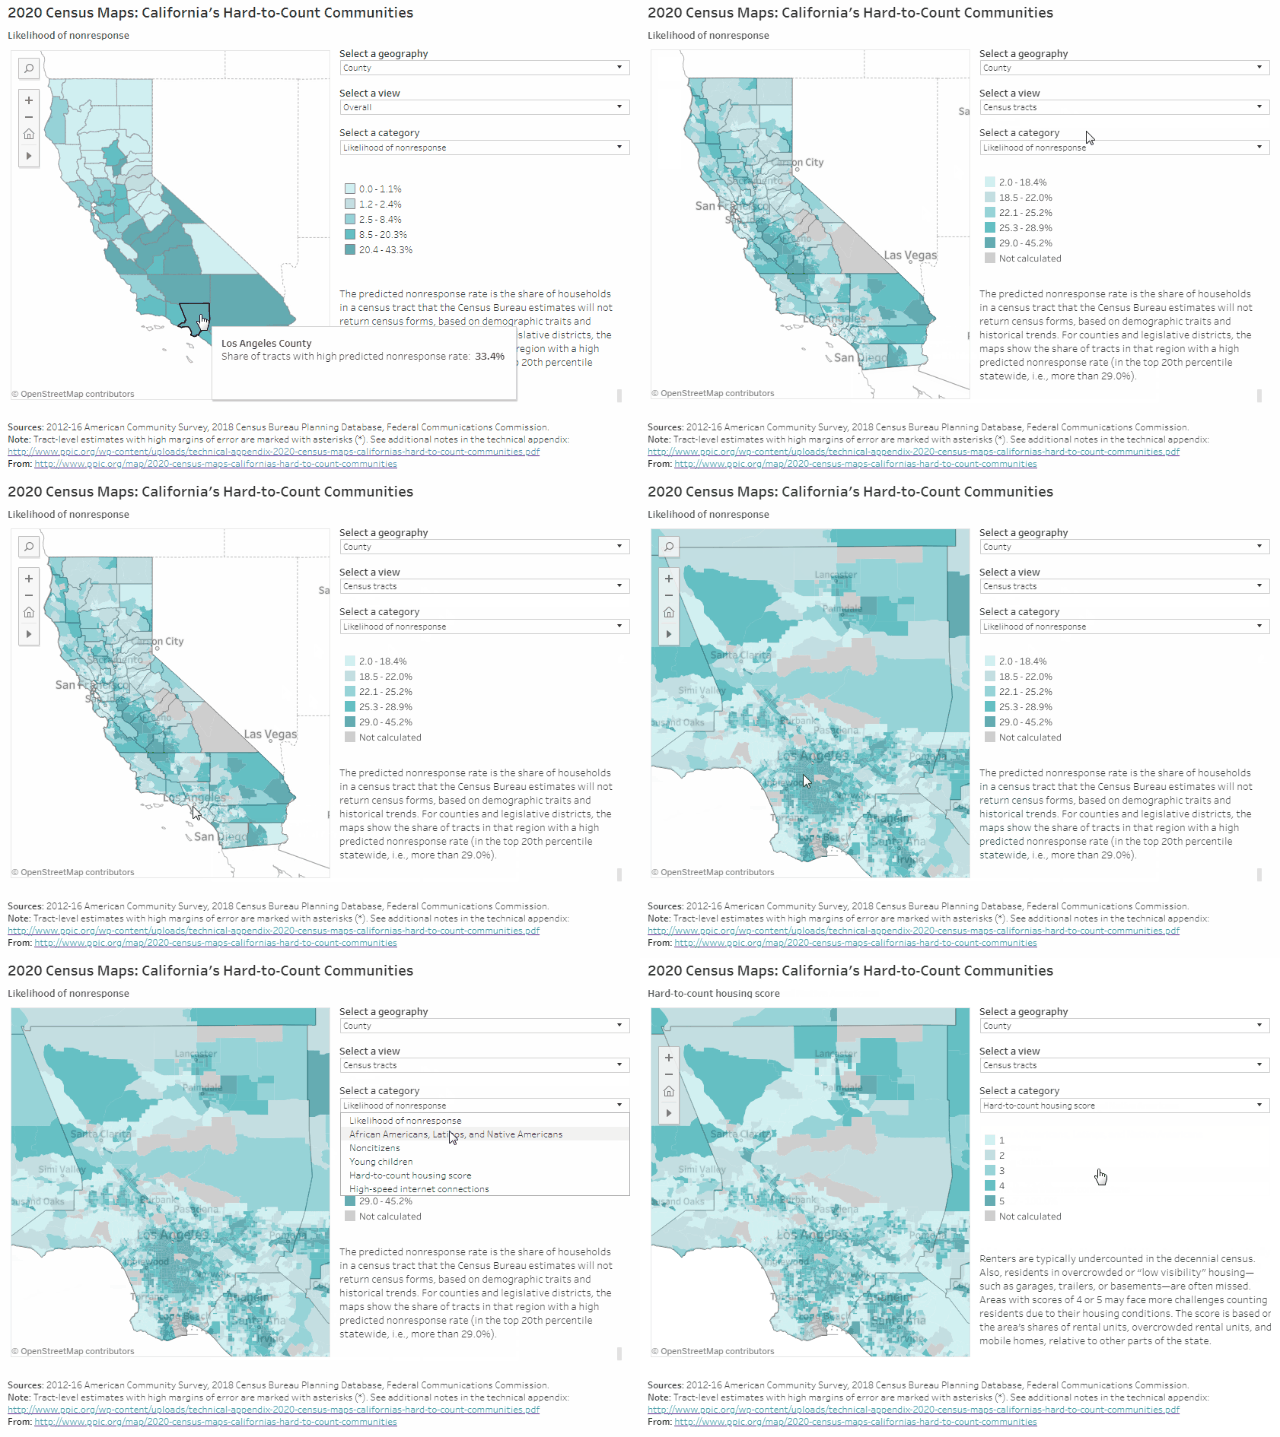
Home to about a fourth of the state’s population (10.3 million people), Los Angeles County may be one of California’s hardest-to-count regions in 2020. A third of the county’s census tracts are likely to be very hard to count, according to Census Bureau estimates that draw on local demographic characteristics (e.g., race/ethnicity, age, citizenship, and housing conditions) and historical trends. These areas tend to be concentrated in central and east LA south through Compton, as well as parts of Long Beach, the San Fernando and San Gabriel Valleys, Pomona, and Palmdale. Households in these very hard-to-count areas are less likely to respond initially to census forms and are therefore at risk of being undercounted.

Some highlights:

  • An undercount could reshape political representation in the region. Disproportionately undercounting parts of LA County could affect how district lines are redrawn after the census. Legislative districts in central and south LA have some of the highest concentrations of very hard-to-count communities in the state: In State Assembly District 59 (Jones-Sawyer), 96% of census tracts are considered very hard to count. In ten more legislative districts representing parts of central and south LA, over half of neighborhoods are considered very hard to count.
  • Undercounting people of color would dramatically misrepresent LA County’s urban core. About 57% of LA County residents are African American, Latino, or Native American—populations that have historically been undercounted in the census. In most central, south, and east LA neighborhoods, for example, African Americans and Latinos make up 80% to 100% of residents, compared with less than 15% in parts of nearby Beverly Hills and San Marino. If the 2020 Census again undercounts these groups, political representation could shift away from LA’s urban centers.
  • LA County’s hard-to-count housing is concentrated in communities of color. It can be difficult for the Census Bureau to accurately count people in rentals, overcrowded units, and mobile homes. Housing in LA County is among the hardest to count in the state. Moreover, in many neighborhoods with the hardest-to-count housing, nearly all residents are African American and/or Latino. Recognizing ways that hard-to-count communities intersect with each other will be important to conducting effective outreach to LA residents. In addition, reaching homeless Angelenos during the three-day window for counting people at shelters, tent camps, and other places will be critical to a complete and accurate count in the region.
  • Neighborhoods throughout the county have high shares of young children. In particular, east and south LA, as well as Lancaster and Palmdale, have larger concentrations of young children—who are typically undercounted in the census. In many of these neighborhoods, children under five years old make up more than 10% of residents, compared to less than 7% statewide.
  • Low responses from noncitizens would lead to a notable undercount in the region. Noncitizens may be less likely to respond to the 2020 Census due to the planned addition of a citizenship question and concerns about deportation and privacy. About 17% of LA County residents are noncitizens, compared to 14% statewide. In several neighborhoods in central and south LA, east LA, the San Fernando and San Gabriel Valleys, and Pomona, more than a quarter of residents are noncitizens.
  • The county has pockets of low internet access, including in the city of LA. The Census Bureau plans to collect the majority of responses online in 2020—a change from previous practice. Though urban areas generally have better internet access than rural areas do, a number of neighborhoods in central and south LA actually have fewer high-speed residential internet connections than the surrounding suburbs. The northeastern corner of the county also has lower levels of internet access. In these places, it may be harder to collect responses online, and participation will rely more heavily on in-person census takers or internet provided by local institutions.

We hope these maps serve as a starting point to help local, regional, and state leaders think about which activities, resources, and partnerships—including language assistance, awareness raising, and community outreach—might be most effective for accurately counting different parts of California. Stay tuned for more posts that examine hard-to-count communities in other regions of the state.

2020 Census: Counting the Bay Area

The decennial census plays an essential role in American democracy. Our series of blog posts examines what’s at stake for California and the challenges facing the 2020 Census, including communities that are at risk of being undercounted.  

PPIC’s interactive census maps are an important tool for Californians working to ensure an accurate census count. Using estimates from the Census Bureau and the Federal Communications Commission, they highlight hard-to-count communities across the state and pinpoint reasons why certain areas may be hard to reach.

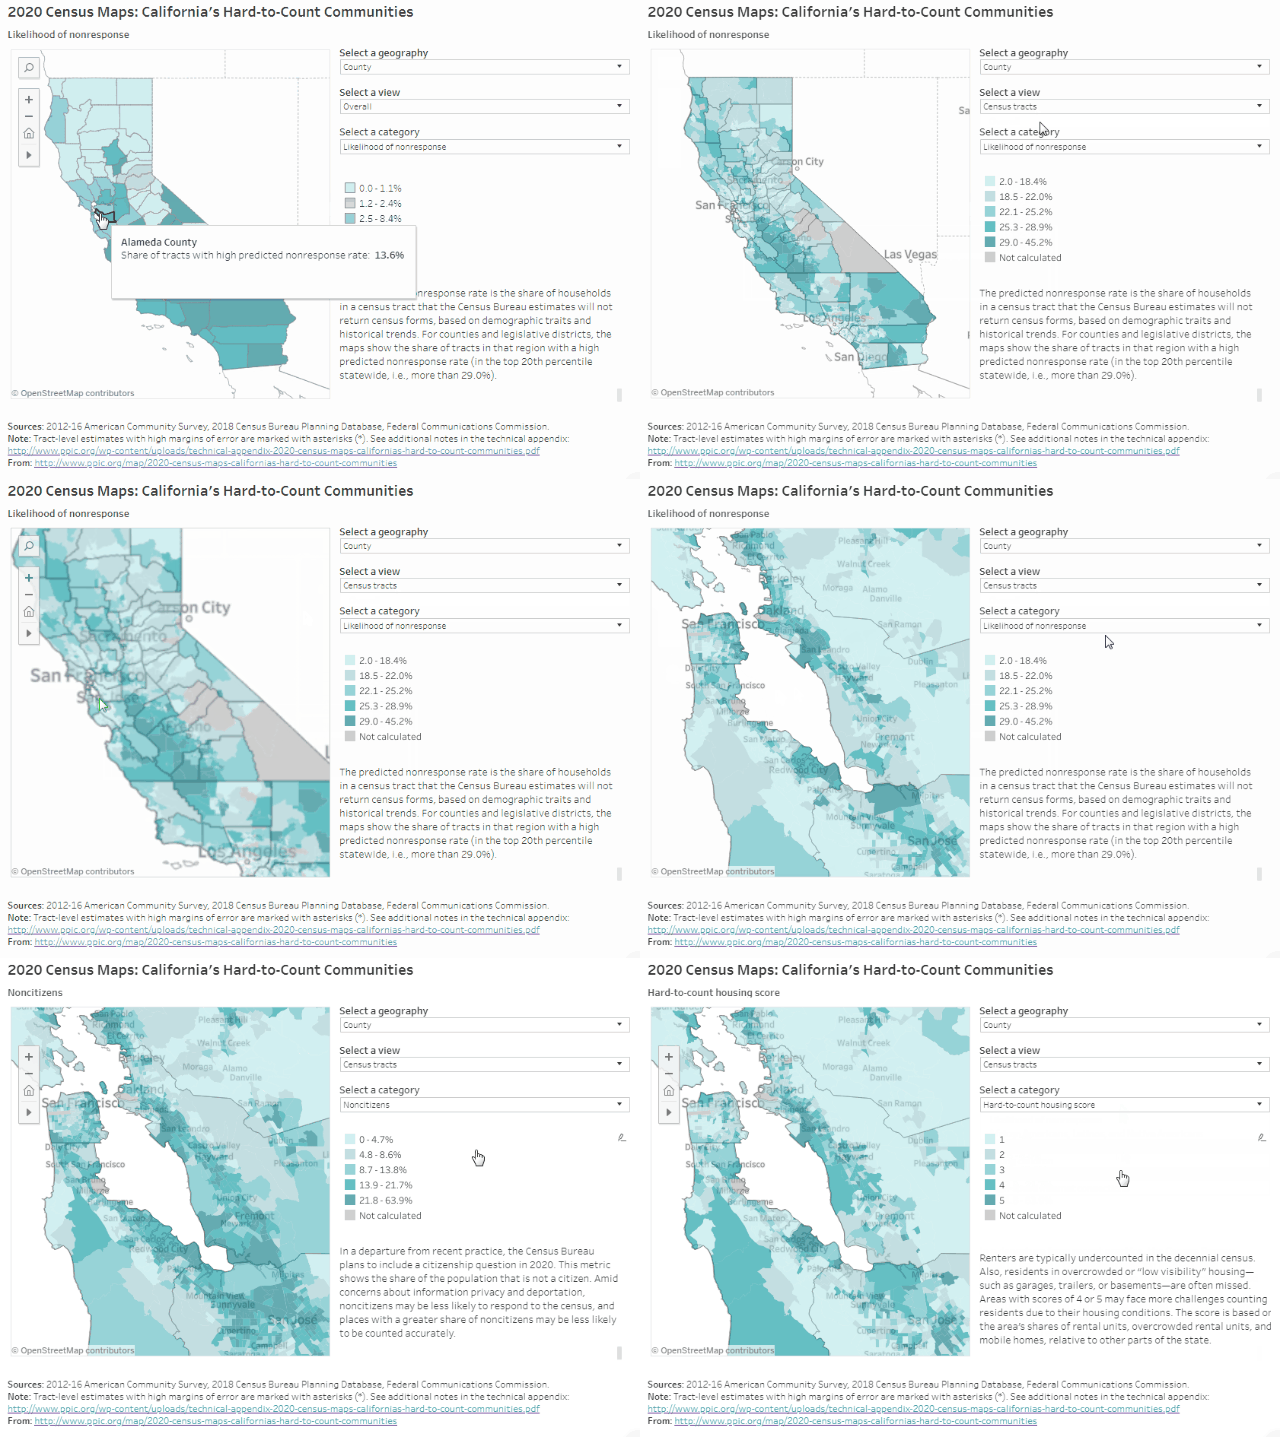
Home to about 20% of the state’s population—some 8 million people—the Bay Area has clusters of hard-to-reach places throughout the region. Of the 10 counties bordering the San Francisco, San Pablo, and Suisun Bays, including neighboring Santa Cruz County, Alameda has the highest share of very hard-to-count areas (14% of census tracts) and Napa the lowest (3%). Households in these very hard-to-count areas are less likely to respond initially to census forms and are therefore at risk of being undercounted, according to Census Bureau estimates that draw on historical trends and local demographic characteristics (e.g., race/ethnicity, age, citizenship, and housing conditions). Compared to some of California’s central and southern counties, the Bay Area has lower shares of very hard-to-count places, but there are still several areas of concern.

Some highlights:

  • East Bay legislative districts have the highest concentrations of very hard-to-count neighborhoods in the region. In three East Bay legislative districts, 20% or more of census tracts are considered very hard to count: Congressional District 13 (Lee), State Senate District 9 (Skinner), and State Assembly District 18 (Bonta). Each of these districts represents Oakland and other parts of the East Bay.
  • But there are hard-to-reach neighborhoods throughout the Bay Area. In addition to Oakland, residents in the East Bay cities of Richmond, Berkeley, and Hayward are likely to be hard to reach, with around 30% of households in many neighborhoods predicted not to respond initially to the census. In San Francisco, particularly hard-to-reach neighborhoods include SoMa, the Mission District, and Bayview/Hunters Point. Other cities with many hard-to-count census tracts include Santa Cruz, San Jose, East Palo Alto, and Redwood City on the Peninsula, and Antioch, Santa Rosa, and Vallejo in the North Bay. It is important to keep in mind that communities may be hard to count for multiple reasons.
  • Understanding local population trends can help guide effective outreach. Compared to the rest of the state, Bay Area counties tend to have lower-than-average shares of young children, African Americans, Latinos, and Native Americans—populations that are typically undercounted in the census. Nevertheless, many neighborhoods have relatively high concentrations of young children and people of color—and are still at risk of being undercounted. For example, undercounting people of color in 2020 could significantly misrepresent communities in Richmond, Oakland, East Palo Alto, and Bayview/Hunters Point.
  • Low responses from noncitizens could lead to an undercount, especially in the South Bay.
    Noncitizens may be less likely to respond to the 2020 Census due to the planned addition of a citizenship question and concerns about deportation and privacy. Nearly 18% of people in Santa Clara County are noncitizens, compared to just under 14% statewide. Noncitizens make up about 15% of residents in Alameda and San Mateo Counties as well. In many neighborhoods—including parts of Fremont, Sunnyvale, Cupertino, and Redwood City—more than 30% of residents are noncitizens.
  • Housing conditions may make some Bay Area residents particularly hard to reach. Several neighborhoods in the East Bay, San Jose, Redwood City, and Santa Cruz have relatively large shares of housing units that are rentals, overcrowded rentals, and/or mobile homes—a reflection of how residents are coping with some of the most expensive housing markets in the country. These conditions can make it harder for the Census Bureau to find and count residents. In some parts of San Jose, for example, one in four rentals is overcrowded. Reaching homeless residents during the three-day window for counting people at shelters, tent camps, and other places will also be critical to an accurate count in the region.

We hope these maps serve as a starting point to help local, regional, and state leaders think about which activities, resources, and partnerships—including language assistance, awareness raising, and community outreach—might be most effective for accurately counting different parts of California. Stay tuned for more posts that examine hard-to-count communities in other regions of the state.


Could Wildfires Affect the 2020 Census?

The decennial census plays an essential role in American democracy. The stakes are huge for California, and 2020 is fast approaching. This series of blog posts takes a detailed look at California communities that may be at risk of being undercounted.

Wildfires in California have burned millions of acres and destroyed or threatened thousands of homes, displacing families around the state. Among their many devastating long-term effects, disasters may elevate the risk of undercounting some communities in the upcoming census.

The Census Bureau’s goal is to “count everyone, only once, and in the right place.” In practice, this means that people are counted where they reside as of “Census Day” (April 1, 2020), even if this is not their permanent residence. Given that Californians who lose their homes in disasters must then find housing in a notoriously difficult market, housing conditions alone could pose a hurdle to accurately counting communities that have been displaced by wildfires.

Hurricane Katrina presented similar issues for the 2010 Census. While some people displaced from the Gulf Coast moved away permanently, many others were counted in counties or states they intended to leave once their homes were again habitable. Still others stayed in accommodations closer to home, which—depending on resources—were sometimes shared, non-standard, or even not yet considered habitable. These families proved difficult to reach by mail, with just 45% of New Orleans households returning forms at first (compared with 61% in 2000). On-the-ground staff were ultimately responsible for hand-delivering questionnaires to the majority of New Orleans homes. Even though the Census Bureau can request a funding contingency for such costly efforts, it will have many competing demands for resources in 2020.

In the aftermath of California’s recent fires, local areas face unique challenges to getting an accurate census count—particularly in terms of housing. Here we look at three of those areas across the state. Current estimates show that 20,000 residents were affected by the Carr fire (Redding, 2018) and that the Thomas fire (Ventura County, 2017) and the Tubbs fire (Santa Rosa, 2017) each affected about 40,000 residents. Before the fires, none of these areas stood out in terms of having large populations of hard-to-count residents, but the loss of housing could create new obstacles.

Even in normal times, housing plays a key role in getting an accurate census count. Rental units and mobile homes are less likely to appear on official census address lists. Moreover, their residents tend to move more often, making them hard to reach. Wildfire displacement heightens these challenges, especially in places where housing was already hard to count. For example, mobile homes made up 6% of housing in the Thomas fire area—double the statewide average. In the Carr fire area, they constituted 10%.

Before the fires, the share of renters in all three fire areas was lower than the statewide share, but the loss of homes likely changed this picture. CalFire reports that the Thomas fire destroyed 775 homes—and subsequent mudslides in the area demolished at least another 100. The Carr fire destroyed 1,079 homes, and the Tubbs fire razed 3,000. Displaced residents are more likely to rent, reside in non-standard arrangements, and/or struggle with poverty, creating new challenges for the census count.

Blog figure: Housing conditions in fire zones varied widely

In 2020, given the likelihood that families will continue to be displaced by wildfires or other natural disasters, it will be important for state and local leaders to coordinate with the Census Bureau to ensure that all Californians are counted accurately—regardless of their housing situation. For more on areas with hard-to-count housing and other challenges, visit PPIC’s interactive census maps.

2020 Census: Counting the Inland Empire

The decennial census plays an essential role in American democracy. The stakes are huge for California, and 2020 is fast approaching. This series of blog posts takes a detailed look at California communities that may be at risk of being undercounted.

PPIC’s interactive census maps are an important tool for Californians working to ensure an accurate census count. Using estimates from the Census Bureau and the Federal Communications Commission, they highlight hard-to-count communities across the state and pinpoint reasons why certain areas may be hard to reach.

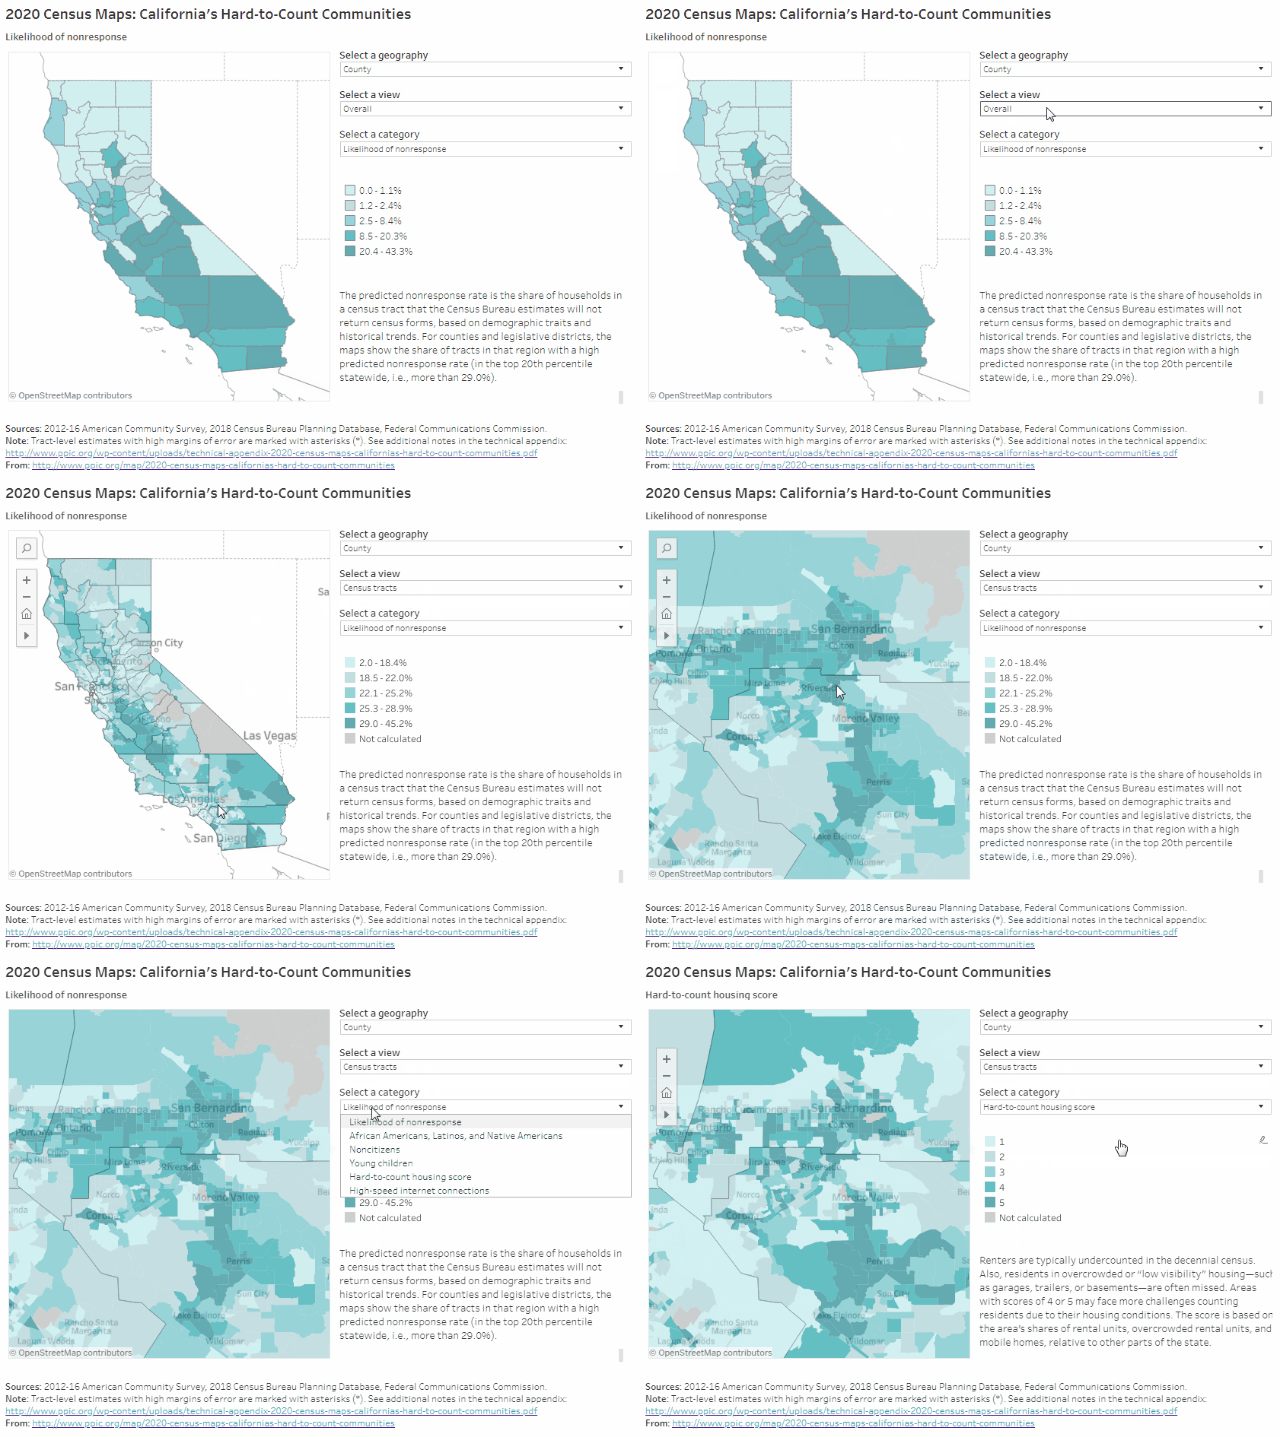
The Inland Empire is home to more than 4.5 million Californians (over 11% of the state’s population). About 29% of census tracts in San Bernardino County are likely to be very hard to count, compared to 17% in Riverside County, according to Census Bureau estimates that draw on demographic characteristics and historical trends. Households in these very hard-to-count areas are less likely to respond initially to census forms and are therefore at risk of being undercounted. Many hard-to-reach census tracts are clustered in and around the San Bernardino–Riverside metro area, including the neighboring cities of Moreno Valley and Ontario.

Some highlights:

  • Very hard-to-count communities in the Inland Empire tend to be concentrated in urban legislative districts. Since legislative district lines will be redrawn based on the census, disproportionately undercounting parts of the Inland Empire could affect the region’s political representation. For example, in Congressional Districts 31 (Aguilar) and 35 (Torres), more than 30% of census tracts are likely to be very hard to count. The same is true for State Senate District 20 (Leyva) and State Assembly Districts 40 (Steinorth), 47 (Reyes), and 52 (Rodriguez).
  • Undercounting people of color could disproportionately affect the Inland Empire. African Americans, Latinos, and Native Americans tend to be undercounted in the census. These groups make up more than half of the population in the Inland Empire—54% in Riverside County and 60% in San Bernardino County—compared to 45% statewide. In metro areas, over 80% of residents in many neighborhoods are people of color. The Inland Empire also includes several tribal reservations, such as those southeast of Coachella and northwest of Palm Springs.
  • Parts of the Inland Empire have particularly high shares of young children. Young children are historically underrepresented in the census. Riverside and San Bernardino Counties have relatively high percentages of young children (6.8% and 7.3%, respectively) compared to the state as a whole (6.5%). Certain areas have even higher concentrations of families with young children: children under five years old make up between 9% and 11% of the population around Victorville, in western San Bernardino County, and the same is true for numerous census tracts around the city of San Bernardino.
  • Communities can be hard to count for multiple reasons. Housing conditions (high shares of rentals, overcrowded rental units, and mobile homes) may make it more difficult to count residents accurately. There is hard-to-count housing throughout the Inland Empire, with pockets in metro areas, south of Moreno Valley, and in the rural eastern parts of the region. Residents may also be hard to count for other reasons. For example, in some areas with hard-to-count housing, many residents are noncitizens—who may be less likely to respond in 2020 due to the planned addition of a citizenship question. Recognizing ways that hard-to-count communities intersect with each other will be critical to conducting effective outreach to Inland Empire residents.
  • Rural areas tend to have lower internet access, as do some urban neighborhoods. The US Census Bureau plans to collect the majority of responses online in 2020—a change from previous practice. The eastern, rural parts of the Inland Empire have low levels of residential high-speed internet access and therefore may face more challenges responding to the census online. We also see lower levels of access in the city of San Bernardino and Moreno Valley relative to surrounding areas. It’s important to note that people may still have internet access through smartphones, public libraries, or other services.

We hope these maps serve as a starting point to help local, regional, and state leaders think about which activities, resources, and partnerships—including language assistance, awareness raising, and community outreach—might be most effective for accurately counting different parts of California. Stay tuned for future posts that examine hard-to-count communities in other regions of the state.

2020 Census: Counting the San Joaquin Valley

The decennial census plays an essential role in American democracy. The stakes are huge for California, and 2020 is fast approaching. This series of blog posts takes a detailed look at California communities that may be at risk of being undercounted.

PPIC’s new interactive census maps are an important tool for Californians working to ensure an accurate census count. Using estimates from the Census Bureau and the Federal Communications Commission, they highlight hard-to-count communities across the state and pinpoint reasons why certain areas may be hard to reach.

Home to 4.3 million people, the San Joaquin Valley may be one of California’s hardest-to-count regions in 2020. Encompassing about 11% of the state’s population, the valley runs south from San Joaquin County through Stanislaus, Merced, Madera, Fresno, Tulare, Kings, and Kern Counties. Most of the communities at risk of being undercounted in the region live south of Stanislaus County through Kern County. For example, 33% of census tracts in Fresno County are likely to be very hard to count, according to Census Bureau estimates that draw on demographic characteristics and historical trends. But only 7% of tracts in Stanislaus are very hard to count. Households in these very hard-to-count areas are less likely to respond initially to census forms and are therefore at risk of being undercounted.

Some highlights:

  • An undercount could reshape the legislative landscape of the San Joaquin Valley. Since legislative district lines will be redrawn based on the census, disproportionately undercounting parts of the San Joaquin Valley could reshape the region’s political representation. And while hard-to-count communities are distributed across several counties in the region, they are concentrated in fewer legislative districts. In Congressional Districts 16 (Costa) and 21 (Valadao), for example, about 42% of census tracts are likely to be very hard to count. Undercounting could also affect the northern San Joaquin Valley, which has hard-to-reach areas despite having fewer historically undercounted populations.
  • Undercounting people of color and noncitizens could disproportionately affect legislative districts in the central and southern San Joaquin Valley. This area has particularly high shares of groups that tend to be undercounted in the census—African Americans, Latinos, and Native Americans, as well as noncitizens, who may be even less likely to respond in 2020 due to the planned addition of a citizenship question. A total of six legislative districts have populations that are at least 65% African American, Latino, or Native American and at least 15% noncitizen: Congressional Districts 16 and 21; State Senate Districts 12 (Cannella) and 14 (Vidak); and State Assembly Districts 31 (Arambula) and 32 (Salas).
  • Another factor driving the San Joaquin Valley’s overall risk of being undercounted is the high share of young children. Young children are historically underrepresented in the census. There are particularly high concentrations of families with young children in the central and southern San Joaquin Valley: children under 5 years old make up 8% or more of the population in Fresno, Kern, Kings, Merced, and Tulare Counties—among the highest concentration in the state.
  • Housing conditions may make an accurate count especially challenging in the western San Joaquin Valley. In this area, relatively large shares of housing units are rentals, overcrowded rentals, and/or mobile homes—all of which can make residents harder to find and count accurately. For example, more than 20% of households live in mobile homes in some northwestern parts of San Joaquin County and some southwestern parts of Tulare County.
  • Limited internet access may be an issue in certain areas throughout the region. The Census Bureau plans to collect the majority of responses online in 2020—a change from previous practice. Each county in the San Joaquin Valley has some census tracts with minimal residential high-speed connectivity, with the lowest access outside cities. While people in these areas may have internet access through smartphones or public libraries, in general they may have more trouble accessing the census online.

We hope these maps serve as a starting point to help local, regional, and state leaders think about which activities, resources, and partnerships—including language assistance, awareness raising, and community outreach—might be most effective for accurately counting different parts of California. Stay tuned for future posts that examine hard-to-count communities in other regions of the state.
Video: 2020 Census: Why Is the Citizenship Question Such a Big Deal?

The decennial census plays an essential role in American democracy. The stakes are huge for California—and 2020 is fast approaching.

In this video, PPIC research fellow Eric McGhee discusses the controversial addition of a citizenship question to the 2020 Census. View more videos in this series.