What’s Next for Legalized Marijuana?

The morning after Election Day, California appeared to be on a very different path than much of the nation. But in voting to legalize recreational marijuana, Californians were very much in step with the rest of the country. In addition to California’s Proposition 64—which passed relatively easily, with 56% of the vote—measures were passed in Nevada and Massachusetts that legalized recreational marijuana. Measures that legalized or expanded medical marijuana passed in Florida, Arkansas, North Dakota, and Montana. So far, Arizona is the only state to have rejected a recreational marijuana measure. Maine also passed a measure legalizing recreational use, though the vote was close and is subject to a recount.

While marijuana remains illegal under federal law and continues to be classified as a Schedule I drug (meaning it has a high risk for abuse and has no accepted medical value), 63% of Americans now reside in states that have medical or full legalized use, including 21% with legalized recreational use.

Now comes the difficult part. Proposition 64 sets in motion a number of steps and procedures designed to create a regulated market for recreational marijuana. Many of these can be modeled on last year’s legislation regulating California’s medical marijuana market. And the states that have legalized marijuana so far have created a competitive but regulated market structure. But regulatory experience—in California and other states—is in short supply. As one state regulator opined at a recent PPIC event, “Right now, science is lagging policy.”

Marijuana regulation cuts across many areas. Earlier this year, we outlined several key regulatory areas, including cultivation, production, and processing; sales, consumption, and possession; taxes and finance; and public health and safety. The challenge facing California and other states is to implement regulations that can achieve multiple, sometimes conflicting policy goals: limiting the impact of the illegal market, preventing youth drug use, reducing harm to public health and safety, preventing diversion of legal marijuana into illegal markets, and raising revenue. This requires a comprehensive regulatory approach that would document and control the cultivation, production, processing, and sale of legal marijuana.

Our report recommended that California err on the side of caution and adopt a relatively restrictive regulatory model for both the recreational and medical markets. We still maintain that a tight, single market will make marijuana laws easier to enforce and reduce diversion to under-age Californians and to other states. To be sure, a highly regulated legal market will be accompanied by a robust illegal market. But it will be easier to loosen a tight market than to tighten a loose one.

Given the apparent national interest in legalizing marijuana—and the lack of knowledge about this new industry—California is positioned to be a leader in answering difficult questions about how best to regulate it. To play a leadership role, California regulators should collect data on marijuana sales, prices, revenue, and use. Basic market information would play a significant role in closing this knowledge gap and inform better future policy for both our state, and the rest of the country.

Finally, we should note that there is some uncertainty about the future of marijuana regulation across the country. As noted above, federal law still classifies marijuana as an illegal substance. The relatively benign approach that the federal government has taken to enforcing federal law regarding marijuana has been based on three memos written by second-tier cabinet members and some language in an annual appropriation bill. Though President-elect Trump has not explicitly stated his policy on marijuana, it would be relatively simple for the new administration to alter the current federal approach.

Learn more

Read the report Regulating Marijuana in California

California Is Different

Mark Baldassare, PPIC president and CEO and director of the PPIC Statewide Survey, spoke to the Sacramento Press Club today (November 16, 2016). Here are his prepared remarks before a post-election discussion with Mark DiCamillo, senior vice president of Field Research Corporation and director of the Field Poll.

With the stunning victory of Donald Trump in the presidential election, it is easy to overlook the significance of the California vote. The political experience here was starkly different from the US in ways that went beyond our normal “blue state” election performance. I’m going to focus on election and polling trends that caught my attention—including citizen engagement, presidential preference, the state ballot measures, the role of government, and voter turnout. My colleague Eric McGhee has an excellent analysis of the top-two legislative races in another PPIC blog post. I’ll close with a look toward next year and the 2018 California election in light of the changing political landscape in California and the US.

Citizen engagement. The California voter rolls grew by 2.15 million in 2016 to reach a historic high of 19.4 million before the November 8 election. According to the California Secretary of State, the voter registration surge was largely a Democratic Party phenomenon, resulting in a 19-point gap between the Democrats and Republicans (45% to 26%)—the largest since 1976. Clearly, online registration and social media brought in new voters. But Hillary Clinton, Bernie Sanders, and Donald Trump shaped those voters’ party choices. One of the Republican candidate’s main messages—on immigration—simply did not resonate here. The 2016 PPIC Statewide Surveys consistently found that most Californians viewed immigrants as a benefit, favored a path to citizenship for undocumented immigrants, and opposed building a wall on the US–Mexico border.

Presidential preference. Democrat Hillary Clinton is currently defeating Republican Donald Trump by a 29-point margin in California. Clinton’s margin is higher than President Barack Obama’s in 2008 (+24) and 2012 (+23), while Trump’s support (33%) is lower than every Republican presidential candidate since 1992. Clinton is running up big margins in Los Angeles and the San Francisco Bay Area, while Trump is running behind even in Republican-leaning Orange County and “purple” areas of the state such as Fresno, Riverside, San Bernardino, and San Diego Counties. This was occurring in California even as blue areas turned red in the nation’s swing states. The margin for the presidential race in the October PPIC survey was 26 points, indicating that polls were accurate in accounting for Trump and Clinton supporters here.

State ballot measures. California also distinguished itself from the rest of the nation by asking voters to be the deciders on 17 state propositions. The September PPIC survey found satisfaction with the initiative process but unhappiness with the scale and complexity of state measures, and the oversized role of special interests in the process. Would voters just say no to all measures or skip this portion of the ballot? They did neither. They are currently approving 12 of the 17 state propositions and, in saying yes to at least 9 of the 14 citizens’ initiatives, exceeding the historical pass rate. Apparently, and in line with PPIC reports, California voters are up to the challenge of making policy at the ballot box.

Role of government. The big surprise in the 2016 California election is a sea change in voter preferences for the role of government. Californians reversed course in terms of their own previous decisions and stood apart from a number of national trends.

  • Californians passed both a cigarette tax increase (64%, Proposition 56) and marijuana legalization (56%, Proposition 64), both of which failed at the ballot earlier.
  • Years after they instituted a tough-on-crime three strikes law and mandated that schools teach only in English, the state’s voters passed criminal sentencing reform (64%, Proposition 57) and bilingual education (73%, Proposition 58).
  • While second-amendment rights were a litmus test for presidential candidates in other states, Californians expanded firearms restrictions (63%, Proposition 63).
  • Voters may be known for their distrust in state government, but they endorsed the plastic bag ban that was passed earlier by the legislature, at the same time reinforcing their “green” credentials (53%, Proposition 67).
  • Californians showed a generous streak by passing state school bonds (54%, Proposition 51), Medi-Cal funding (70%, Proposition 52), and a tax extension (62%, Proposition 55).

Notably, voter support for tax and spending propositions that we tracked in the September and October surveys were both stable and close to the election results, indicating that opinions were unmoved by the “no” campaigns. “Calexit” has become shorthand for the idea of California leaving the US. Instead, it may end up referring to Californians leaving behind the tax revolt that started here.

Voter turnout. The California Secretary of State is reporting a record-setting 15.18 million counted and unprocessed ballots in the November election. This vote count also reflects gains in the turnout among registered voters and eligible adults compared to the 2012 presidential election. Turnout rates were somewhat higher in the 2008 election. The October PPIC survey showed a high level of interest in the presidential election, and California seems to have bucked the national trend of depressed turnout. Still, only about half of the approximately 30 million California adults voted in this election. As noted in a recent PPIC report, nonvoters are mostly Latino, immigrants, lower-income, and young adults. In other words, those who don’t vote are among the most affected by changes in the role of government.

The voters have spoken and the awkward result is a conflicting policy agenda for the state government and the federal government. How will Governor Brown and the state legislature respond when the Republican president and US Congress shift gears on immigration, the Affordable Care Act, climate change, and abortion rights policies favored by California residents?

As the priorities, plans, and programs of the new president and Congress take shape, the mission of the PPIC Statewide Survey—­­to provide a voice for both adults and likely voters—takes on even greater importance.

And as we look further ahead, the next California governor will play a challenging role in managing the federal and state relationship. PPIC will invite the 2018 gubernatorial candidates to public forums next year to learn what we can about their leadership style and their vision for the state’s future in the changing political landscape in California and the US.

The Top-Two System and Election 2016

This election marked the third outing for the state’s “top two” primary system. The system allows voters to choose any candidate they like in the primary, with the top two vote getters advancing to the fall. One of the reform’s major goals is to promote moderation by removing the partisan barriers that structure candidate and voter choices. What has this election suggested about the reform?

The two candidates who advance to the fall election can be—and often are—from the same party. The most visible example this year was the US Senate race between Democrats Kamala Harris and Loretta Sanchez. It was the first statewide same-party race, and many did not know what to expect. Of the two candidates, Kamala Harris was seen as a traditional liberal Democrat, while Loretta Sanchez made more efforts to appeal to Republicans. In the end, Kamala Harris won by a wide margin—mirroring the substantial margins in most public opinion polls. Polling had also suggested that between a third and half of Republicans were likely to opt out of casting a ballot in this race. At the time of this writing, about 1.1 million more ballots have been cast for president than for US Senate, a number roughly consistent with these polling estimates.

There were also 27 down-ballot same-party races in this cycle, in line with 25 in 2014 and 28 in 2012. These races continue to be a lot closer than cross-party contests: this year, an average of 32 points separated the candidates in cross-party races, compared to 25 points for candidates of the same party. About a quarter of this year’s same-party races were decided by less than 10 points, also similar to previous years.

At the same time, the share of cross-party races decided by narrow margins has been falling over time—from 18% in 2012 to 15% in 2014 to just 11% this year—and is rapidly approaching the average share during the previous redistricting cycle (7%). This most likely reflects the aging of the redistricting plan, which was drawn by an independent commission in 2011. At the beginning the plan was very disruptive to established patterns, but as candidates have come to understand which seats are likely to be competitive and which are a stretch, the level of cross-party competition overall has declined.

Establishment candidates did well this year, as they have on average under the top-two reform. Just 6 out of 123 incumbents lost, and the average margin of victory for incumbents was the same as before the reform. This is not to say that the top-two primary has not altered the playing field in some cases. In fact, three of the six losing incumbents ran in same-party races. But the broader field of play is similar to the past.

Same-party races were in part expected to promote contests between the moderate and liberal/conservative wings of each party. It is not clear that this has happened much on the Republican side, but there are typically several same-party contests that feature this dynamic on the Democratic side. In this election cycle, most of these contests were won by the more moderate, business-backed Democrat. Nonetheless, in at least two cases—Raul Bocanegra vs. Patty Lopez in Assembly District 39 (San Fernando Valley) and Eloise Reyes vs. Cheryl Brown in Assembly District 47 (San Bernardino County)—a less traditional Democratic incumbent lost to a more traditional Democratic challenger (Bocanegra was technically a challenger, but he was also a former incumbent).

In short, this year’s top-two outcomes mostly fit the post-reform pattern, but there were some interesting deviations. It is still early in this reform’s life, so it will be important to keep monitoring it to understand how it unfolds.

Video: The Mood Before Election Day

The final PPIC Statewide Survey before the November election found Hillary Clinton leading Donald Trump by 26 points among California likely voters and Kamala Harris leading Loretta Sanchez by 22 points. It also found that majorities support measures to extend a tax increase on high incomes, increase cigarette taxes, and legalize marijuana. Research associate David Kordus presented these and other key findings at a briefing in Sacramento last week.

The survey also examined issues that are likely to linger past Election Day. It finds that Californians are divided on the direction of the state. Majorities say the nation is going in the wrong direction, and they express low levels of trust in the federal government. And most Californians say the two major political parties do such a poor job that a third major party is needed.

Learn more

Read the October PPIC Statewide Survey: Californians and Their Government
Visit the PPIC Statewide Survey website

Changing Attitudes toward Marijuana Legalization

Six years ago, a California ballot initiative to legalize marijuana for recreational use fell short of a majority—46.5% voted yes. This November, Californians will vote on Proposition 64, another marijuana legalization initiative. Since the 2010 election, four other states and the District of Columbia have legalized marijuana for recreational use, and, in California, the PPIC Statewide Survey series has found increased support for legalization among likely voters and within some key groups.

In our September survey, after hearing the Proposition 64 ballot title and label, 60% of California likely voters said they would vote yes. That includes strong majorities of Democrats and independents and nearly half of Republicans.

  • Support has increased among likely voters. In response to a separate, more general question, a similar share (61%) of likely voters said that they think marijuana use should be legal. That’s a 10 point increase in support for legalization in general since September 2010, when about half of likely voters said they were in favor.
  • The partisan divide has narrowed. We have consistently found support for legalization in general to be lower among Republican likely voters than among Democrats or independents, but the gap is somewhat narrower today than it was in 2010. Then as now, at least 60% of Democratic and independent likely voters supported legalization. Among Republicans, though, support has increased from 32% in September 2010 to 45% in September of this year.
  • Support has grown among older Californians. Today, nearly three-fourths of California likely voters under age 35 favor legalization, and they are more likely than older Californians to do so—a pattern that has held since 2010. But support for marijuana legalization has increased among older Californians over the past six years. Today, nearly two-thirds of likely voters age 35 to 54 support legalization, compared to about half in 2010. A slight majority of likely voters age 55 and over are in favor today, while fewer than half favored it in 2010.

As with any election outcome, much will depend on who turns out to vote. Based on past election cycles, we can expect a larger—and younger—electorate in this presidential election year than we saw in the midterm election year of 2010. It remains to be seen, though, if Californians’ changing attitudes toward marijuana legalization will be reflected in the vote on Proposition 64.

Learn more

Read the September PPIC Statewide Survey
Visit the PPIC Statewide Survey website

The End of the Post-Partisan Era?

Last week, a press release from the California Secretary of State touted the record number of 18.2 million California registered voters as a “major milestone.” The new numbers are impressive, but it’s also worth noting that California’s voter registration is in line with its current population trends. Both the number of registered voters and the number of adults who are eligible to vote have increased by about 1 million since September 2012.

What struck me as most significant about the September report—and what went largely without mention in the scant media coverage—is that a partisan shift that has been under way for several years has accelerated during the 2016 presidential election.

In 2004, a year after the recall of California governor Gray Davis, a Democrat, and the election of Republican Arnold Schwarzenegger, there was an 8 point gap between Democratic and Republican registration (43% to 35%). In the 2006 general election, Governor Schwarzenegger was reelected and one other Republican won a statewide race (Steve Poizner for insurance commissioner). In other words, California was a Democratic-leaning state but Republicans could eke out a statewide victory, depending on the partisan turnout and candidates.

When Democrat Barack Obama was running for president in the fall of 2008, the gap between Democratic and Republican registration was 12 points (44% to 32%). During President Obama’s reelection campaign in the fall of 2012, there was similar registration gap between Democrats and Republicans (43% to 30%). Between 2004 and 2012, the Republicans lost about a quarter of a million voters and the Democrats gained about three-quarters of a million voters. The biggest registration increase was among independent (or decline-to-state) voters, whose number grew by a million. With many new voters eschewing party membership, California seemed to be entering a “post-partisan” era. Still, with a double-digit lead in voter registration, Democratic candidates defeated Republicans in all statewide races in 2008, 2010, 2012, and 2014.

This September, the Democratic-Republican registration gap swelled to 18 points (45% to 27%). In a departure from recent trends, Democratic registration saw larger gains than independent registration over the past four years. Moreover, comparing the Secretary of State’s report for January 2016 with the September report, the biggest gain by far was in Democratic registration. This coincides with high interest in the Democratic primary between Bernie Sanders and Hillary Clinton and the unconventional candidacy of Republican Donald Trump. Is this a blip or does it signal the end of the post-partisan era? The Secretary of State’s report after the October 24 voter registration deadline will allow us to track registration trends amid debates, campaigning, and candidate news.
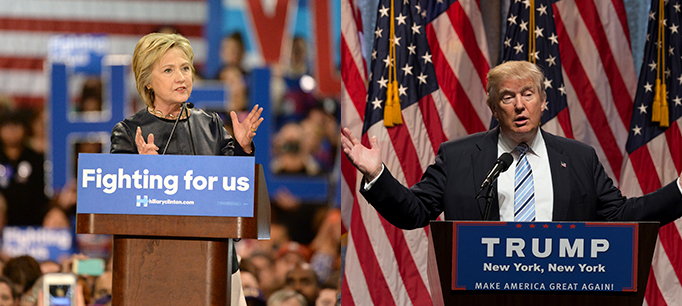
The growing partisan gap raises many questions. Since it’s easier to register than to vote, will new voters cast ballots this fall? With the latest PPIC Survey indicating a lack of competitive statewide races, will the growing Democratic advantage help to pass state propositions on taxes, corrections reform, and marijuana legalization? Will it allow the Democrats to reach their goal of a two-thirds majority in the state legislature? Looking beyond the 2016 election, the voter registration gap could have implications for the future of the Republican Party, the top-two primary, and California’s democracy.

Declining Satisfaction with Presidential Candidates

Satisfaction with the choice of presidential candidates is low—considerably lower than in the 2008 and 2012 elections, our most recent survey shows.

Unlike 2012—when satisfaction with the choice of candidates increased as the election approached—satisfaction has been declining. This is not a view unique to California. A recent report by the Pew Research Center found that only 33% of registered voters nationwide were very or fairly satisfied with the choices of presidential candidates.

Compared with the last two presidential elections, satisfaction with candidate choices is down by more than 20 percentage points among California Democratic, Republican, and independent likely voters. Indeed, today only 28% of California’s independent likely voters are satisfied with their choice of candidates.

Among California likely voters, supporters of Hillary Clinton and Donald Trump are equally likely to say they are not satisfied with the choices of presidential candidates—48% of Clinton supporters and 49% of Trump supporters express this view.

Who are these unsatisfied supporters? Notably, 30% of unsatisfied Clinton supporters are between 18 and 34 years old.

Among Trump supporters, there is a difference when it comes to views on immigration policy. Unsatisfied Trump supporters are much more likely than satisfied supporters to say that undocumented immigrants should be allowed to stay in the country legally if certain requirements are met (59% to 43%).

These low levels of satisfaction with the candidates could have repercussions on voter turnout in California. We will have to wait and see if the two remaining debates make voters feel more satisfied with the choices before them or if they choose to voice their dissatisfaction by avoiding the ballot box.

Learn more

Read the September PPIC Statewide Survey: Californians and Their Government
Visit the PPIC Statewide Survey

Video: A High-Interest Election

By many measures, this is an unusual election year. In the presidential race between a businessman/reality TV star and the first woman nominated by a major party, most likely voters have made up their minds, the latest PPIC Statewide Survey shows. Yet interest in the election is high and satisfaction with the choice of candidates is low.

Two candidates from the same party are vying for an open US Senate for the first time since the state adopted the top-two primary system. About a quarter of likely voters say they won’t vote for either Democrat, and 19 percent are still undecided.

These are just two of the consequential choices Californians are being asked to make. There are 17 statewide initiatives on the ballot and in many communities, a number of local measures.

This all adds up to an election worth watching.

Dean Bonner, associate survey director, presented key findings from the survey to a Sacramento audience last week.

Commentary: Coping with 17 State Ballot Propositions


This commentary was published in the Los Angeles Times today. Thursday, August 18, 2016.

This fall, Californians will face the daunting task of determining the fate of 17 state propositions. Local ballots will add their own initiatives to this burden. It’s been a dozen years since a ballot was as challenging. How will voters respond?

Read the full commentary on latimes.com.

Learn more

PPIC Statewide Survey: Californians and Their Government (May 2016) 

Video: Assessing California’s Global Warming Law

Ten years ago, California enacted a law to combat global warming that set an ambitious goal: reducing greenhouse gas emissions to 1990 levels by 2020. Today, the state is poised to reach this target, and policymakers are discussing aiming for a new one.

Each year since the law—AB 32—took effect, the PPIC Statewide Survey has examined Californians’ views on climate change and the state’s actions to address it. The survey has consistently found that most Californians believe that the effects of global warming have begun and that majorities support the state taking action to address it.

But a partisan split has emerged since the law took effect. AB 32’s goals no longer have the bipartisan support they did in 2006. Today, Democrats and independents are much more likely than Republicans to support the goals of AB 32. This divide is reflected in a number of findings in the 2016 Californians and the Environment Survey.

Research associate David Kordus presented the survey at a briefing in Sacramento last week.