Declining Satisfaction with Presidential Candidates

Satisfaction with the choice of presidential candidates is low—considerably lower than in the 2008 and 2012 elections, our most recent survey shows.

Unlike 2012—when satisfaction with the choice of candidates increased as the election approached—satisfaction has been declining. This is not a view unique to California. A recent report by the Pew Research Center found that only 33% of registered voters nationwide were very or fairly satisfied with the choices of presidential candidates.

Compared with the last two presidential elections, satisfaction with candidate choices is down by more than 20 percentage points among California Democratic, Republican, and independent likely voters. Indeed, today only 28% of California’s independent likely voters are satisfied with their choice of candidates.

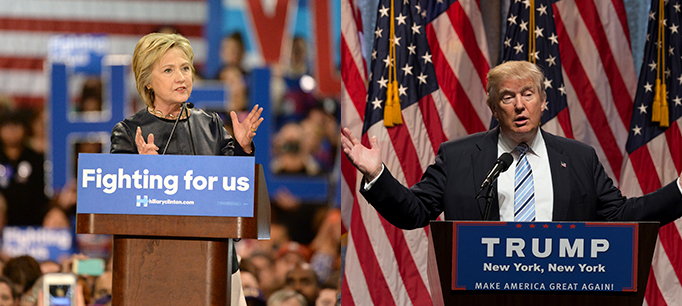
Among California likely voters, supporters of Hillary Clinton and Donald Trump are equally likely to say they are not satisfied with the choices of presidential candidates—48% of Clinton supporters and 49% of Trump supporters express this view.

Who are these unsatisfied supporters? Notably, 30% of unsatisfied Clinton supporters are between 18 and 34 years old.

Among Trump supporters, there is a difference when it comes to views on immigration policy. Unsatisfied Trump supporters are much more likely than satisfied supporters to say that undocumented immigrants should be allowed to stay in the country legally if certain requirements are met (59% to 43%).

These low levels of satisfaction with the candidates could have repercussions on voter turnout in California. We will have to wait and see if the two remaining debates make voters feel more satisfied with the choices before them or if they choose to voice their dissatisfaction by avoiding the ballot box.

Learn more

Read the September PPIC Statewide Survey: Californians and Their Government
Visit the PPIC Statewide Survey

Video: A High-Interest Election

By many measures, this is an unusual election year. In the presidential race between a businessman/reality TV star and the first woman nominated by a major party, most likely voters have made up their minds, the latest PPIC Statewide Survey shows. Yet interest in the election is high and satisfaction with the choice of candidates is low.

Two candidates from the same party are vying for an open US Senate for the first time since the state adopted the top-two primary system. About a quarter of likely voters say they won’t vote for either Democrat, and 19 percent are still undecided.

These are just two of the consequential choices Californians are being asked to make. There are 17 statewide initiatives on the ballot and in many communities, a number of local measures.

This all adds up to an election worth watching.

Dean Bonner, associate survey director, presented key findings from the survey to a Sacramento audience last week.

Commentary: Coping with 17 State Ballot Propositions


This commentary was published in the Los Angeles Times today. Thursday, August 18, 2016.

This fall, Californians will face the daunting task of determining the fate of 17 state propositions. Local ballots will add their own initiatives to this burden. It’s been a dozen years since a ballot was as challenging. How will voters respond?

Read the full commentary on latimes.com.

Learn more

PPIC Statewide Survey: Californians and Their Government (May 2016) 

Video: Assessing California’s Global Warming Law

Ten years ago, California enacted a law to combat global warming that set an ambitious goal: reducing greenhouse gas emissions to 1990 levels by 2020. Today, the state is poised to reach this target, and policymakers are discussing aiming for a new one.

Each year since the law—AB 32—took effect, the PPIC Statewide Survey has examined Californians’ views on climate change and the state’s actions to address it. The survey has consistently found that most Californians believe that the effects of global warming have begun and that majorities support the state taking action to address it.

But a partisan split has emerged since the law took effect. AB 32’s goals no longer have the bipartisan support they did in 2006. Today, Democrats and independents are much more likely than Republicans to support the goals of AB 32. This divide is reflected in a number of findings in the 2016 Californians and the Environment Survey.

Research associate David Kordus presented the survey at a briefing in Sacramento last week.

“Sin” Taxes on the Ballot This Fall

Two measures have qualified for the November ballot that ask California voters to increase so-called “sin” taxes. One measure, the Healthcare, Research, and Prevention Tobacco Tax Act, will add an additional $2.00 per pack to cigarettes sold in the state. Currently, the tax is $0.87 per pack, which ranks lower than the cigarette tax in 33 other states. The other measure, the Adult Use of Marijuana Act, proposes to legalize the recreational use of marijuana and impose a state tax on its sales.

States use sin taxes not only to raise revenue for state treasuries, but also to affect behavior. The notion is that as the price of a product goes up, consumption will drop, and with that drop, negative societal consequences—the rate of lung cancer, for instance—will decrease. In fact, revenue from sin taxes often fund related treatment or health care programs.

Though it is early on in the campaigns, Californians hold favorable views of both ballot measures. According to the May 2016 PPIC survey, 67% of likely voters favor an increase in the cigarette tax to fund health care and 60% favor marijuana legalization.

While there are a number of reasons voters may support or oppose these measures, our focus here is on the revenue implications.

How much more money could these taxes bring in?

Both measures hold promise for raising significant funds and represent an alternative source of revenue in a state that is heavily dependent upon personal income taxes. Together, they could bring in more than $2 billion in state revenue. This would be significantly more than the state’s other sin tax on alcohol, which raised about $350 million in 2014.

The state reported more than $800 million in tobacco tax revenue in 2014. An additional $2.00 per pack would more than triple the current tax, suggesting a significant jump in total revenue. The Legislative Analyst’s Office estimates that an additional $1 billion to $1.4 billion would be raised should the proposition pass.

Why wouldn’t total tobacco revenue triple? Total revenue will be determined by both the tax rate and the amount of tobacco purchased. If the increase has the desired effect, cigarette smoking will decline in the future. That, combined with the fact that California recently raised its smoking age to 21, should have an impact on total consumption. Indeed, the share of individuals who smoke cigarettes has been declining in California, from 18.6% in 1996 to 12.8% in 2014. In comparison, alcohol consumption has decreased since 1977, but has remained consistent over the past 20 years.

Nationally, California had the second-lowest cigarette smoking rate in 2014 (after Utah). But it’s worth noting that e-cigarette use nearly doubled among California adults from 1.8% in 2012 to 3.5% in 2013, complicating estimates of future revenue. If passed, the tax would also apply to e-cigarettes. If Californians use e-cigarettes as a substitute for cigarettes, then the measure will also capture revenue due to increased e-cigarette use. As we noted in our recent report, the additional revenue generated by taxing marijuana could be as much as $1 billion a year for the state. In the first full year after legalizing recreational marijuana, Colorado raised just over $120 million in state revenue, and Washington collected slightly less than $130 million. Given California’s larger population, the $1 billion figure is in the right ballpark. But since much is still unknown about the marijuana market, any estimate should be treated with caution.

How does California compare with other states?

The proposed taxes would be comparable to those currently in place in other states. If the tobacco tax passes, it would boost per capita revenue from $21 per resident to $50 per resident. This would still be below the national average of $57 per resident, though it would be much closer. For marijuana, the estimate of $1 billion in revenue would translate to about $26 per resident. Though there isn’t a national reference point for marijuana taxes, this number would be higher than the per capita amounts raised in Colorado and Washington. Interestingly, California’s alcohol tax revenue is less than most other states. On a per capita basis, California ranks 40th of the 50 states in alcohol revenue collected. In 2014, California collected only $9 per resident in alcohol taxes compared to the rest of the country, which raised $21 per resident. Doubling this rate—which would still be below the national average—could add another $350 million to state revenues.

Sources: National Institute of Alcohol Abuse and Alcoholism (NIAAA), Centers for Disease Control and Prevention (CDC), US Census, Office of Attorney General (OAG), Legislative Analyst’s Office (LAO).

Notes: Per capita alcohol consumption is taken from the NIAAA, which calculates consumption based on sales and a conversion of gallons in terms of pure alcohol (ethanol). Population data are drawn from the US Census. Cigarette smoking rates are from the CDC.
Primary Takeaways

With the release of the official Statement of the Vote on Friday, the 2016 California primary is now in the history books. The final tally by the Secretary of State offers many new insights for those of us who closely follow elections and polling in California. This year’s results deserve a particularly close look because of the extraordinary presidential primaries and the first-ever top-two primary for an open US Senate seat.

My colleague Eric McGhee has provided an excellent analysis of primary turnout and the outcomes of top-two legislative district races in two earlier PPIC blog posts. I’m going to focus on some trends that caught my attention in the final numbers regarding the presidential primaries, the top-two US Senate primary, the state ballot measure, voter engagement, and turnout in key regions. 

  • Presidential primaries. Secretary Hillary Clinton (2.75 million) and US Senator Bernie Sanders (2.38 million) were the top-two vote-getters in the state’s presidential primaries. These two Democrats had much more support in their party’s open primary than businessman Donald Trump (1.67 million) had in a closed Republican primary with no active opposition. In addition to facing a sizeable disadvantage in voter registration (45% Democrat, 27% Republican), the presumptive Republican nominee starts the fall election season with one million fewer voters in the state’s primary than the presumptive Democratic nominee. For Republicans, this raises questions about their presidential selection process and whether to have an open primary in the future that invites independent voters to participate. For Democrats, the immediate issue is how many of those devoted, young Sanders supporters will show up to vote this fall.
  • US Senate top-two primary. Attorney General Kamala Harris won more votes (3.00 million) in the primary for the open US Senate seat than Clinton did at the top of the ballot. US Representative Loretta Sanchez finished a distant second (1.42 million) to Harris, setting up the first single-party race for US Senate in the top-two era. As a group, the 12 Republican candidates received more votes (2.15 million) than the second-place Democratic finisher. For Republicans, this raises questions about future strategies to ensure that their party’s voters have a candidate who can qualify for a top-two spot in November. And the question of how many Republicans will opt out of voting for a US Senator this fall will ultimately affect both parties.
  • State ballot measure. Proposition 50 was the biggest vote-getter (5.60 million votes, 76% yes) on the June ballot. A byproduct of recent political scandals, it allows the legislature, with a two-thirds vote, to suspend members without salary and benefits. The legislature placed it on the June ballot with bipartisan support. Proposition 50 received scant media mention and little organized opposition. Its success is consistent with the historically high pass rate for legislative ballot measures found in a recent PPIC report. This trend bodes well for state bonds to fund parks and housing that the legislature may place on the ballot in the fall. Citizens’ initiatives and referenda have been moved to the November general election, and these types of state propositions have a much lower pass rate. That means voters face a cluttered ballot this fall that includes 14 citizens’ initiatives, two legislative initiatives, and one referendum, in addition to local measures. How many will voters decide are worthy of their interest and support? 

In Los Angeles and two of the state’s fastest-growing areas, turnout among registered voters was lower than the state average.

  • Voter engagement. There was a surge in online voter registration as Californians waited for their say in the presidential primaries. Voter engagement was a welcome development after primary turnout reached a new low in June 2014 (4.46 million, 25% registered voters, 18% eligible adults). Turnout this June (8.55 million, 47.7% registered voters, 34.5% eligible adults) reflected a turnaround, although it was well short of the record-setting February 2008 presidential primary (9.07 million, 58% registered voters, 40% eligible adults). Turnout was probably depressed by two events: the elimination of Trump’s competition weeks earlier and the declaration on the day before the primary that Clinton was the presumptive Democratic nominee. Once again, there will be questions about whether it’s in California’s best interests to vote at the end of the primary season in the presidential sweepstakes.
  • Turnout in key regions. Five major counties had lower registered voter turnout than the state average: Los Angeles (41%), Fresno (41%), Kern (41%), Riverside (44%), and San Bernardino (43%). Five less populous counties in the Central Valley also had below-average turnout (41% Kings, 42% Merced, 42% San Joaquin, 44% Stanislaus, 45% Tulare). Moreover, fewer than one in three eligible adults voted in the primary in all 10 of these counties. In sum, these are troubling trends in the state’s most populous county (Los Angeles) and its two fastest-growing areas (the Central Valley and Inland Empire). Are there practical impediments to voting in these regions or is this a symptom of a deeper civic malaise? Until they are fully addressed, these regional disconnects will seriously limit the size and diversity of the state’s electorate.

The 2016 primary results point to several trends to watch in the November general election and beyond. Furthermore, the issues that surfaced this June will likely have longer-term reverberations on the primary process and civic engagement going forward.

At PPIC, the race for US Senate stands out as uniquely worthy of public attention. We invited the two candidates to participate in a conversation with me about the future of California on September 16. Stay tuned for more information about whether the candidates accept our invitation and how you can attend or watch this PPIC event.

Commentary: New Law Could Change California’s Electorate

This commentary was published in the Washington Post’s “Monkey Cage” blog today, Monday, July 11, 2016.

Supporters of California’s New Motor Voter Act are right to see its great promise, but how the law is implemented will be far more important than many have suggested.

Read the full commentary on washingtonpost.com.

Video: Rolling Out the New Motor Voter Law

California’s New Motor Voter Act has the potential to change the composition of the electorate, making it younger, less educated, more mobile, and poorer—in other words, more representative of the state’s population as a whole.

These are among the key findings of a new PPIC report by research fellow Eric McGhee and Mindy Romero, founder and director of the California Civic Engagement Project at the UC Davis Center for Regional Change. McGhee presented the report, What to Expect from California’s New Motor Voter Law, in Sacramento last week. Passed to address the state’s lagging voter participation rates, the new law simplifies the registration process.

When it takes effect next year, all Department of Motor Vehicles (DMV) customers who attest to being eligible to vote and do not opt out—that is, do not actively decline to register—will be added to the voter rolls. Because of the sheer volume of DMV customers, the law has the potential to increase registration very quickly—by more than 2 million people in the first year, McGhee said.

Its success depends on how many DMV customers agree to be registered, and that hinges on the way the system is designed, he said. The report recommends that customers be required to say whether they are eligible to vote before they are allowed to complete their DMV transactions—rather than having the option of not answering the eligibility question at all.

“For the maximum impact, the solution is pretty straightforward: make the eligibility question required,” McGhee said.

He cautioned that even if implementation is highly successful, the New Motor Voter Act alone will not solve the state’s problem of low voter turnout. To significantly boost turnout—and ensure that voters are more representative of the state’s population—targeted and ongoing efforts to reach out to newly registered voters will be needed.

Learn more

Read What to Expect from California’s New Motor Voter Law

Worlds Apart: California’s Partisan Divide and the 2016 Election

With the June 7 primary behind us, it’s time to reflect on what we have learned about California’s likely voters as we look ahead to the November 8 election.

The December 2015 PPIC Statewide Survey reported a profound schism between Republicans who wanted “new ideas and a different approach” and Democrats who favored “experience and a proven track record” in a presidential candidate. Last Tuesday’s election provided more evidence of these attitudes. Donald Trump, a businessman with no political experience, won the Republican primary while Hillary Clinton, with a long record of public service, won the Democratic primary. It is now obvious that Californians’ candidate preferences are just one example of a deep partisan fissure that has emerged in the 2016 PPIC Statewide Surveys.

We found another example of this divide when we asked about the mood of the California electorate in 2016. Most Republican likely voters (78%) said the state is going in the wrong direction while most Democratic likely voters (67%) said it is going in the right direction in our May PPIC Statewide Survey. We found a similar divide in views about the direction of the US and about whether California and the US are headed into good economic times or bad ones next year.

The job approval ratings of elected officeholders also largely depend on one’s partisan stripes. President Obama has an 84% approval rating among Democratic likely voters and an 85% disapproval rating among Republican likely voters. This party split is also clear in the approval ratings of the US Supreme Court, California US Senators Barbara Boxer and Dianne Feinstein, Governor Jerry Brown, the California Legislature, and even local House members and state legislators. The only area of consensus is the overwhelming disapproval of the US Congress (84% Republican, 81% Democrat).

There are also large and consistent partisan divides over the role of government. The vast majority of Republicans—83%— want a smaller government with fewer services, while a strong majority—69%—of Democrats say they prefer a bigger government with more services.

Similar partisan differences are evident when Californians are asked about gun laws, government regulation, and economic inequality. While 64% of Republicans say the government goes too far regulating guns, 79% of Democrats say it does not do enough. A majority of Republicans—66%—say government regulation does more harm than good, while 76% of Democrats say government regulation is necessary to protect the public. And 68% of Republicans say the government should not be doing more to reduce the gap between the rich and poor, while 79% of Democrats say it should be.

Last but not least is the partisan gulf on immigration and race. There are also different perspectives on the proposal to build a wall along the entire Mexico border (60% Republicans favor; 87% Democrats oppose) and whether immigrants are a burden (66% Republicans) or a benefit (78% Democrats) to California. Most Republican likely voters (58%) say there is equal treatment in the criminal justice system while most Democratic likely voters (80%) say that blacks and minorities do not get equal treatment.

Looking ahead to the November ballot, there are starkly different views on extending a temporary income tax on the wealthy, with 68% of Republicans opposing the extension of this Proposition 30 tax and 80% of Democrats in favor of it. The results are similar when our survey asked about a state school bond (50% Republicans no, 82% Democrats yes) and marijuana legalization (56% Republicans oppose, 69% Democrats favor).

How will California’s partisan divide impact the November election? Democrats now have an 18-point edge over Republicans in voter registration (45% to 27%).The PPIC Statewide Surveys this year also indicate that independent voters are leaning in the same direction as Democratic voters in their presidential, US Senate, and ballot choices, and their overall outlook, approval ratings, and policy preferences. In this context, the May PPIC Statewide Survey found that the state’s likely voters favor the presidential candidate who stands for experience and a proven track record over the presidential candidate who stands for new ideas and a different approach. Still, Republicans overwhelmingly support their party’s standard bearer and appear to be aligned with his perspectives and policies.

California seems poised to maintain its blue status this fall. However, the geo-political segregation of the state —with Republican pockets of strength in California’s northern, inland, and rural regions—means that federal and state legislators will be elected to represent the views of voters who are worlds apart. Indeed, the political polarization and antipathy of this year’s election may result in a California Congressional delegation that will contribute to Washington gridlock and a California Legislature that will struggle to find common ground on solutions to the many challenges facing California’s future.

A Turnaround for Voter Turnout?

The recent primary offered signs of improvement for California’s abysmally low voter turnout. Recent elections have seen some of the worst turnout in the state’s history. The 2014 election cycle was particularly dismal, but 2012 also set a new low for a presidential primary election. Moreover, California has been lagging behind other states in both registration and turnout.

However, there has been a large surge in new registrants over the last few months, and the California Secretary of State currently estimates that almost 9 million Californians participated in the 2016 presidential primary election, compared to only 4.5 million in 2014 and 5.3 million in 2012.

If we look at the share of voting-eligible residents who have registered in time for each of the last 18 primary elections, California’s registration rate has always fallen within a fairly narrow band—from a low of 66% in 1988 to a high of 75% in 1996. In this context, the 2016 registration rate might be seen as a disappointment. Compared to the same point in the 2012 primary election cycle, the registration rate has remained largely unchanged, though it is still comparatively high when viewed in the context of the past several decades.

How can we square this result with the reported surge in new registrants? The registration rate typically drops some between elections as county registrars purge voters who have moved or died from the registration rolls, and relatively few new voters sign up to take their place. This decline was especially large between fall 2014 and the beginning of the primary season this year. Given that baseline, a flat registration rate is consistent with a surge of new registrants, and must be considered something of a success.

More to the point, these registrants turned out to vote at a higher rate than we have seen in any primary since 2008. The estimated 8.9 million ballots translates to a turnout rate of about 50% among registered voters. That sits comfortably in the broad average of California’s presidential primary turnout, and marks a considerable improvement over 2012.

In fact, California’s presidential primary turnout now shows no clear sign of decline since 1984; it may even be holding its own relative to other states. But midterm turnout is a different story. There is a much longer downward trend for such elections, both viewed on their own and relative to trends in other states.

On balance, there are signs of recovery from the low turnout levels of 2012 and 2014, despite concerns that California’s late presidential primary would discourage participation. Whether this improvement will be sustained into the fall—and whether things will turn around for midterm elections in 2018—of course remains to be seen.