Video: Survey Looks at Candidates & Issues

The most recent PPIC Statewide Survey found a tightening primary race between Democratic presidential candidates Hillary Clinton and Bernie Sanders, and strong majority support for Donald Trump among Republican primary likely voters.

Dean Bonner, associate survey director, presented the findings at a Sacramento briefing last week. In addition to examining views of presidential candidates, the survey asked California likely voters for their choices in the election for US Senate—and it looked ahead at potential matchups for November in both races.

The survey offers a snapshot of Californians’ views on two key topics being widely debated nationally:

  • Immigration policy. A strong majority of likely voters oppose building a wall along the entire border with Mexico, as Trump has promised to do. There is a stark partisan divide: 86% of Democrats and 72% of independents oppose building a wall, while 59% of Republicans favor it. Asked whether or not undocumented immigrants living in the United States should be allowed to stay legally, 75% of likely voters favor allowing them to stay. Majorities across partisan lines say undocumented immigrants should be allowed to stay.
  • US Supreme Court. At a time when the court has issued rulings on a number of polarizing topics, California likely voters are divided in how they rate the court: 46% approve of the way the court is handling its job and 44% disapprove. Should the Senate should confirm Obama’s nominee, Merrick Garland, to the court? About half of likely voters (51%) say yes, and 33% say no.
Learn more

Read the May 2016 PPIC Statewide Survey: Californians and Their Government
Visit the PPIC Statewide Survey pages

Testimony: California’s Exclusive Electorate & the 2016 Election

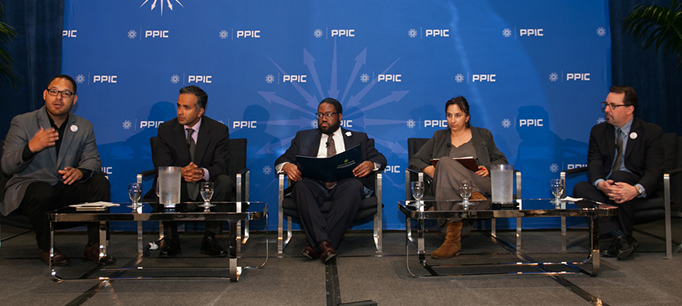
Mark Baldassare, PPIC president and CEO, testified before the Assembly Select Committee on Civic Engagement in Los Angeles today (May 13, 2016). Here are his prepared remarks.


“If the trends in voting continue, we face the prospect of an electorate making policy choices that neglect the realities and problems facing large segments of California society.” I wrote these words in a 2006 PPIC report, California’s Exclusive Electorate. The report analyzed trends in the state’s electorate from 1990 through May 2006 and polling results from the PPIC Statewide Surveys from 2005 to 2006. It revealed the gulf in political preferences between the state’s voters and the majority of its adult population, and suggested that if California’s nonvoting adult population made their voices heard at the ballot box, the political status quo could change—dramatically. In other words, the choices that voters make do not necessarily represent the preferences—or the needs—of California’s broader population. These disparities could be a problem for any state and are not unique to California.1 However, for California, a state that calls on its voters not only to elect representatives but also to make so much policy through ballot initiatives, these disparities raise real concerns.

In the years since that report, voter participation has continued to fall while the state’s population has become larger and more diverse. This troubling trend, especially notable in primaries and midterm elections, has motivated a statewide conversation about advancing civic engagement and increasing voter participation in California. Compounding this concern is our finding that California’s likely voters—who decide the fate of candidates and ballot initiatives—do not represent the demographics or the policy preferences of the state’s adult population.

At a time when new approaches to boosting voter turnout are being implemented and proposed, and as we approach the 2016 presidential election, it seemed important to update our work on the electorate. Using PPIC Statewide Survey data from 2015—drawn from about 12,000 interviews during seven monthly surveys that included voting and nonvoting adult Californians—our 2016 PPIC report paints a comprehensive picture of likely voters and their nonvoting counterparts. Once again, we find that the people who go to the polls in California are very different from those who don’t; they have different demographic characteristics—such as age, education, homeownership, immigration, income, and race/ethnicity. They also have different political attitudes and policy preferences. As California’s population continues to expand and change, the voting rolls are not keeping pace, and the state’s voters remain unrepresentative of its population.

In our 2016 report, we found a strong connection between economic inequality and political inequality. Likely voters in California tend to be older, white, college educated, affluent, U.S. born, and homeowners. They tend to identify themselves as “haves”—rather than “have nots”—when asked to choose between these two economic categories. Nonvoters tend to be younger, Latino, renters, less affluent, less likely to be college educated, and not U.S. born—and they generally identify themselves as “have nots.” Voters and nonvoters differ noticeably in their views on the role of government, taxes and spending, ballot choices, and elected officials—all of which come into play during an election year and influence governing choices in the long term.

California’s recent steps to encourage voter participation are a step in the right direction, but the divide between voters and nonvoters is deep and persistent. Why has the exclusive electorate phenomenon that we identified 10 years ago been so difficult to change? State laws that make it easier to register to vote and cast ballots are helping to expand the electorate, but only to a limited degree. When eligible adults are asked why they are not registered to vote, most cite a lack of confidence or a lack of interest in elections, a lack of trust in government, and a lack of time to vote. When registered voters are asked why they do not always vote, their top reasons are a lack of interest and time and low levels of confidence and trust.2

More fundamentally, the broad demographic and economic shifts underway in the state are shaping the divide between California’s voters and nonvoters today. Immigration is one important factor. Millions of California adults are documented and undocumented noncitizens. The share of the adult population that is undocumented is on the decline, but it is still a large segment of California society. Public and private efforts are needed to encourage more noncitizens to become citizens and join the voter rolls. Comprehensive federal immigration reform that provides a path to citizenship is another key ingredient in creating a larger and more diverse electorate. Other powerful socioeconomic factors help determine political participation. A significant share of California’s population is living in poverty, housing costs in coastal regions are high, and the state economy is likely to face a shortage of college-educated workers in the near future. Efforts to increase economic opportunity through policies that produce high-paying jobs, provide affordable housing, and increase college graduation rates would also grow and diversify the electorate.3

How will these ongoing trends in political and economic inequality affect the 2016 election cycle? As is always the case, voter turnout will increase and demographic profiles will broaden for the November presidential election. Still, we expect to see a large divide between voters and nonvoters this year. Once again, California faces the prospect of an electorate making policy decisions that neglect the realities and problems facing large and growing segments of society.

What are the larger consequences of uneven participation rates and low voter turnout? First, the fact that a relatively small group of voters is making decisions about elected representatives and public policy raises serious questions about the legitimacy of the democratic system. Next, because the haves in society are the frequent voters, and so many of the have nots are not voting or are not registered to vote, our electoral process does not reflect the broad economic and political interests of all adults. Last, likely voters and nonvoters have different perspectives on the role of government, government spending, ballot choices, and the state’s elected officials.

What might happen if voters were more representative of California’s adult population? There could be more voter support for policies that increase spending for health care and education, and for an expansion of the government’s role in improving the lives of immigrants and the less economically advantaged. If large numbers of new voters continue to register with “no party preference” and the proportion of major party voters continues to shrink, the power of independent voters in determining election outcomes could be bolstered. Finally, growth and change in the electorate could initially produce more political instability, as elected officials, candidates, political parties, and initiative campaigns reach out to a larger and more diverse electorate.4

In the long run, having a larger and more engaged electorate that is more representative of the people of California would be a source of political stability for a state that increasingly relies on the ballot box to make its major policy decisions.

1. Raymond E. Wolfinger and Steven J. Rosenstone, Who Votes? (Yale University Press, 1980); Eric Plutzer, “Becoming a Habitual Voter: Inertia, Resources, and Growth in Young Adulthood,” American Political Science Review 96 (1): 41-56, 2002; Karthick Ramakrishnan, Democracy in Immigrant America, (Stanford University Press, 2005); Mark Baldassare, At Issue: Improving California’s Democracy (Public Policy Institute of California, October 2012); Jan E. Leighley and Jonathan Nagler. Who Votes Now? (Princeton University Press, 2014).
2. Mark Baldassare, Dean Bonner, David Kordus, and Lunna Lopes, “Voter Participation in California,” Just the Facts (Public Policy Institute of California, September 2015).
3. Laura Hill and Joseph Hayes, “Undocumented Immigrants,” Just the Facts (Public Policy Institute of California, June 2015); Sarah Bohn, Caroline Danielson, and Monica Bandy, “Poverty in California,” Just the Facts (Public Policy Institute of California, December 2015); Hans Johnson, Marisol Cuellar Mejia, and Sarah Bohn, Will California Run Out of College Graduates?, (Public Policy Institute of California, October 2015); Hans Johnson and Marisol Cuellar Mejia, California’s Future: Housing, (Public Policy Institute of California, February 2015).
4. Jack Citrin, Eric Schickler, and John Sides, “What If Everyone Voted?” American Journal of Political Science 47 (1) 75-90, 2003; Mark Baldassare, At Issue: Improving California’s Democracy, (Public Policy Institute of California, October 2012); Jan E. Leighley and Jonathan Nagler, Who Votes Now? (Princeton University Press, 2014).

Video: California’s Voter Turnout Problem

Voter turnout in California has been declining—it reached record lows last year, raising concerns about the state’s democratic process. PPIC research fellow Eric McGhee told a Sacramento audience last week that turnout in California has not only dropped in absolute terms but has fallen behind that of other states. While participation in fall presidential elections has been holding steady, turnout is on the decline in midterm elections—when the state elects a governor and other statewide officials—and, to some extent, in presidential primaries.

A big part of the problem is California’s voter registration rate, said McGhee, who coauthored the new report Putting California’s Voter Turnout in Context. It has not changed significantly, though it should have been climbing, as it has in other states.

California has been working hard to make the voting and registration processes as easy as possible, and other policy changes are under discussion. Will they result in higher turnout? They may help, but they aren’t panaceas, McGhee said. Ongoing mobilization efforts will be needed to motivate more people to cast a ballot.

Video: Senator Dianne Feinstein in Conversation

Underscoring her role in three contentious policy issues, California’s senior senator spoke to a Sacramento audience last week about filling the vacancy on the US Supreme Court, the dispute between Apple and the FBI, and drought relief.

Senator Dianne Feinstein urged speedy consideration of a nominee to replace the late Antonin Scalia on the court, saying that Senate can consider and confirm a new justice within 69 days—the average time for the process has taken in the past. She acknowledged that it would not be easy.

“I wish we could go back to the days when I first went to the Senate when the belief was that every president deserves his nominations,” she told Mark Baldassare, PPIC president and CEO, at the PPIC event.

Asked about the Apple controversy, she called on the company to reconsider its position and cooperate with the FBI to access data on a phone used by one of the San Bernardino killers. “Apple is not above the laws of the United States,” she said.

She said her position on the Senate Intelligence Committee—which occupies most of her time—gives her a perspective not shared by many on the dangers posed by terrorists.

Feinstein also detailed some of the provisions in her drought-relief bill, which would fund recycling, desalination, and water storage projects, as well as ease water trading.

She closed by describing her leadership style, saying she tries to “use the time to get things done. If I can’t do them through legislation, I’ll do them another way.”

Public Opinion and Sentencing Reform

Governor Brown has proposed a ballot initiative that would reform prison sentencing in California, increasing parole opportunities for non-violent felons. Our January PPIC Statewide Survey findings show a public opinion environment that may be favorable to the governor’s proposal.

Our survey shows that many Californians believe—incorrectly—that prisons and corrections account for the largest share of state spending. When asked to select the largest spending area of the state budget, California likely voters are most likely to choose prisons and corrections (41%)—this is consistent with our findings over the past several years. In fact, the allocation for prisons and corrections in the governor’s 2016–17 budget proposal ($10.6 billion) comes in behind higher education ($14.6 billion), health and human services ($33.7 billion), and K–12 education ($51.2 billion).
If the governor’s sentencing reform proposal is perceived as a way to reduce spending on prisons and corrections, it could benefit from this overestimation of state corrections spending. The proposal could also benefit from a contrasting opinion: only 3 percent of likely voters say that prisons and corrections should be the highest spending priority.

Californians’ current attitudes toward crime may also bode well for sentencing reform. Just 3 percent of likely voters name crime, gangs, or drugs as the most important issue for the governor and legislature to work on this year. And only 15 percent of likely voters say violence and street crime are a big problem in their communities today—down somewhat from January 2015 (22%). Furthermore, a solid majority of likely voters (63%) say that the criminal justice system is biased against blacks and other minorities, a share that is somewhat larger than it was last January (55%).

Given these attitudes toward crime and the criminal justice system, along with Californians’ desire to see less spending on prisons and corrections, the governor’s proposal for sentencing reform could be well received.

Video: A Conversation with Legislative Leadership

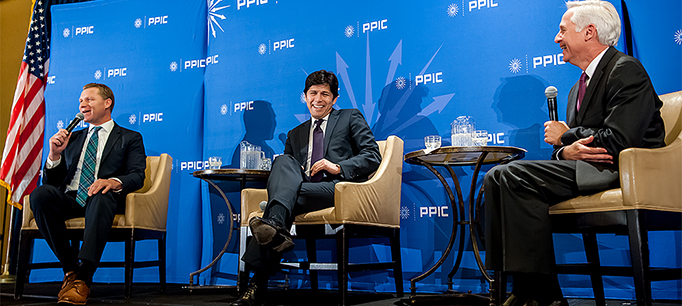
At a PPIC event last week, Kevin de León, senate leader pro tem, and Chad Mayes, the Assembly Republican leader, were asked to name the top three issues the legislature should work on with the governor. Though the leaders come from different sides of the aisle, the list of issues they named before a large Sacramento audience had a lot in common. De León’s priorities began with income inequality between the coastal and inland regions, a “tale of two states.” He also listed water and making targeted investments, particularly in higher education. He went on to list a fourth issue: climate change.

Mayes named water and a lack of water infrastructure, and the many Californians left behind in the state’s economic recovery. His third issue was transportation, the focus of an ongoing special legislative session.

“Everywhere that I go in California,” he said, “I’m stuck in traffic. So we know there’s a problem.”

The leaders’ top issues dovetail with findings from the latest PPIC Statewide Survey in which Californians identify water and the economy as the most important issues for the legislature and governor to work on in 2016. 

Though De León and Mayes named similar priorities, there was much less agreement on solutions. But the two maintained a collaborative tone throughout their conversation, denounced what Mayes termed “demagoguery on the national stage,” and repeated their commitment to working together productively.

De León said the legislature can avoid being mired in bitter national political debates if leaders continue to work cooperatively to “get some real tangible victories for Californians.”

“We’re doing things very differently in the state of California,” he said.

Ideology and California’s Independent Voters

Nearly one in four California voters are registered with “no party preference,” and the share of these voters—commonly known as independents—has more than doubled over the past twenty years. Does the growing number of independent voters mean that California’s electorate is becoming less polarized?

Data from the PPIC Statewide Survey suggests that independent voters do not speak with one voice, and they are not, as a rule, more moderate than partisans. In our 2015 surveys, the overwhelming majority of independents say they lean toward either the Democratic Party (41%) or the Republican Party (30%), and these voters often share the views of the party they lean toward.

For example, independents who say they lean toward the Democratic Party are about as likely as registered Democrats to call themselves politically liberal. Similarly, most Republican-leaning independents and registered Republicans call themselves politically conservative. The only group of independents who stand out as more politically moderate than partisan voters are the ones who lean toward neither party—a majority of these independents call themselves politically middle-of-the-road.

Political differences among independents also show up in responses to survey questions about specific issues. On immigration, Republican-leaning independents line up with registered Republicans in saying that overall, immigrants are a burden to California (55% and 61%), while solid majorities of both Democratic-leaning independents and registered Democrats say immigrants are a benefit to the state (80% and 72%). Regarding the taxation of oil extraction in California, Democratic-leaning independents and registered Democrats are in favor (61% and 55%), while Republican-leaning independents and registered Republicans are opposed (70% and 60%). Finally, majorities of Democratic-leaning independents and registered Democrats would prefer to use state budget surpluses to restore funding for social services (52% and 56%), while majorities of Republican-leaning independents and registered Republicans would prefer to pay down debt and build up reserves (73% and 76%).

These findings show that the 24 percent of California voters who are registered as independents do not all occupy the political center—and that these voters often diverge sharply from one another in their political ideologies and their opinions about specific issues.

Chart Source (TOP): Registration totals for Democrats, Republicans, independents, and other parties are from the California Secretary of State. The shares of independents who lean toward the Democratic Party, Republican Party, or neither party are estimated using PPIC survey data.

Can Preregistering Teens Boost Voter Turnout?

California has been struggling lately with voter engagement. Turnout in the 2014 statewide elections, both in the primary and the general, set record lows. Turnout among young voters was especially bad. A recent report from Mindy Romero of the California Civic Engagement Project showed that an abysmal 8% of 18 to 24 year olds cast a ballot in 2014. As Paul Mitchell of Political Data Inc. dryly noted, “In California, an 18- or 19-year-old was more likely to be arrested this year than actually vote in one of the statewide elections.”

In this environment, California has been exploring and adopting all sorts of policy changes to improve turnout. One of these is preregistration: the practice of allowing voters who are not yet old enough to vote to place a flag in the system that will activate their registration as soon as they come of age. California has had preregistration for 17-year-olds since 2009, and for 16-year-olds since last year. However, neither reform will go into effect until the state completes work on a new voter registration database in 2016.

Most of the conversation around this reform has focused on making it easier to get more young people registered by expanding the window of opportunity for doing so. Yet interesting new research suggests there may be more to the reform than meets the eye.

In a recent paper in the prestigious American Journal of Political Science, John Holbein and Sunshine Hillygus of Duke University find that young people who enter the voter rolls through preregistration vote at higher rates than young people who register the traditional way. Depending on how it is measured, the boost in youth turnout is anywhere from a modest 2% to a whopping 13%. While theirs is not the first research to suggest an impact from preregistration (see, for example, this report by Michael McDonald of the University of Florida), Holbein and Hillygus go to great lengths to isolate the causal impact of the reform itself. Thus, we can be pretty confident that the effect they find is real.

This is a very intriguing result. It suggests that there is something about the act of preregistration that makes young people more likely to follow through and cast a ballot. Even more amazing, the boost in turnout measured by Holbein and Hillygus came years after the young people first signed up.

What could be producing this effect? Though the authors can’t say for sure, they speculate that it may have something to do with the way young people participate in the preregistration program. Preregistration often occurs at special school events where there is a certain fanfare around the process. Such fanfare is likely to impact teenagers with extra force, since they are actively shaping their own political identities. In other words, this paper may tell us as much about the potential benefits of civic education in high school as it does about preregistration itself.

More generally, the research also reminds us that total turnout is not a good way of assessing the performance of reforms. California’s turnout has been horrible lately, and any single reform is not likely to alter that basic truth. But if we can identify reforms that improve matters at the margins, then enough of them might add up to a more substantial effect.