Lessons on Sustaining the Environment During Drought

California and Victoria, Australia, are both drought-prone states that face major challenges in managing freshwater-dependent ecosystems and native species during dry times. Both states have experienced intense controversy over balancing water for environmental needs and agricultural and urban uses. But while California’s environment has suffered greatly during its latest drought—with many species pushed to the brink of extinction—Victoria avoided serious biological losses during an even longer drought. Equally important, Victoria enacted a suite of policy changes that improved water management for all sectors, not just the environment, and reduced conflict.

A new report by the PPIC Water Policy Center examines how Victoria allocates water for the environment during times of extreme scarcity. We identify four key lessons from Victoria’s experience that could improve how California manages water for the environment during drought. These include:

  • Plan for drought rather than simply react to it: Victoria adopted planning processes that make it easier to set priorities for managing species during times of extreme scarcity, help build species’ resilience during normal and wet years, and promote recovery of populations when drought ends. Extensive community involvement in these plans has improved the public’s understanding of environmental water management actions, resulting in reduced tensions. California lacks environmental drought plans, relying instead on decision making during an emergency, rather than before.
  • Strengthen state and federal partnerships: Victoria’s success in managing drought relied on strong support from the Australian federal government. Although federal-state coordination in the West has improved during the current drought, the federal government—despite its key responsibilities in regulating and providing water resources—has not played a significant role in anticipating or reducing the effects of drought on California’s environment.
  • Recognize a water right for the environment: Victoria granted the environment a water right with equal priority to urban and agricultural uses. Environmental water managers are provided with resources to build and manage an extensive water portfolio, and participate in a robust, well-managed water market. Although California has some water rights allocated to the environment, volumes are relatively small and cannot be flexibly managed. Efforts to acquire significant permanent supplies for environmental uses have been limited by a lack of funding.
  • Treat environmental water as equal to other uses: In Australia, the environment has an equal “seat at the table” in water negotiations and the opportunity to be a partner in constructing water management solutions. This enables a more flexible, ecosystem-based approach to managing environmental water. In California, the highest environmental priority is avoiding extinction of native species protected by state and federal endangered species acts. This creates the perception that the environment is a constraint rather than an integrated priority in water management.

California has made some important advances in environmental water management during the current drought, including enacting historic legislation to reform groundwater management, developing new standards for environmental flows in a few basins, and allocating bond funds to purchase water rights for the environment. But much more needs to be done to improve drought resilience and to reduce conflict over environmental water allocations in future droughts. The Victorian experience shows that better planning and the right tools can reduce uncertainty for all parties and increase flexibility for environmental management. It’s a model worth exploring here in California.

Learn more

Read “California’s Environment Needs a Water Budget” (PPIC blog, December 14, 2015)
Read a summary of policy recommendations from Improving the Federal Response to Western Drought (February 2016)
Visit the PPIC Water Policy Center’s drought resource page

Does Guaranteed Tuition Lower College Costs?


This post is part of an occasional series examining how California can learn from policies in other states.

California’s public universities have a volatile tuition history. Stretches without increases are followed by sharp tuition hikes. The most recent increases in 2008—during the Great Recession—followed a pattern seen throughout the US: recessions generally cause states to allocate less money to their public universities, and the universities respond to the lost revenue by increasing tuition. Other states with similar tuition volatility have enacted policies to make tuition more predictable for students and their families.

Policy: Illinois Undergraduate Guaranteed Tuition Program

Since 2004, Illinois law has guaranteed that students who enroll in any of the state’s public universities pay the same tuition for four years. Any tuition increases that occur during those four years affect only the new class of freshmen. This allows students and their families to plan for the four years of college financially. But the policy covers only tuition—so students are still subject to yearly increases in other costs, such as room and board, other fees, and books. These additional expenses represent a large portion of the overall cost of college but are generally less volatile than tuition.

How does guaranteed tuition in Illinois compare to year-to-year tuition in California? A University of Illinois Urbana–Champaign student starting in 2008 and finishing in four years knew in advance that tuition would be $9,242 for all four years, leaving the student with an overall bill of $36,968. For an incoming UC Berkeley student, tuition was a relatively low $6,262 in 2008, but that student did not know that tuition would increase 79% by the fourth year and would add up to more than $34,000.

Policy Impact

Institutions that guarantee the same tuition for four years risk bearing the cost of inflation and other external factors (such as a reductions in state funding). This risk could be handled in many ways, including dramatically increasing tuition for the newest class of students, accepting more out-of-state students (who pay much higher tuition), or setting tuition at a higher level than necessary in the first year of a student’s enrollment. In fact, a recent study suggests that colleges affected by the Illinois guaranteed tuition law have raised tuition for incoming students by 26% to 30%—or about $1,500. This has resulted in students paying about 7% more tuition on average than they would have paid without the policy. In short, these students may have traded affordability for predictability.

Lessons for California

A similar policy in California would make tuition predictable for students, but public universities would still be at the mercy of the state budget process, recessions, inflation, and other factors. The universities would have to plan very carefully or risk not having enough revenue. The current practice of setting tuition year to year may allow the state’s universities to be more flexible and responsive to changes in revenue. This practice makes tuition volatile, but it may offer students a cheaper degree.

Learn more

Visit the PPIC Higher Education Center

Video: Rolling Out the New Motor Voter Law

California’s New Motor Voter Act has the potential to change the composition of the electorate, making it younger, less educated, more mobile, and poorer—in other words, more representative of the state’s population as a whole.

These are among the key findings of a new PPIC report by research fellow Eric McGhee and Mindy Romero, founder and director of the California Civic Engagement Project at the UC Davis Center for Regional Change. McGhee presented the report, What to Expect from California’s New Motor Voter Law, in Sacramento last week. Passed to address the state’s lagging voter participation rates, the new law simplifies the registration process.

When it takes effect next year, all Department of Motor Vehicles (DMV) customers who attest to being eligible to vote and do not opt out—that is, do not actively decline to register—will be added to the voter rolls. Because of the sheer volume of DMV customers, the law has the potential to increase registration very quickly—by more than 2 million people in the first year, McGhee said.

Its success depends on how many DMV customers agree to be registered, and that hinges on the way the system is designed, he said. The report recommends that customers be required to say whether they are eligible to vote before they are allowed to complete their DMV transactions—rather than having the option of not answering the eligibility question at all.

“For the maximum impact, the solution is pretty straightforward: make the eligibility question required,” McGhee said.

He cautioned that even if implementation is highly successful, the New Motor Voter Act alone will not solve the state’s problem of low voter turnout. To significantly boost turnout—and ensure that voters are more representative of the state’s population—targeted and ongoing efforts to reach out to newly registered voters will be needed.

Learn more

Read What to Expect from California’s New Motor Voter Law

How Is California Spending the Water Bond?

Almost two years ago, California voters passed Proposition 1—a $7.5 billion water bond intended to provide significant investments in the state’s drought-challenged water systems. Today, Californians concerned about the prospects of worsening drought may wonder how the state is spending these funds, and whether they are moving out the door fast enough.

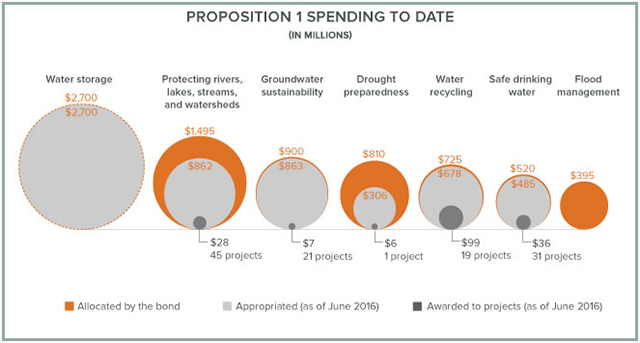
Proposition 1 has seven funding categories, with a pot of money allocated to each. The bond language preauthorized spending in the largest area—$2.7 billion for water storage projects. For the other six areas, spending must be appropriated in the state budget.

With the passage of the most recent budget, nearly 80 percent of the bond has now been appropriated. The only category with no funds appropriated is flood management, which is still spending down money from earlier bonds.

Far less of Proposition 1—just $177 million, or 2 percent—has been awarded for spending. This gap reflects the additional prep work needed to use the appropriated funds. Bond money is generally appropriated to specific state agencies, who distribute it as cost-share grants through a competitive process. To ensure accountability, agencies set up rules on how they will evaluate applications. Once these rules are publicly vetted and finalized, agencies solicit project applications and award funds.

To date, the awards have focused on addressing priorities related to urgent public health and safety issues and the drought. Thirty-one grants will help disadvantaged communities with safe drinking water and wastewater treatment projects, 19 grants will boost urban supplies with wastewater recycling projects, and 21 grants will support local efforts to better manage groundwater reserves. Another priority has been California’s ecosystems, which have been hit hard by the drought; 45 projects address water supply and habitat to support native species around the state.

No funds have been awarded yet for water storage, another key area for boosting drought resilience. This has led to some criticism that the pace of spending is too slow, but this overlooks the bond language, which laid out a two-year process for establishing funding criteria.

The water bond’s storage money can only be used for funding “public benefits” resulting from storage projects. For any given project, at least half of these benefits must be for improving ecosystem conditions. Other qualifying benefits include better flood protection, recreation opportunities, emergency supplies, and water quality. In January, the California Water Commission proposed regulations that outline how the public benefits will be judged and quantified. The public comment period has ended, and the commission is on track to finalize its regulations by the end of 2016 and start soliciting applications in 2017.

The experience so far with Proposition 1 spending highlights something Californians have already seen with past water bonds: turning bonds into projects on the ground takes time. And there can be tradeoffs between expediency and value, because spending money quickly can favor less innovative projects or those that would be relatively easy to fund without bond support. So while California shouldn’t drag its feet in funding improvements to the state’s drought-challenged water infrastructure, striving for an accountable process that leads to quality projects is likely to be worth the wait.

Figure source: Proposition 1 Bond Accountability Report; Proposition 1 Bond project search website; Wildlife Conservation Board Streamflow Enhancement Program project allocations (downloaded on June 15, 2016)

Figure note: Appropriated amounts (light grey circles) contain both appropriations and costs for issuing and tracking bonds (2% of total costs). Amounts awarded to projects are calculated by the authors compiling data for each project from the Proposition 1 project search website. We searched for projects in “all counties,” organized projects by bond spending area/chapter, and summed both total cost of projects ($571 million) and Proposition 1 contribution to that sum ($177 million). In addition to money for awarded projects, agencies have also spent some funds for grant administration, which is not included in the dark grey circles.

Learn More

Read California’s Water: Paying for Water (from California’s Water briefing kit, April 2015)

Increasing On-Time Graduation Rates in Hawai‘i


This post is part of an occasional series examining how California can learn from policies in other states.

While 57 percent of students at California State University (CSU) earn a bachelor’s degree, only 19 percent of first-time freshmen graduate in four years. Taking longer to graduate increases the cost of the degree and delays entry into the workforce.

One reason students are not graduating in four years is because they are not taking a full course load of 15 units—about five classes—per term. For financial aid purposes, students are considered full-time if they enroll in 12 units per term—about four classes. But taking 12 units means taking an extra year to graduate. Students have many reasons for taking less than a full load: family obligations, employment, inadequate preparation for the rigor of college courses, or the cost of extra books. It is also possible that students do not realize they need 15 units per term to graduate in four years. UCLA’s Cooperative Institutional Research Program found that 86 percent of freshmen nationwide believe they will graduate in four years, but only about 55 percent actually do so. CSU may be able to learn from 15 to Finish, a campaign adopted by the University of Hawai‘i in 2011 to increase student enrollment in 15 units per term and increase their four-year graduation rates.

Policy: University of Hawai‘i’s 15 to Finish Campaign

In 2010, the University of Hawai‘i system (UH) launched the Hawai‘i Graduation Initiative (HGI) to increase college participation and completion. One of HGI’s strategies is a 15 to Finish campaign to encourage university and community college students to enroll in 15 units a term so they can graduate in four years. Other HGI strategies include creating block or cohort scheduling so that groups of students take the same courses together; reducing summer tuition; and developing academic roadmaps to help freshmen plan their course sequences to graduate on-time. The 15 to Finish campaign’s communication strategy highlights the need to take 15 credits per term and the benefits of graduating in four years in television commercials, informational handouts, and student orientations. It also markets the additional three units as “free” because tuition is the same for 12 and 15 units.

Policy Impact

The early results of UH’s 15 to Finish campaign look promising. Between 2011 and 2013, enrollment in 15 units per term rose by about 5 percentage points, to 25 percent of the UH student population enrolled in 15 units. More important, the system’s four-year graduation rate has risen 7.2 percentage points since the graduating class of 2012, to 25 percent. At CSU, the four-year graduation rate has improved just 2.9 percentage points, to 19 percent, over the same period.

Lessons for California

CSU’s 2015 Graduation Initiative was successful in raising six-year graduation rates. As the system launches a new 2025 Graduation Initiative, which focuses in part on increasing four-year graduation rates, campuses should consider implementing a media strategy to inform students about the three “free” units per term that will help them graduate on-time. One campus, Cal State LA, has already started: it launched a 15 to Finish campaign in August 2015, in anticipation of its transition to a semester calendar.

A system-wide 15 to Finish campaign could also persuade some campuses to stop discouraging students from taking 15 units if they work. It would be more helpful for campuses to inform students they need 15 units a semester to graduate in four years and give them estimates of the number of homework hours created by this course load, so they can make their own decisions about how many units to take each term.

This kind of messaging could also help UC and the community colleges increase on-time completion rates. It could be a relatively simple way to create more room for new students and increase the number of college graduates in our state.

Learn more

Visit the PPIC Higher Education Center

Worlds Apart: California’s Partisan Divide and the 2016 Election

With the June 7 primary behind us, it’s time to reflect on what we have learned about California’s likely voters as we look ahead to the November 8 election.

The December 2015 PPIC Statewide Survey reported a profound schism between Republicans who wanted “new ideas and a different approach” and Democrats who favored “experience and a proven track record” in a presidential candidate. Last Tuesday’s election provided more evidence of these attitudes. Donald Trump, a businessman with no political experience, won the Republican primary while Hillary Clinton, with a long record of public service, won the Democratic primary. It is now obvious that Californians’ candidate preferences are just one example of a deep partisan fissure that has emerged in the 2016 PPIC Statewide Surveys.

We found another example of this divide when we asked about the mood of the California electorate in 2016. Most Republican likely voters (78%) said the state is going in the wrong direction while most Democratic likely voters (67%) said it is going in the right direction in our May PPIC Statewide Survey. We found a similar divide in views about the direction of the US and about whether California and the US are headed into good economic times or bad ones next year.

The job approval ratings of elected officeholders also largely depend on one’s partisan stripes. President Obama has an 84% approval rating among Democratic likely voters and an 85% disapproval rating among Republican likely voters. This party split is also clear in the approval ratings of the US Supreme Court, California US Senators Barbara Boxer and Dianne Feinstein, Governor Jerry Brown, the California Legislature, and even local House members and state legislators. The only area of consensus is the overwhelming disapproval of the US Congress (84% Republican, 81% Democrat).

There are also large and consistent partisan divides over the role of government. The vast majority of Republicans—83%— want a smaller government with fewer services, while a strong majority—69%—of Democrats say they prefer a bigger government with more services.

Similar partisan differences are evident when Californians are asked about gun laws, government regulation, and economic inequality. While 64% of Republicans say the government goes too far regulating guns, 79% of Democrats say it does not do enough. A majority of Republicans—66%—say government regulation does more harm than good, while 76% of Democrats say government regulation is necessary to protect the public. And 68% of Republicans say the government should not be doing more to reduce the gap between the rich and poor, while 79% of Democrats say it should be.

Last but not least is the partisan gulf on immigration and race. There are also different perspectives on the proposal to build a wall along the entire Mexico border (60% Republicans favor; 87% Democrats oppose) and whether immigrants are a burden (66% Republicans) or a benefit (78% Democrats) to California. Most Republican likely voters (58%) say there is equal treatment in the criminal justice system while most Democratic likely voters (80%) say that blacks and minorities do not get equal treatment.

Looking ahead to the November ballot, there are starkly different views on extending a temporary income tax on the wealthy, with 68% of Republicans opposing the extension of this Proposition 30 tax and 80% of Democrats in favor of it. The results are similar when our survey asked about a state school bond (50% Republicans no, 82% Democrats yes) and marijuana legalization (56% Republicans oppose, 69% Democrats favor).

How will California’s partisan divide impact the November election? Democrats now have an 18-point edge over Republicans in voter registration (45% to 27%).The PPIC Statewide Surveys this year also indicate that independent voters are leaning in the same direction as Democratic voters in their presidential, US Senate, and ballot choices, and their overall outlook, approval ratings, and policy preferences. In this context, the May PPIC Statewide Survey found that the state’s likely voters favor the presidential candidate who stands for experience and a proven track record over the presidential candidate who stands for new ideas and a different approach. Still, Republicans overwhelmingly support their party’s standard bearer and appear to be aligned with his perspectives and policies.

California seems poised to maintain its blue status this fall. However, the geo-political segregation of the state —with Republican pockets of strength in California’s northern, inland, and rural regions—means that federal and state legislators will be elected to represent the views of voters who are worlds apart. Indeed, the political polarization and antipathy of this year’s election may result in a California Congressional delegation that will contribute to Washington gridlock and a California Legislature that will struggle to find common ground on solutions to the many challenges facing California’s future.

A Turnaround for Voter Turnout?

The recent primary offered signs of improvement for California’s abysmally low voter turnout. Recent elections have seen some of the worst turnout in the state’s history. The 2014 election cycle was particularly dismal, but 2012 also set a new low for a presidential primary election. Moreover, California has been lagging behind other states in both registration and turnout.

However, there has been a large surge in new registrants over the last few months, and the California Secretary of State currently estimates that almost 9 million Californians participated in the 2016 presidential primary election, compared to only 4.5 million in 2014 and 5.3 million in 2012.

If we look at the share of voting-eligible residents who have registered in time for each of the last 18 primary elections, California’s registration rate has always fallen within a fairly narrow band—from a low of 66% in 1988 to a high of 75% in 1996. In this context, the 2016 registration rate might be seen as a disappointment. Compared to the same point in the 2012 primary election cycle, the registration rate has remained largely unchanged, though it is still comparatively high when viewed in the context of the past several decades.

How can we square this result with the reported surge in new registrants? The registration rate typically drops some between elections as county registrars purge voters who have moved or died from the registration rolls, and relatively few new voters sign up to take their place. This decline was especially large between fall 2014 and the beginning of the primary season this year. Given that baseline, a flat registration rate is consistent with a surge of new registrants, and must be considered something of a success.

More to the point, these registrants turned out to vote at a higher rate than we have seen in any primary since 2008. The estimated 8.9 million ballots translates to a turnout rate of about 50% among registered voters. That sits comfortably in the broad average of California’s presidential primary turnout, and marks a considerable improvement over 2012.

In fact, California’s presidential primary turnout now shows no clear sign of decline since 1984; it may even be holding its own relative to other states. But midterm turnout is a different story. There is a much longer downward trend for such elections, both viewed on their own and relative to trends in other states.

On balance, there are signs of recovery from the low turnout levels of 2012 and 2014, despite concerns that California’s late presidential primary would discourage participation. Whether this improvement will be sustained into the fall—and whether things will turn around for midterm elections in 2018—of course remains to be seen.


A Weatherman Explains California’s Volatile Climate

What does the future hold for California’s weather and climate? Is drought the new normal? And what about La Niña? We talked to Daniel Swain—founder of the popular California Weather Blog and a Stanford University climate scientist—about our volatile climate.

PPIC: La Niña is looming, bringing the possibility of another dry winter. What issues does it raise for the state?

Daniel Swain: It’s ingrained in California folklore that El Niño means rain and La Niña means no rain. Climate scientists often emphasize that the effects of both can be highly variable in California. El Niño and La Niña do give us much more predictability than we would have in a typical year, but that’s not always enough to help us predict exactly what’s going to happen. Last year we had a bit of a predictive failure when a very strong El Niño didn’t translate to extremely wet conditions for California as a whole. Northern California got a break this winter, with near-average precipitation. It didn’t actually earn back its accumulated water deficit, but at least it didn’t get larger. The La Niña situation is even more uncertain, bringing a wider range of possible outcomes than with El Niño. But it’s reasonable to say there is an increased risk of dry conditions this coming winter. So La Niña is certainly not good news. Another dry and warm winter would be bad news for the environment and groundwater, because these systems haven’t recovered from previous dry winters.

PPIC: Talk about the role of climate change in the California drought.

DS: There are two things to think about: what’s going on with precipitation and with temperature. We’ve seen record warmth by a really wide margin for most of the latest drought. It’s been a much more severe drought than it would have been with cooler temperatures and the same amount of rain. These extremely warm temperatures are clearly linked to global warming. The question of precipitation is much harder to answer. There hasn’t been much of a trend in California’s average precipitation. But that doesn’t mean the character of precipitation isn’t changing—in fact, we’re seeing an increase in atmospheric patterns associated with both very dry and very wet conditions. The central cause of our really dry conditions during the present drought is the “ridiculously resilient ridge” anchored over the Pacific, which has been keeping big storms away. The question of whether or not global warming affects the risk of very low precipitation years is essentially equivalent to asking whether climate change has increased the chance of big ridges like this—and recent research suggests that it does. Between our high confidence in the role of rising temperatures and the less-certain linkage to these ridge patterns, we can say there is a substantial climate change fingerprint on this drought.

PPIC: Climate scientists have made it clear that we can’t attribute a single event to climate change, but at what point do we start talking about “a new normal” in California?

DS: It’s quite clear that global warming is rarely if ever the singular cause of an extreme climate event—there is always some degree of weather or randomness involved. A more important question is: does global warming influence the likelihood of a specific event? We have high confidence that global warming has increased the likelihood of drought in California. It’s clearly not the only factor, but asking the question in this way provides a useful frame for evaluating risk. As for “a new normal,” it’s pretty unlikely that California’s future will be characterized by a permanent shift to low rainfall. The state’s climate is already characterized by extremes—we see a lot of year-to-year variation, particularly in precipitation. A more useful way to think about our certainly warmer future is to ask whether the driest or wettest years are occurring more frequently or more intensely. Having wider swings between drought and flood—that might actually be the new normal.

One bit of good news is that we’re getting a lot better at predicting atmospheric rivers, which bring our biggest rain storms. We may be able to use these much improved forecasts to allow more leeway in managing water storage in reservoirs. Our increasing ability to forecast weather is going to give us new ways to address our water challenges—to better manage increased risk.

Learn more

Read California’s Water: Climate Change and Water (from California’s Water briefing kit, April 2015) Read Daniel’s California Weather blog

Assessing the Top Two Primary

With the voting this week, California has now entered its third election cycle with a “top two” primary. This system marks a radical departure from the “semi-closed” approach in place from 2002 through 2010. Under that system, those voters registered with a party could vote only for candidates of that party. By contrast, the top two gives all voters the same ballot so they can vote for whomever they choose, regardless of party, and the two candidates with the most votes (again regardless of party) advance to the fall.

Among other goals, supporters of the top two hoped that the relatively open nature of the system would encourage more candidates to run and would lead to closer outcomes. There was also a general hope that it would give a leg up to candidates who were not favored by the Democratic and Republican Party establishments. How has the system performed and what do the results indicate?

For the state senate and US House, far more candidates under the top two have faced at least one candidate from their own party, a trend that shows no sign of letting up in 2016. But intra-party challenges for the assembly have faded to the point where such competition is not much more common than before the reform. The top two has actually discouraged some major-party candidates in heavily partisan districts from running, since such candidates are no longer guaranteed a place on the fall ballot. The share of such races without major party competition has declined from the highs of 2012 for state senate and US House races (7% now, 13% 2014, 19% 2012), but it continues to be high for the assembly (25% now, 25% 2014, 14% 2012).

What about threats to the party establishment? Incumbents have had something of a bumpy ride under the top two. But most of that can be pinned on the immediate chaos of the 2011 redistricting. The new districts were drawn by an independent citizen commission with little or no regard for incumbency and prompted many incumbents to retire or run for another office in 2012. Things have settled down quickly since then. Sitting members of the assembly are actually less likely to step down now than before the era of the top two.

In fact, on average the top two has been fairly kind to establishment candidates. In 2012 and 2014, every incumbent advanced to the fall campaign, as did almost every non-incumbent endorsed by a major party (205 out of 225). This election cycle is no different: all incumbents, and 103 of 117 endorsed non-incumbents, have advanced. By contrast, just 2 of the 50 minor party or independent candidates on the ballot have advanced, and in both cases, they were running against an otherwise uncontested Democrat.

Finally, while outcomes have been closer under the top two, competition has dropped off over time. Under the semi-closed primary, the gap between the first- and second-place candidates averaged 32 points; it averaged 16 points between the second- and third-place candidates (a divide that decides the finalists in a top two system). Under the top two, the gap between first and second has grown from 22 points in 2012 to 27 in 2014 to 31 in 2016; the gap between second and third has remained flat, between 11 and 13 points. A large share of races this primary election—73%—have produced one candidate with more than 50% of the vote. This number is still lower than the 88% under the semi-closed primary, but it is similar to the 72% in 2014 and much larger than the 59% in 2012. In most cases these races will be uncompetitive in the fall.

Of course, such broad averages may not be the best way to evaluate the system, since specific races have undeniably been changed. This is most obvious for the same-party contests, which could never have occurred under the semi-closed primary. So far there will be 22 such races this election cycle, similar to but slightly lower than the 25 in 2014 and 28 in 2012. At least some of these same-party races will pit a moderate candidate against a more liberal or conservative one, and some of these moderate candidates might win.

In fact, moderate candidates might succeed despite a disengaged electorate. The best evidence suggests California voters under the top two have tremendous difficulty separating the moderate candidates from the rest, and they rarely cross party lines when voting. In fact, the total Democratic and Republican votes in the primary can be predicted well by looking at a district’s party registration. But a dramatic change in voter behavior may not be required. If moderate candidates are more willing to run, and if they have the means to promote themselves, some of them are likely to win. The result would not be a wholesale change in the state’s leadership, but it might cause an important shift at the margins.

Video: Upgrading Technology in California Schools

When it comes to providing 21st century technology to all California public school students, the challenges loom large. Money and training are the two most prominent. A new PPIC report estimates that it would cost $3.8 billion over three years to provide bandwidth for digital learning, issue one device to every middle- and high-school student, and have one IT staffer for every 300 computing devices.

But leadership and collaboration are also powerful tools, and they can help the state, districts, and schools make progress. That is a key takeaway from a panel discussion on education technology sponsored by PPIC last week.

Geoff Belleau, an education program consultant to the California Department of Education, and Ling Ling Chang, Southern California assemblymember, each mentioned public-private partnerships—with Internet providers and other businesses—as ways to fund and deliver technology to California students.

Darryl Adams, superintendent of the Coachella Unified School District, showed how far leadership and collaboration has taken his district, which has plenty of challenges. In his district, 100% of students are eligible for free or reduced-price meals and 60% are English Learners. Thousands of students are the children of farm workers, and many are undocumented. Many lack high-speed Internet access.

Adams turned to the voters, who approved a local bond measure to fund technology upgrades, and uses federal and state funds for training and implementation. The district provides a tablet to every student from preschool through high school. School buses in the 1,250-square-mile district are equipped with WiFi routers and solar panels to connect students to the Internet. After the buses have made their rounds, they are parked near trailer parks or other areas where homes lack connectivity, effectively serving as mobile hot spots. The district has also developed its own program to train teachers to integrate digital learning in the curriculum.

There are still problems, he acknowledges, but his community has demonstrated the will to solve them. And failure is not an option.

“I’ll put a router on a pigeon and fly him around the neighborhood if I have to,” he said. “Kids have to be connected.”

Anne Neville, director of the California Research Bureau summed up, “It doesn’t all have to be perfect. And it all doesn’t have to be done everywhere for things to start happening.”

Patrick Murphy, PPIC research director, moderated the panel.

Before the discussion, Niu Gao, research fellow at PPIC, and author of the new report on technology provided an overview of her findings.

Learn more

Read the report Upgrading Technology Infrastructure in California Schools