California’s Arrest Rate Reaches a 50-Year Low

Recently released arrest and crime data from the California Attorney General’s Office reveal some noticeable recent changes. Until last year, California’s felony arrest rate trend had closely mirrored the state’s crime rate trend for 20 years. We would expect the two trends to move in similar ways, since most of the crimes reported and used to calculate the crime rate are felonies. But the trends diverged in 2015 after passage of Proposition 47, which reclassified a number of drug and property crimes from felonies to misdemeanors. The felony arrest rate dropped dramatically in 2015, by 30%, while crime rates went up—the violent crime rate rose by 8.4% and the property crime rate by 6.6%. The drop in felony arrests was partly offset by a very noticeable increase in misdemeanor arrests. Still, the total number of arrests dropped by almost 52,000.

California’s total arrest rate—which has been declining over the past two decades—is now at a historic low of 2,944 per 100,000 residents; this is less than half the peak rate of 6,765 reached in 1989. What is arguably more noteworthy is the even greater drop in the felony arrest rate, which, at 806 per 100,000 residents, is about a third of the 1989 peak rate of 2,052. The 30% drop in the felony arrest rate in just one year, 2014 to 2015, accounts for more than a quarter of the peak-to-bottom decline. Misdemeanor arrests, by contrast, increased from 1,979 to 2,138, or 8%.

The data strongly indicate that Proposition 47 is a major factor in these changes. First, monthly arrest data show abrupt changes in drug and property arrests in November 2014, the month Proposition 47 went into effect. Second, the drop in felony arrests was almost exclusively for drug and property offenses, while the increase in misdemeanor arrests was almost entirely for drug and property offenses. Arrests for motor vehicle theft, which continues to be a felony after Proposition 47, is the only area of increase. Possibly in response to the 13% increase in auto thefts in 2015, motor vehicle theft arrests went up by 26%.

Although the total number of property crime arrests dropped, the decrease in arrests for drug offenses was more significant. Felony drug arrests declined by about 92,000, while misdemeanor drug arrests went up by more than 70,000. The net drop of about 22,000 drug arrests accounts for more than 40% of the total decline.

The new data raise many questions, including whether the recent changes to our criminal justice system are affecting public safety. Also, does the decline in drug arrests mean that drug use has declined or that fewer offenders with substance abuse problems are receiving necessary and effective treatment? Future research needs to address the role of reforms like Proposition 47 on crime, offenders, law enforcement, and counties’ ability to provide necessary treatment and programming.


Primary Takeaways

With the release of the official Statement of the Vote on Friday, the 2016 California primary is now in the history books. The final tally by the Secretary of State offers many new insights for those of us who closely follow elections and polling in California. This year’s results deserve a particularly close look because of the extraordinary presidential primaries and the first-ever top-two primary for an open US Senate seat.

My colleague Eric McGhee has provided an excellent analysis of primary turnout and the outcomes of top-two legislative district races in two earlier PPIC blog posts. I’m going to focus on some trends that caught my attention in the final numbers regarding the presidential primaries, the top-two US Senate primary, the state ballot measure, voter engagement, and turnout in key regions. 

  • Presidential primaries. Secretary Hillary Clinton (2.75 million) and US Senator Bernie Sanders (2.38 million) were the top-two vote-getters in the state’s presidential primaries. These two Democrats had much more support in their party’s open primary than businessman Donald Trump (1.67 million) had in a closed Republican primary with no active opposition. In addition to facing a sizeable disadvantage in voter registration (45% Democrat, 27% Republican), the presumptive Republican nominee starts the fall election season with one million fewer voters in the state’s primary than the presumptive Democratic nominee. For Republicans, this raises questions about their presidential selection process and whether to have an open primary in the future that invites independent voters to participate. For Democrats, the immediate issue is how many of those devoted, young Sanders supporters will show up to vote this fall.
  • US Senate top-two primary. Attorney General Kamala Harris won more votes (3.00 million) in the primary for the open US Senate seat than Clinton did at the top of the ballot. US Representative Loretta Sanchez finished a distant second (1.42 million) to Harris, setting up the first single-party race for US Senate in the top-two era. As a group, the 12 Republican candidates received more votes (2.15 million) than the second-place Democratic finisher. For Republicans, this raises questions about future strategies to ensure that their party’s voters have a candidate who can qualify for a top-two spot in November. And the question of how many Republicans will opt out of voting for a US Senator this fall will ultimately affect both parties.
  • State ballot measure. Proposition 50 was the biggest vote-getter (5.60 million votes, 76% yes) on the June ballot. A byproduct of recent political scandals, it allows the legislature, with a two-thirds vote, to suspend members without salary and benefits. The legislature placed it on the June ballot with bipartisan support. Proposition 50 received scant media mention and little organized opposition. Its success is consistent with the historically high pass rate for legislative ballot measures found in a recent PPIC report. This trend bodes well for state bonds to fund parks and housing that the legislature may place on the ballot in the fall. Citizens’ initiatives and referenda have been moved to the November general election, and these types of state propositions have a much lower pass rate. That means voters face a cluttered ballot this fall that includes 14 citizens’ initiatives, two legislative initiatives, and one referendum, in addition to local measures. How many will voters decide are worthy of their interest and support? 

In Los Angeles and two of the state’s fastest-growing areas, turnout among registered voters was lower than the state average.

  • Voter engagement. There was a surge in online voter registration as Californians waited for their say in the presidential primaries. Voter engagement was a welcome development after primary turnout reached a new low in June 2014 (4.46 million, 25% registered voters, 18% eligible adults). Turnout this June (8.55 million, 47.7% registered voters, 34.5% eligible adults) reflected a turnaround, although it was well short of the record-setting February 2008 presidential primary (9.07 million, 58% registered voters, 40% eligible adults). Turnout was probably depressed by two events: the elimination of Trump’s competition weeks earlier and the declaration on the day before the primary that Clinton was the presumptive Democratic nominee. Once again, there will be questions about whether it’s in California’s best interests to vote at the end of the primary season in the presidential sweepstakes.
  • Turnout in key regions. Five major counties had lower registered voter turnout than the state average: Los Angeles (41%), Fresno (41%), Kern (41%), Riverside (44%), and San Bernardino (43%). Five less populous counties in the Central Valley also had below-average turnout (41% Kings, 42% Merced, 42% San Joaquin, 44% Stanislaus, 45% Tulare). Moreover, fewer than one in three eligible adults voted in the primary in all 10 of these counties. In sum, these are troubling trends in the state’s most populous county (Los Angeles) and its two fastest-growing areas (the Central Valley and Inland Empire). Are there practical impediments to voting in these regions or is this a symptom of a deeper civic malaise? Until they are fully addressed, these regional disconnects will seriously limit the size and diversity of the state’s electorate.

The 2016 primary results point to several trends to watch in the November general election and beyond. Furthermore, the issues that surfaced this June will likely have longer-term reverberations on the primary process and civic engagement going forward.

At PPIC, the race for US Senate stands out as uniquely worthy of public attention. We invited the two candidates to participate in a conversation with me about the future of California on September 16. Stay tuned for more information about whether the candidates accept our invitation and how you can attend or watch this PPIC event.

Getting Students from High-Need Schools into the UC System

The newly approved state budget contains two strategies to enroll more students from disadvantaged backgrounds in the University of California (UC) system and other postsecondary institutions. These spending commitments are designed to increase college readiness and access for the state’s most vulnerable students.

First, the state allocated $200 million to the new College Readiness Block Grant program, which funds “additional services that support access and successful transition to college” for three categories of students: English Learners, students from low-income families, and foster youth. This grant may support a variety of activities related to college readiness—including efforts to increase the number of students completing college preparation courses, such as the a–g course sequence required to attend UC. The College Readiness Block Grant is available to any school that serves students from these designated categories.

Second, the budget also includes funding for the UC system to monitor and increase application, admission, enrollment, and graduation rates among students from “high-need” schools—high schools where 75% or more of the students fall into one of the categories above. Currently, we know little about whether students from high-need schools attend UC and how to get more of them to enroll. I combined data on graduation from public schools and UC enrollment to explore these questions.

What do we know about high-need schools?

In 2015, about 38% of California’s high schools (480 total) were high need based on high rates of enrollment for English Learner, low-income, and foster care students. These schools educate about 34% of all high school students in the state. High-need schools also serve higher proportions of students traditionally underrepresented at UC: about 43% of the African American students in the state and about 51% of California’s Latino students.

High-need schools are less likely to produce graduates who have completed the a–g course sequence required to attend UC. The percentage of all graduates who complete a–g courses at the typical (50th percentile) high-need school is 39%, compared to 49% at regular schools. However, there is a lot of overlap. For example, the top quarter of high-need schools have higher percentages of a–g graduates than the bottom half of regular schools.

Do graduates from high-need schools enroll at a UC?

On average, students from high-need schools are slightly less likely to enroll in a UC. About 5.4% of all graduates enroll in a UC at a typical high-need school, compared to 6.5% for a typical regular school.

However, a–g completion rates are likely driving the difference in UC enrollment between high-need schools and regular schools, since students at regular schools are more likely to have completed a–g courses. When examining the number of UC enrollees compared to the number of a–g graduates a school produces, we see no difference between regular and high-need schools.

The College Readiness Block Grant program’s focus on helping to prepare students for college might be an effective strategy to increase UC enrollment from high-need schools that would not require many changes to admissions policy in the UC system. Evidence suggests that improving a–g completion rates at high-need schools will help boost UC enrollment of graduates from these schools.

Top figure note: Data from California Department of Education. Spring 2015 graduates. N=1,276 schools.

Bottom figure note: Data from California Department of Education, University of California, and California Postsecondary Education Commission (CPEC). Spring 2015 graduates compared to fall 2015 enrollees. “All graduates” refers to the ratio of graduates to enrollees from the school. “A–G graduates” refers to the ratio of a–g graduates to enrollees from the school. Fifteen percent of schools were not in the crosswalk provided by CPEC and are not used in the comparison of enrollees. Another 8% are not represented in the UC data set, but are present in the UC data and crosswalk, and thus are given zero enrollees for the purpose of these figures. N=1,072 schools.

Implementing California’s Groundwater Law

What will it take to successfully manage groundwater in California? This was the topic of a recent workshop jointly held by UC Water and the PPIC Water Policy Center. The workshop brought together researchers, policy makers, and water managers to reflect on the challenges of implementing the Sustainable Groundwater Management Act in California’s Central Valley, the state’s leading agricultural region. Here are some key takeaways.

  • Groundwater recharge should become more intentional. Farmers are the biggest users of groundwater in the Central Valley—but they also do the most to replenish it. When they apply water to their fields, crops don’t use all of it—some water seeps down and recharges underground aquifers. However, to achieve sustainable use in many aquifers, the process of recharge will have to become more deliberate and widespread in the Central Valley. UC Water experts presented research from several experimental sites across the state showing that recharge can be increased in a variety of ways. Depending on local circumstances, some possible solutions include having farmers flood their fields with excess winter runoff, setting back levees and using floodplains as infiltration grounds during flooding, and engineering recharge basins or using injection wells to direct water underground. Some of this is already happening in different parts of the valley. But scaling up recharge efforts to a magnitude large enough to bring overdrafted basins into balance will likely mean developing hundreds of additional small, decentralized projects across the valley.
  • It’s all about incentives. Recharge is a local process, but the benefits can be regional. To make recharge projects sprout in the Central Valley, incentive mechanisms will be needed to credit individuals who participate. One promising way of incentivizing farmers to recharge was presented by UC Santa Cruz researcher Andrew Fisher, who described experiences from a pilot project in the Pajaro Valley on California’s Central Coast. That project’s goal is to establish a system that provides rebates to those who recharge groundwater.
  • Accounting will be critical.California’s groundwater law requires users to establish local groundwater sustainability agencies (GSAs), which will have authority to monitor, measure, and regulate pumping and to fund recharge projects. Before passage of the law, California generally did not require monitoring of groundwater pumping or restrict its use, despite continued declines of groundwater levels in many parts of the state. As a result, there is little historical data on groundwater pumping and storage for Central Valley groundwater basins. At least some GSAs are likely to begin metering agricultural pumping, which can serve both as monitoring and enforcement. As GSAs make these important decisions, it will be important for them to strive for having widely available, transparent estimates of groundwater use and recharge volumes. Such data are critical to estimate groundwater budgets and provide a framework for water trading. For instance, crediting farmers for recharge is impossible if we don’t know how much water they pump out and how much they recharge.
  • No silver bullets. While recharge is promising, some reductions in groundwater use may also be necessary to achieve sustainability in some areas. For example, in parts of the southern Central Valley, there may not be enough extra surface water to justify building new recharge infrastructure. Many places across the valley may not have the right soil composition for recharge. Fortunately, California has extensive infrastructure to move surface water from where it is more plentiful to where it is scarce. As locals begin to implement the groundwater law and seek to reduce overdraft, water trading can help increase the efficiency and reliability of water allocation.

The workshop showed that there is a high level of interest in discussing solutions to California’s groundwater management challenges. Finding more opportunities to bring researchers and practitioners together to discuss ongoing work and identify ways to collaborate is an important step forward in the state’s path toward sustainable groundwater management.

Learn more

Read “The Coming Groundwater Revolution” (PPIC Blog, January 6, 2016)
Read our policy brief “California’s Water: Storing Water” (from California’s Water briefing kit, April 2015)
Visit the PPIC Water Policy Center

Commentary: New Law Could Change California’s Electorate

This commentary was published in the Washington Post’s “Monkey Cage” blog today, Monday, July 11, 2016.

Supporters of California’s New Motor Voter Act are right to see its great promise, but how the law is implemented will be far more important than many have suggested.

Read the full commentary on washingtonpost.com.

A Generational Challenge for Higher Education

Generational progress in educational attainment has long been a critical component of societal improvements in well-being and economic mobility. For many decades in California and the United States, the expectation has been that children will eventually attain a higher level of education than their parents. And for many decades, that is exactly what occurred.

In recent years, however, generational progress has stalled. The share of Californians ages 25–34 with at least a bachelor’s degree (33%) is only very slightly higher than the share of bachelor’s-degree holders among the 55–64 age group (31%). Compared to countries that are part of the Organisation for Economic Co-operation and Development (OECD), an international organization of 34 member countries that provides data on economic and education trends, California ranks 1st in the share of older adults holding at least a bachelor’s degree (or equivalent), but only 22nd among younger adults.

Unlike almost all OECD countries, California has seen very little generational progress (2 percentage points). In stark contrast, Korea, Poland, and Ireland witnessed gains of 23 or more percentage points in the share of bachelor’s-degree holders among younger adults, relative to older adults. Because educational attainment is the single most important determinant of employment and wages, this lack of progress has implications not only for individuals but also for the state’s economy.

Not all states share California’s lack of progress. Among the 30 largest states, California ranks 21st in generational gains. New York, Iowa, and Illinois have all seen some of the largest improvements (10 to 12 percentage points) in the share of bachelor’s-degree holders among younger adults, compared to older adults. In Massachusetts (not shown), half of all young adults have a bachelor’s degree, compared to 40% of older adults.

A few states, including Arizona, Colorado, and Oklahoma, actually saw generational regress, meaning older adults are more highly educated than younger adults. Despite the lack of generational progress, Colorado still has a relatively high share of young adults (37%) with at least a bachelor’s degree.

What is most worrisome for California is that the lack of generational progress is coupled with a relatively low share (33%) of young adults with college degrees. Connecticut (not shown) has not seen much generational progress either, but even so, over 40% of young adults in that state have a college degree.
These differences in generational progress (or lack thereof) are not necessarily attributable to differences in education systems across states. For example, in Colorado, many highly educated older adults have migrated to the state from elsewhere.

The tremendous challenge facing California and the key to improving economic well-being in the state is to increase educational attainment among young adults. PPIC has identified key strategies to do this:

  • Improve access to four-year colleges.
  • Increase transfers from community colleges to four-year colleges.
  • Raise graduation rates for those already in college.

By taking steps now, the state and higher education leaders can put California back on the path of strong generational progress.

Chart source: OECD and American Community Survey.
Figure notes: Charts display select countries or states, including those with the highest and lowest generational gains.

Learn more

Read Higher Education in California: Addressing California’s Skills Gap
Visit the PPIC Higher Education Center

Commentary: Why We Expect Sanders Voters to Have Impact in November


This commentary was published in the Sacramento Bee on Sunday, July 3, 2016.

What’s next for Bernie Sanders supporters in the wake of a disappointing loss? They will find ballot initiatives – and one in particular – of great interest in California’s November election. For this reason, we expect to see the Sanders voters return to the polls and have a broad impact on election outcomes.

Read the full commentary on sacbee.com.

Brian Gray Joins PPIC Water Team

The PPIC Water Policy Center is pleased to welcome Brian Gray as our newest staff member and senior fellow. He brings extensive experience in water and environmental law. He is a professor emeritus at the University of California, Hastings College of the Law in San Francisco, and has been an adjunct to the Water Policy Center since last year.

Gray has published numerous articles on environmental and water resources law, and has served as a key collaborator on PPIC water reports, including the 2011 book, Managing California’s Water: From Conflict to Reconciliation, and several of our recent contributions on the drought, such as Allocating California’s Water: Directions for Reform (2015) and the just-released Managing Water for the Environment During Drought: Lessons from Victoria, Australia.

“My work with PPIC these past seven years has been the richest and most rewarding of my career,” Gray said. “I am honored to be a member of the Water Policy Center, and I look forward to continuing to work with my talented and inspiring colleagues here at PPIC, in our research network, and in the broader water resources policy community.”

Gray holds a JD from the University of California, Berkeley, and a BA in economics from Pomona College. In addition to his work with PPIC, Gray has contributed in a variety of other ways to environmental policy work. He has argued before the California Supreme Court and the US Court of Appeals in cases involving wild and scenic rivers, water pricing reform, and water rights and environmental quality. He is a recipient of the William Rutter Award for Excellence in Teaching and the UC Hastings Outstanding Professor Award.

Learn more

Visit the PPIC Water Policy Center

How Much Water Does Nature Need?

California’s water-dependent ecosystems are stressed even in normal times, and the latest drought has made matters worse. We talked to Mike Sweeney—the executive director of the Nature Conservancy’s California chapter and a member of the PPIC Water Policy Center’s advisory board—about the troubled condition of our natural environment and how to improve it.

PPIC: How much water does nature need?

Mike Sweeney: In most places, the answer is “more than it’s getting now.” But it’s as much about timing and temperature as it is about quantity. Research shows that taking more than 20% of a river’s natural flow at any given time can negatively impact the river’s function and ecosystem. Today, our rivers receive about half of their historic natural flow. Clearly, we have a problem.

That said, there isn’t a simple answer to the question, “How much water does nature need?” Nature’s needs are dynamic, not static. Many species need surges of water at precise times and places. We’ve heavily engineered our water system to store water during wet periods and to move it to where people need it. This changed not only how much water flows through our river basins but also when it flows, often undermining conditions most favorable to native species.

We need to get specific about when and where nature needs water and build solutions that address these needs. That can include things like leasing water at key times of year from other water users or managing a dam so that water flows when it is needed and in the right amounts—rather than at a set volume all the time, which is often the current practice.

PPIC: What kinds of solutions might help resolve the conflict over water for the environment?

MS: Fish are in trouble: 88% of the state’s native fish species are already extinct, threatened, or endangered and at risk of extinction. But these days, farmers are often at odds with the people trying to protect nature, whether that’s in the Central Valley or up north along the Shasta River. Farmers are frustrated because regulators cut back their access to water.

What if we create solutions that work for both? There are ways to meet the needs of farmers and fish. Farmers can be part of the solution by helping to find ways to change the timing of water use—such as storing water in the winter for agricultural use during summer, rather than tapping rivers and streams when fish need it most. We need to get smarter about managing the wet times and dry times to provide water for both farms and fish.

PPIC: If you could change one thing about how California water is managed, what would it be?

MS: In California, we don’t do a good job of measuring how much water is flowing in our rivers and streams. That makes it hard to know how much really needs to be there for nature and when you should cut back water use on farms and ranches to provide water for fish. So the most important thing to change is to proactively manage water to meet nature’s needs using the best, state-of-the-art information we can get. To do that, we have to measure water in real time so that we have accurate data about where water is flowing. This would make it far easier to optimize water for cities, farms, and nature.

Learn more

Read “California’s Environment Needs a Water Budget” (PPIC blog, December 14, 2015) 

Read “Lessons on Sustaining the Environment During Drought” (PPIC blog, June 23, 2016)
Visit the PPIC Water Policy Center’s ecosystems resource page

The Rise and Fall of Enrollment at For-Profit Colleges

Increased demand for postsecondary education in California has contributed to dramatic growth in enrollment at for-profit colleges. But in recent years, this trend has begun to reverse. Many students who saw for-profit colleges as a viable alternative to public and private nonprofit institutions are in debt and without a degree, and some for-profit colleges are now the focus of state and national investigations, lawsuits, and sanctions.

California is home to almost 400 private, for-profit postsecondary institutions that are eligible to participate in federal financial aid programs. These colleges vary widely in size and mission, from small independent vocational schools enrolling only a few dozen students to large national chains that enroll thousands and offer graduate as well as bachelor’s degrees. Altogether, for-profit colleges make up more than half of all postsecondary institutions in the state and enroll one in eight postsecondary students.

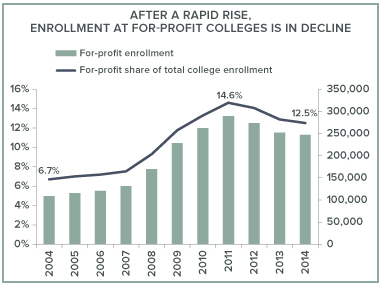
Enrollment at for-profit colleges in California almost tripled between 2004 and 2011, growing from 109,000 students to 289,000 students (as measured by full-time equivalent enrollment). Over the same period, enrollment in other colleges changed very little (increasing only 12%). By 2011, one in seven college students attended a for-profit institution. For-profit colleges enrolled more students than the University of California system and all private nonprofit colleges in the state.

But since 2011, enrollment in for-profit colleges has declined by more than 40,000 students, a 15% drop. Every sector of for-profit colleges experienced declines, with the sharpest reduction (29%) occurring among two-year institutions. Meanwhile, public and private nonprofit colleges saw slight enrollment increases during this same time frame.

What accounts for the rise and fall of enrollment at for-profit colleges?

Certainly, students were attracted to the easy access and convenient course times that for-profit colleges offered—something that other colleges can and have been learning from. But investigators have also found that a number of for-profit colleges engaged in predatory marketing practices, targeting vulnerable students and making false promises about job placement. Such practices may have helped enrollment growth at first, but as these practices became more well-known, and as regulatory and legal actions became more widespread, enrollment began to decline.

The decline also coincides with restrictions on institutional eligibility for the state’s large financial aid program, Cal Grants. In 2011, institutions with a high share of students receiving federal loans were required for the first time to meet minimum standards for graduation rates and loan default rates for their students to remain eligible for Cal Grants. In 2014, only 40 of the 383 for-profit colleges in California met these standards and remained eligible for Cal Grants. Enrollment declines were smaller (9%) at the for-profit colleges that retained Cal Grant eligibility. (Students at colleges that do not meet the minimum standards for Cal Grant eligibility can still receive federal financial aid.)

The future of for-profit colleges is uncertain. In the near term, enrollment losses are likely to continue. Though not yet available, 2015 enrollment data will show further declines due to the closing of Corinthian Colleges, the parent company for Heald, Everest, and WyoTech colleges, in California. Those institutions enrolled over 15,000 students in fall 2014.

Meanwhile, the US Department of Education has taken aim at the Accrediting Council for Independent Colleges and Schools (ACISC), the largest accrediting agency of for-profit colleges in the nation. Continued actions such as this one could eventually lead to a loss of accreditation and hence federal funds for hundreds of for-profit institutions nationwide. Without federal funding, many for-profit colleges would be unable to operate, leading to further enrollment declines.

Chart source: Integrated Postsecondary Education Data System (IPEDS), fall full-time equivalent enrollment in California.

Learn more

Visit the PPIC Higher Education Center