Testimony: Paying for California’s Water Needs

How can we fund California’s most pressing water needs? And where are we falling behind in paying for a water system that works for all? A hearing convened by the Senate Natural Resources and Water Committee yesterday looked at these and other questions. I joined other speakers from nonprofit groups focused on water, local governments, and water agencies to discuss these challenges and how to address them.

Lester Snow, executive director of the California Water Foundation, set the stage, stating that California is “falling behind in central water resource investments, especially in terms of public health and climate adaptation.” Investing in watershed health and ecosystems will help our water supply and our ability to weather climate change, he noted.

My testimony focused on the need for adequate funding to ensure the long-term success of our water system. In some areas—such as water supply and wastewater treatment—we’re doing fairly well in keeping up with needed investments. As documented in our report What If California’s Drought Continues?, investments in water supply for cities and suburbs helped us weather the current drought. It will be important to maintain the momentum in those areas. But in other key areas, we’ve found significant funding gaps, including safe drinking water in many rural areas, ecosystem management, stormwater management, and flood protection. The total annual funding gap for these “fiscal orphans” is roughly $2–$3 billion.

Local governments have the most responsibility when it comes to funding water systems. But there are looming concerns—including rising costs to address aging infrastructure and new treatment standards—and more uncertainty about the ability of local agencies to raise rates to cover them.

The state’s funding mechanisms “remain fundamentally unchanged,” Snow noted, even as California strains to meet various needs for water. I noted that California must go beyond water bonds, which at best provide $1 billion per year in support, to create the sustainable funding we need for this essential service.

Snow and I both spotlighted how efforts intended to improve accountability have made it more complicated to fund water systems locally. Three constitutional reforms passed by voters since the late 1970s—Propositions 13, 218, and 26—changed the way Californians pay for water services. These measures have made it more difficult for agencies to raise money locally for water infrastructure and services.

Laurel Firestone, co-executive director of the Community Water Center, talked about the many challenges facing California’s rural poor and underserved communities, where access to safe and reliable drinking water has been a particularly challenging problem in recent years.

Addressing our ability to provide a safe water supply for the poor, enable local water providers to charge appropriate water rates to cover needed investments, and maintain healthy watersheds and ecosystems are some key areas where change is needed. In January, a second hearing by this committee will look more closely into scaling up solutions for meeting these challenges.

Learn More

View slides from Hanak’s presentation
Read the PPIC Water Policy Center’s briefing on paying for water
Read the in-depth PPIC report on water system funding


Video: Health Coverage & Undocumented Immigrants

Legislative efforts, executive decisions, and public opinion all suggest interest in expanding health coverage to California’s undocumented immigrants. The state’s decision to provide Medi-Cal benefits to undocumented children reflects that support. But the vast majority of undocumented residents in California are adults, and they make up a sizable share of residents without health insurance.

A new PPIC report finds that half of California’s undocumented immigrants—about 1.4 million—have incomes low enough to qualify for full Medi-Cal benefits should legislative proposals to offer coverage be enacted.

This week at a briefing in Sacramento, PPIC research associates Shannon McConville and Iwunze Ugo presented their report, which includes estimates of the number of undocumented immigrants across family income levels and the Covered California insurance regions. These estimates can help policymakers plan for the increase in Medi-Cal participants if coverage is expanded—which will depend on the legislature, governor, and federal courts.

Video: Farming Solutions to Weather Drought

How is California’s drought affecting farming, rural communities, and the environment? How much water do farms use, and how do they benefit the state’s economy? What are farmers doing to improve how water is managed? These were some of the big questions discussed by a panel of experts at the October 20 event “Weathering Drought: Farming Solutions for a Thriving California,” organized by the nonprofit group Sustainable Conservation and held at PPIC’s Bechtel Conference Center.

Ashley Boren, Sustainable Conservation’s executive director, moderated the discussion with Ellen Hanak, director of the PPIC Water Policy Center; Karen Ross, secretary of the California Department of Food and Agriculture; Don Cameron, general manager of Terranova Ranch; and Kat Taylor, co-owner of TomKat Ranch.

The panelists talked about a range of water-management efforts that are being tried on the state’s farms. Terranova Ranch is the site of a particularly promising approach to water storage. Cameron said the farm is building infrastructure to funnel excess flood waters from the Kings River to fields, where it will soak into the ground. This helps replenish the groundwater basin—which has dropped after serving as a vital reserve over three years of drought—as well as reducing flood risk to downstream communities. Taylor described efforts to rebuild the health of the soils—another vital store of moisture—on the grazing lands at TomKat Ranch.

While acknowledging the challenges California is facing from the drought, the panelists also described positive changes underway. Ross noted that in her travels around the state’s agricultural regions, people are talking about unprecedented levels of cooperation to help each other get through the dry times. The message she’s hearing is we’re all in this together, and we’ll get through it by working together.

Learn More

Read Sustainable Conservation’s blog about the event
Read Reforming California’s Groundwater Management (PPIC fact sheet, June 2015)
Read our report What If California’s Drought Continues? (August 2015)

Voter Registration: Not Quite Automatic Yet

The New Motor Voter Act creates a computerized voter registration process for anyone who uses the Department of Motor Vehicles (DMV) to apply for a new driver’s license, renew an old one, or change their address. The law—AB 1461—reduces paperwork and transfers voter registration information electronically from the DMV to the secretary of state. It has the potential to register millions more residents and virtually eliminate one of the most important administrative hurdles to voter participation.

However, the devil is in the details. Whether AB 1461 will result in big increases in registration will depend largely on how the law is implemented. Though the new registration process is sometimes called automatic, it does not actually register anyone by default. At its core, the law simply tells the DMV to transfer information to the secretary of state and then tells the secretary what to do with that information.

Some information is guaranteed to be there. DMV applicants will be required—as they are now—to provide their name, date of birth, address, and the like. If they don’t answer these questions, the process of getting a driver’s license stops.

Other information is less certain. The law adds two pieces of information that together determine whether DMV customers get registered to vote: first, whether they attest that they are eligible to vote, and second, whether they decline to be registered. Customers who attest to eligibility and do not decline will be added to the voter rolls. Yet unlike the other items listed above, applicants don’t currently have to answer either question to get a driver’s license.

Note also the significant difference between the two questions. The eligibility question has the secretary of state looking for a “yes”: DMV customers will not be registered unless they attest to eligibility, which means that any customer who fails to answer the question will not be registered. By contrast, the registration question has the secretary looking for a “no”: customers will be registered unless they do not want to be. That means that those who fail to answer this question will be registered, as long as they also say they are eligible.

It is hard to overstate the importance of this distinction. Research on how people make decisions has consistently demonstrated the power of the default option. People are much more likely to sign up when enrollment is the default option—even when there is an option to decline—than they are when nonparticipation is the default. The option to enroll as an organ donor when getting a driver’s license offers a particularly apt example. Many do not sign up even though it’s not very hard to do, and even if they say they are willing, in principle, to become donors. In one study, 82 percent became donors when they had to opt out explicitly, compared to 42 percent when they had to opt in.

Given this reality, the default option can be critical. If the goal is a large increase in registration, the fact that the eligibility question requires people to opt in should be a cause of concern.

This suggests a solution: the DMV should make a response to the eligibility question a condition for receiving a driver’s license. Some have already called for this approach, which is not as onerous as it may sound. Driver’s license applicants are already required to provide documented proof of legal residence, such as a birth certificate or passport. That’s a much higher hurdle than answering a single question.

In Oregon—which became the first state to adopt automated registration earlier this year—such proof of legal residence is also required, but it’s automatically treated as evidence of eligibility. No additional question is needed. If California were to require a response to its eligibility question, its system would be essentially identical to the one in Oregon on most important dimensions. In fact, by allowing people to opt out up front, the California system would be more transparent and might do a better job of preserving freedom of choice.

The California DMV could go a step further and also require a response on the registration question, thus ensuring that people know they are being registered. There is no reason to think that forcing a choice in this way would limit the law’s impact. The study on organ donor participation mentioned above found that enrollment declined only slightly (from 82% to 79%) when people were asked to make the choice explicitly. It seems fair to expect a similar dynamic with voter registration. Only those firmly opposed to being registered are likely to say “no” to registration, and that group will probably be small.

In short, AB 1461 could result in a legitimately automatic registration system similar to the one in Oregon and many other countries. Such a system would eventually bring the vast majority of eligible unregistered adults onto the voter rolls. But the law’s potential will only be realized if the state truly streamlines the process to make it as easy as possible.

The Great Nutrient Pollution Challenge

The word nutrients sounds like a good thing—they make our food healthy, for example. But in our rivers, lakes, and bays, nutrients can pose water quality challenges. In the right amounts, nutrients such as nitrogen and phosphorus support plant and animal growth in key waterways such as the San Francisco Bay and the Sacramento-San Joaquin Delta. Excess amounts can cause toxic algae blooms and reduced oxygen in the water. Consequences can include die-offs of fish, mammals and birds, and human illness.

The main sources of nutrients in the Bay-Delta are sewage plant discharge and agricultural runoff. Jim Cloern, a USGS scientist and member of PPIC’s water policy research network, has been studying water quality in the Bay-Delta since the late 1970s.

“San Francisco Bay has historically shown resistance to the harmful consequences of nutrient pollution, but in recent decades there are signs this resistance is weakening,” Cloern says. Algae levels in the bay have increased, oxygen levels have declined, and algal toxins and toxin-producing species are sometimes present at levels to cause concern, he notes.

In the Delta, nutrient pollution has contributed to the spread of invasive aquatic plants such as water hyacinth and recurrent blooms of the toxic blue-green alga Microcystis. The role of nutrients in the collapse of many fish species in the Delta has prompted lively debates, but one thing is clear: they are a significant source of stress on California’s struggling native species. Conditions are worsening with the drought, which has reduced freshwater flows into the Bay-Delta and increased temperatures.

There is a growing understanding among wastewater managers and regulators that a new round of investments is needed.

“The Bay Area’s wastewater treatment plants will need to continually adapt to growing water quality challenges, either voluntarily or through regulations,” Cloern says.

One option on the table is increasing levels of treatment, which can be costly. For example, Sacramento’s wastewater treatment plant is undergoing a $2 billion upgrade to reduce the volume of nutrients entering the Delta. Other options can complement or substitute for treatment plant upgrades. For instance, restoring wetlands can filter out nutrients and other pollutants, while also providing valuable habitat and protection from floods.

Another tough question is how to manage agricultural runoff from animal production and fertilizer use in the Central Valley, the main source of nutrients in the Delta. These sources are dispersed, which makes treatment difficult and expensive. Controlling farm pollutants at the source is likely the most cost-effective solution. This will require working with farmers to adjust their practices.

Thankfully, the days when untreated sewage and industrial waste poured directly into the Bay-Delta are long gone. But the next water quality challenge is on the horizon. Climate change will intensify our current challenges, as invasive plants and toxic algae thrive in warmer temperatures. Cloern suggests that we need a nutrient management strategy for the Bay-Delta that “anticipates these future changes so that investments are designed in a thoughtful and scientifically grounded way.”

Learn More

Read California’s Water Quality Challenges (PPIC Water Policy Center fact sheet, October 2015)
Visit the PPIC Water Policy Center water quality resource page

Coming Together Over Groundwater

California’s groundwater management took a forward-looking turn with last year’s passage of the Sustainable Groundwater Management Act (SGMA), which requires local planning efforts to protect the long-term viability of this critical resource. Sarge Green—a water management specialist at California State University, Fresno, and a member of the PPIC Water Policy Center’s research network—is working to put the groundwater law into practice at the local level. We talked to him about creative approaches being tried in the San Joaquin Valley.

PPIC: Talk about the regional groundwater management effort you’re involved in.

Sarge Green: I’ve been participating in a joint effort of eight counties in the San Joaquin Valley, which is looking at key issues—education, air quality, water, transportation. Water is now the top priority for this planning effort, not surprisingly.

The San Joaquin has the largest overdrafted groundwater area in the state. Our task is to find common tools or projects to improve our groundwater situation, and try to get support for them with state or federal grants. We’re designing a local groundwater ordinance with elements that address unsustainable groundwater extraction impacts and permits for new wells.

This valley is a study in contrasts. At one end is the Delta, and at the other end is a major importer of Delta water. Getting all the counties together was groundbreaking. Our organizing principal is: we agree on a majority of things having to do with water, but historically we’ve spent most of our time on the things we disagree on. We’re focusing on what we agree on and getting things done.

PPIC: What is a logical scale for managing groundwater?

SG: Groundwater knows no political boundaries. Basically there’s one big basin. The logical planning scale is the watershed—the areas around the rivers and the mountains that contribute to our valley groundwater. But one constraint in this part of the state is that a lot of people don’t want bigger government. So what’s happened is we’re working at smaller levels within the watershed, and breaking into governing units called groundwater sustainability agencies. Hopefully over time we’ll migrate to something more logical. Ultimately, we’ll need to tie groundwater management to the larger watershed.

PPIC: What’s currently keeping you up at night regarding the state’s groundwater reserves?

SG: It’s the loss of shallow water in rural communities, which is causing drinking water problems. In many cases, rural residents can’t afford to drill much deeper. In others they’re drilling to bedrock and still not getting water. Our basins will refill, but that won’t happen overnight. Financing is also an issue. Some counties are offering low-interest loans to help folks drill deeper. Some people will get covered by hooking into larger systems, which is being promoted by the state’s new push for consolidation. I’ve worked for a long time in rural communities, so I know many rural residents want to remain independent. Some don’t even complain when their wells run dry—they just wait on a drillers’ list and get the job done.

Learn More

Read Reforming California’s Groundwater Management (PPIC fact sheet)
Read “Getting to Groundwater Sustainability” (PPIC blog, June 16, 2015)
Visit the PPIC Water Policy Center’s water supply resource page

Leon Panetta on Leadership and Crisis

In 50 years of public life, Leon Panetta said he has learned that “in a democracy, you can govern either by leadership or by crisis.”

“If for some reason the leadership is not there, then we will govern by crisis,” said Panetta, who has served as US secretary of defense, CIA director, presidential chief of staff, director of the Office of Management and Budget, and director for the Office of Civil Rights—as well as representing California’s Central Coast in Congress for 16 years.

In a wide-ranging conversation with Mark Baldassare, PPIC president and CEO, Panetta touched on global flashpoints, presidential politics, dysfunction in Washington, and electoral reform in California.

His main criticism of Washington today? “Too much in Washington is done on a crisis-by-crisis basis.” He contrasted last week’s budget agreement—a temporary solution to the threat of default and government shutdown—to earlier budget negotiations that involved two presidents, George H. W. Bush and Bill Clinton, making tough trade-offs with members of Congress. Leadership requires taking risks and that can mean paying a political price—as the elder Bush believes he did in the 1992 election.

Panetta said that as CIA director, he saw President Obama demonstrate leadership in the raid on Osama bin Laden’s compound, an operation fraught with risk. Despite good evidence that the al-Qaeda leader was in the compound—including confirmation that the laundry hung on the clothesline matched up with bin Laden’s family—there was no certainty he was there.

A majority of members of National Security Council thought the mission was too risky. The president asked Panetta’s advice. Panetta told him about a method he had used to make decisions as a member of Congress: “If I had a tough issue I’d ask myself, what if I asked an ordinary citizen in my district, ‘If you knew what I know, what would you do on this issue?’ And I think that if I told an ordinary citizen that we had the best evidence on the location of bin Laden since Tora Bora, then I think the average citizen would say, ‘You have to do this.’”

The next morning Obama made the decision. The mission was a go.

“Tough decision. Leadership. Taking a risk,” said Panetta. “But ultimately, that’s what it takes to be president of the United States. That’s what it takes to be a member of Congress.

Other highlights from Panetta’s remarks:

  • Of all the global threats, what does he worry about most? “Cyber-attack.”
  • What does he think of Republican presidential candidates who promote their lack of experience in government? Deep down, people know that you don’t want to elect a snake-oil salesman.”
  • Who’s to blame for the logjam in Congress? “You can’t reach this level of dysfunction and not have both parties share a little bit of the blame.”
  • What’s the difference between Washington and California? “I feel pretty good about California.”

Interpreting California’s Latest SAT Scores

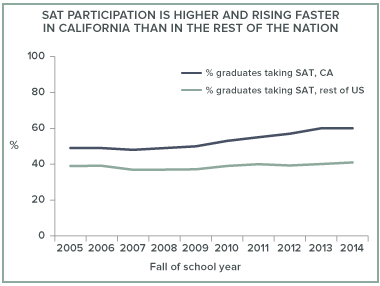
An increasing share of California students are taking the SAT. This is good news for California, suggesting that more and more students are preparing for college. Sixty percent of the high school graduating class of 2015 took the SAT, a much higher share than in the rest of the United States (41%). Moreover, SAT participation has been growing faster in California than in the rest of the nation.

Even though raw scores have declined, once we adjust for the increased share of graduates taking the SAT, the latest scores represent an improvement from a decade ago. On average, California’s graduating class of 2015 scored 1,492 out of 2,400 points on the SAT college admission tests—28 points lower than a decade ago, and 2 points higher than the national average. However, once we factor in the increase in participation over the past decade, California’s 2015 score actually represents an improvement compared to a decade earlier. As participation in the SAT increases, the mix of students taking the exam shifts towards those less academically prepared. In states with high average SAT scores, participation rates are very low, because the only students who participate tend to be very well prepared. On average, a 1 percentage point increase in participation is associated with a 3.4 point decrease in average performance. Given the 11 percentage point increase in participation among California high school seniors over the past decade, we would expect the state’s average SAT score to drop 10 points more than it did.

Latino students have experienced the largest increase in SAT participation. Over time, SAT participation has increased steadily among all major racial/ethnic groups—including Asian, white, Latino, and African American students. But the largest gain has been among Latino students. For instance, in the 2013–14 school year, 43 percent of Latino graduates took the SAT, up from 35 percent in 2005–06. (Graduation data for 2014–15 has not yet been released.)

Race/ethnicity-related performance gaps are changing. Asian students outperformed white students in the 2014–15 school year by 11 points, reversing a trend in which whites were the higher scorers. The gap between African Americans and whites has narrowed over time. In the 2014–15 school year, white students scored 295 points higher, on average, than African American students and the score gap has decreased from 317 points in the 2005–06 school year. However, the Latino-white gap has increased slightly—not very surprising given the huge increase in Latino students’ participation in the SAT.

Parental education level, family income matters more now. Parental education and family income are closely related to SAT performance. In 2014–15, students whose parents have bachelor’s degrees scored, on average, 1,601 points—200 points higher than students whose parents have only a high school diploma. Over time this gap has widened, mostly because students whose parents have graduate degrees are scoring higher on the SAT. There is also a widening performance gap connected to gaps in family income, particularly at the upper end of income distribution. For instance, the performance gap between students whose families make more than $200,000 (roughly the top 10 percentile) and those from families earning $60,000 to $80,000 (roughly the median household income) widened from 172 points in 2007 to 251 points in 2014.

The increase in SAT participation, especially among groups that are underrepresented in higher education, is good news for California. At the same time, the continuing gaps in performance represent an ongoing challenge that must be addressed, especially given California’s changing demographics.

Chart source: (TOP) National Center for Education Statistics, College Board, 2005–14. Chart notes: (TOP) Participation rate is based on the projection of high school graduates by the Western Interstate Commission for Higher Education (WICHE), and the number of seniors who took the SAT in each state. Participation varies widely across states and can be partially explained by state policies. For instance, all public high school juniors in Maine have been required to take the SAT since 2006. Similarly, since 2011, Delaware has made the SAT available to all public high school juniors. And, starting with the class of 2014, all juniors in District of Columbia public schools take the SAT.
Chart source: (MIDDLE) College Board, 2014–15.
Chart source: (BOTTOM) College Board, 2014–15. Chart note: (BOTTOM) Orange vertical line indicates the College Board’s College and Career Ready (CCR) benchmark.

Saving Native Fishes from Extinction

Native fishes have been hit hard by the drought, with 18 species—including many salmon runs—at high risk of extinction if warm, dry conditions persist. But there are actions we can take now to avert what could be the largest loss of native freshwater fish biodiversity since the arrival of Europeans in California.

The state and federal fish agencies entrusted with preventing these extinctions face formidable challenges. The species at risk cover a very large geographic area and in many regions the options for emergency management actions are limited. Additionally, the total amount of funding allocated to managing the environment during this drought is very modest: $66 million, or roughly 2% of total state drought spending. (We showed this in our report What If California’s Drought Continues? in Table 1.)

The California Department of Fish and Wildlife has taken many actions despite limited resources (see this summary), with more than 30 projects underway. But more can—and should—be done now to prepare for continued drought. Here are some suggestions:

  • Initiate an emergency conservation hatchery program. This should start with fish at risk of extinction that are not already the focus of intense conservation. These efforts can be as simple as building temporary holding tanks or as elaborate as temporarily converting production hatcheries to rebuild these populations.
  • Establish a robust environmental water emergency fund. This would enable fisheries managers to purchase or trade water to maintain adequate flows and water quality for at-risk fish. It could be modeled after projects by The Nature Conservancy and the Natural Resources Conservation Service. These initiatives use temporary water transfers to flood farm fields in key locations to create waterbird habitat. During times of high stress for native fishes—usually due to low flows and high temperatures—strategic investments that temporarily return water to streams can help keep fish healthy.
  • Develop a reservoir drought-operations plan. State and federal agencies should conserve cold, fish-friendly flows at strategic reservoirs next summer. A margin of safety should be built into these allocations to address unusually warm conditions and modeling uncertainties, such as those that decimated winter-run Chinook salmon below Shasta Reservoir the past two years.
  • Develop a drought biodiversity management plan. The state should harvest the lessons from management successes and failures during this drought to develop this plan. Environmental management will be more efficient and effective if we have a plan in place before a drought that sets priorities for emergency actions intended to improve species’ resilience. We need to start on this now, while the lessons are fresh.

Many more actions can be taken (examples are outlined in California Species of Special Concern). However, it’s essential that some actions be taken now to prepare for continued drought. While it’s tempting to hope that the record El Niño now building in the Pacific will solve our drought problems, the only sure thing about El Niño is that it is not a sure thing.

Learn More

Visit the PPIC Water Policy Center’s ecosystems resource page
Read “Extinction Risk for Native Fish if Drought Persists” (PPIC Blog, September 10, 2015)

Proposition 47 and Crime

Last November, voters approved Proposition 47, which reclassified a number of drug and property offenses from felonies to misdemeanors. As a result, inmate populations have dropped in California’s capacity-challenged state prisons and county jails. Reports of increases in violent crime in some areas have raised concerns, and the significant drawdown in the jail and prison populations—by roughly 17,000 inmates so far—certainly carries the risk of increased crime. But it would be premature to blame Proposition 47 for the uptick.

Proposition 47 helped bring down the prison population by about 8,000 inmates, below the mandated target of 137.5 percent of design capacity (the number of inmates that facilities were designed to house). The target was set by a federal court in 2009 in the wake of lawsuits over prison conditions; at the time, it meant a reduction of almost 40,000 prisoners. The prison population has remained below the target since January 2015. This is a key requirement for the state to regain control of prison health care, which is currently overseen by a court-appointed receiver. The total prison population has dropped by slightly more than 45,000 inmates since it peaked in 2006.

Proposition 47 also helped bring the jail population below the statewide rated capacity (here again, the number of inmates facilities are designed to hold), after three years of increases that were driven by public safety realignment. In stark contrast to the increase of about 11,000 inmates between September 2011 and October 2014, the county jail population dropped by almost 9,000 inmates, or 10.7 percent, between October 2014 and March 2015 (the most recent month of available data).

As we noted above, reports of increased crime in a number of cities and counties in 2015 have fueled concerns about the impact of these population reductions. Between January and August, violent crime in Sacramento was up by 24 percent compared to the same months in 2014. In Riverside County, violent crime was up almost 11 percent in the first six months of 2015. In the City of Los Angeles, it was up almost 21 percent in the same time period.

There are good reasons to be cautious about attributing these upticks to Proposition 47. Crime trends fluctuate frequently and widely and it is challenging to pinpoint specific causes. The first year of realignment provides a good example of this. After a long decline, both violent and property crime in California increased in 2012, the year after realignment was implemented, and many blamed the reform. However, as our careful analysis has shown, there is no evidence that realignment led to more violent crime, and the only uptick that can be attributed to the reform is auto theft. Another reason to be cautious is that other states have seen increases in crime this year—the New York Times recently reported that violent crime, as represented by murder rates, has gone up noticeably in a number of US cities. With all this in mind, at this time we urge against drawing any firm conclusions about Proposition 47’s impact on crime.

Chart sources: (TOP) California Department of Corrections and Rehabilitation, monthly population reports. (BOTTOM) Board of State and Community Corrections, jail profile surveys.