Preliminary data from the FBI offer discouraging news about crime trends in California’s largest cities. A number of cities—such as Los Angeles, Sacramento, and Riverside—reported increases in violent crime in 2015. The recently released FBI data also show that California cities are seeing property crime increases. These increases, particularly in property crime, are widespread and not trivial in magnitude. However, the data also show that cities in other states are also experiencing increases, especially in violent crime.
The FBI crime numbers cover January through June 2015 and are limited to cities with populations of at least 100,000 that report crime data to the FBI. In total, the data allow us to calculate year-over-year changes for 245 cities in 41 states throughout the country. The 66 California cities included in the FBI data contain about half of the state’s total population. The most recent statewide crime numbers showed that California’s crime rates continued to drop in 2014 and were at historic lows.
Comparing January through June 2015 to the same months in 2014 reveals that many US cities included in the preliminary FBI data saw increases in crime. Of the 66 California cities in the data, 49 saw increases in violent crime and 48 experienced increases in property crimes. Many of these cities saw double digit percent increases—34 in violent crime and 24 in property crime.
Violent crime rates went up in 24 of the 41 states included in the FBI data, and property crime increased in 14 states. However, the property crime rate for the included US cities with populations of 100,000 or more decreased by 29.6 per 100,000 residents, while the property crime rate for the California cities increased by 116.9. The increase in property crime in California cities stands in sharp contrast to the other four states with the highest populations: large cities in Texas, New York, Florida, and Illinois saw decreases of between 111.1 (Texas) and 47.7 (New York) property crimes per 100,000 residents.
Among the 41 states with cities that are included in the FBI data, California’s property crime increase ranked 6th, while its violent crime increase ranked 12th. Most of California’s larger cities (46 of 66) were among the 100 cities nationwide that saw the largest property crime increases. Close to half (32, to be precise), were in the top 100 in violent crime increases. When we look at the data for the 25 largest US cities, we see that the biggest increases in violent and property crime rates occurred in Sacramento and San Francisco, respectively. California has six cities in this group, and all are among the ten that saw the largest increases in the property crime rate.
Again, these FBI numbers are preliminary, and they cover only about half of the state’s population. But they are a strong indication that recent crime increases have occurred across the state. They underscore the importance of monitoring crime trends and the need for careful analysis to identify key causes. If we can identify the factors that are contributing to higher crime rates, we can implement effective crime-preventive strategies.
 Chart note: Changes in the number of violent and property crimes per 100,000 residents, January–June 2015 compared to January–June 2014. The table includes the 25 largest US cities included in the FBI data with crime statistics for both 2014 and 2015, ranging from New York City, with a population of 8,473,938, to Kansas City, MO, with a population of 468,417.
Chart source: FBI’s Preliminary Semiannual Uniform Crime Report, January–June, 2015.

 Our survey shows that many Californians believe—incorrectly—that prisons and corrections account for the largest share of state spending. When asked to select the largest spending area of the state budget, California likely voters are most likely to choose prisons and corrections (41%)—this is consistent with our findings over the past several years. In fact, the allocation for prisons and corrections in the governor’s 2016–17 budget proposal ($10.6 billion) comes in behind higher education ($14.6 billion), health and human services ($33.7 billion), and K–12 education ($51.2 billion).
 Although a number of policies have contributed to this decline, it is largely attributable to two recent major reforms: the 2011 Public Safety Realignment Act, or AB 109, which shifted responsibility for many non-serious, non-violent, and non-sexual offenders to county jail and probation systems; and Proposition 47, which reclassified some drug and property felonies as misdemeanors. Since January 2015, two months after voters approved Prop 47, the prison population has remained below the court-mandated target. That is good news for the state. However, the institutional population is only about 1.1 percent, or 900 inmates, below the target. Given this slim margin—and given the fact that the state still needs to show that it is providing adequate health care—the pressure is still on.
 Voters may well be inclined to see reductions in spending on prisons, and with good reason. California’s corrections budget continues to grow, with the governor requesting $10.6 billion from the General Fund for 2016–17—a historic high. This amount does not include more than $1 billion annually that the state transfers to counties to implement realignment. For 2016–17, the state is projecting the cost of the prison system to be almost $70,000 per prisoner. A significant reduction in the prison population could finally allow the state to stop the use of out-of-state contract beds and possibly close a state prison. These actions could potentially lead to hundreds of millions of dollars in annual savings. Without further reductions in the prison population, it will be difficult for the state to stop using contract beds and remain below the court-ordered population cap.

 Proposition 47 helped bring down the prison population by about 8,000 inmates, below the mandated target of 137.5 percent of design capacity (the number of inmates that facilities were designed to house). The target was set by a federal court in 2009 in the wake of lawsuits over prison conditions; at the time, it meant a reduction of almost 40,000 prisoners. The prison population has remained below the target since January 2015. This is a key requirement for the state to regain control of prison health care, which is currently overseen by a court-appointed receiver. The total prison population has dropped by slightly more than 45,000 inmates since it peaked in 2006.
  As we noted above, reports of increased crime in a number of cities and counties in 2015 have fueled concerns about the impact of these population reductions. Between January and August, violent crime in Sacramento was up by 24 percent compared to the same months in 2014. In Riverside County, violent crime was up almost 11 percent in the first six months of 2015. In the City of Los Angeles, it was up almost 21 percent in the same time period.


 As of August 2015, the total prison population had dropped by almost 45,000 inmates from its 2006 peak. The majority (about 55%) of the decline was a result of realignment, which was implemented in October 2011 in response to a court order to improve prison conditions by reducing overcrowding. However, it took the passage of Proposition 47 last November—which reclassified a number of felony drug and property offenses as misdemeanors—and building and renting additional prison beds to reach the court-ordered population target of 137.5 percent of design capacity. The prison population has declined by almost 7,700 since November and has remained below the mandated target since January 2015. This is a key requirement for the state to regain control over prison health care—currently, a court-appointed receiver oversees health care in the system.
 Although we can see that prison population numbers have dropped in each of the nine months since Proposition 47 passed, we need to be more cautious about the measure’s impact on jail population numbers because we only have jail data for the first two months. Also, counties have been working to implement and refine new jail policies and procedures, and these may be having an impact on jail populations. For instance, data through March 2015 for Los Angeles County show that the jail population dipped below 16,000 inmates in December (down from more than 18,000 in October), but rose above 17,000 in January and stayed above 17,000 through March. This increase is related to the sheriff requiring that inmates serve a larger percentage of their sentences before release. We may see similar developments in other counties. Nonetheless, even in Los Angeles there was a noticeable drop in the jail population compared to months before passage of Proposition 47.
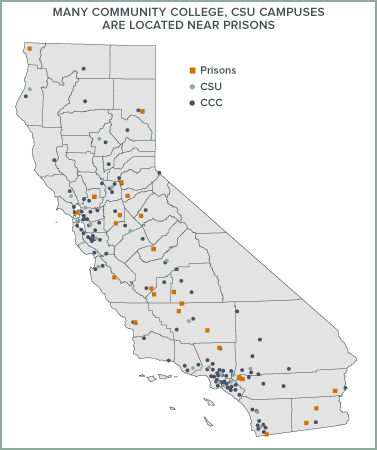 California currently supports community college education for all low-income students, including inmates, through fee waivers. However, these waivers are not available for students who wish to pursue four-year degrees. These students rely on other forms of aid, including federal Pell Grants. The Pell Grant pilot program presents an opportunity for CSU to begin working with CDCR to leverage federal dollars to expand access to high-quality, onsite higher education for inmates in state prison.