The 2020 Census and Political Representation in California

California’s political representation will be affected by the 2020 Census—but an accurate count is far from guaranteed. Inadequate funding and fear in the state’s large immigrant population are heightening concern about an undercount. At a briefing in Sacramento last week, PPIC researcher Eric McGhee outlined a new report that draws on population trends and research on past undercounts to develop plausible scenarios for 2020.

“I think it’s fair to say that we are unlikely to lose a congressional seat if there is an accurate count,” said McGhee. However, California is more vulnerable to an undercount than most other states. Three in four Californians belong to at least one of the populations that are difficult to count: children, young men, Latinos, African Americans, immigrants, and renters.

An undercount could cause the state to lose one of its 53 seats in the House of Representatives. It could also have an impact on political representation within California. If the state does a poor job of reaching hard-to-count populations, it might end up drawing congressional and state legislative districts that shift representation from poorer areas with larger communities of color to areas that are wealthier and less diverse.

Privacy concerns have increased both the difficulty and the cost of conducting census surveys. The current political climate is likely to exacerbate these concerns, especially now that a question on citizenship status has been added to the 2020 survey. (The addition is being contested in the courts.) Moreover, the 2020 Census will be the first to collect a majority of responses online. The Census Bureau is testing the Internet survey but lacks the resources to test outreach and follow-up. Because California has a disproportionate share of historically undercounted residents, these challenges are of particular concern.

But, as McGhee pointed out, “California’s fate is still in its own hands.” This year’s state budget allocates about $90 million for census outreach, which should help community organizations and state and local governments educate residents about the importance of the census and the security of the information collected. Californians need to know that “a better count in California could make a big difference.”
Partisan Loyalty Trumps Gender Solidarity in California

A month until the midterm elections, California’s voters are gearing up for decisions that will have ramifications across the nation. Much has been discussed of a potential “blue wave,” with Democrats eyeing to flip seven Republican congressional seats in California—nearly one-third of the 23 seats needed to shift party control in the US House of Representatives. Concurrently, there are a record number of women running for US Congress and statewide executive offices, including 37 in California. With women comprising 54% of the state’s likely voters, how large a role will they play in the upcoming election?

According to PPIC’s September Statewide Survey, 50% of female likely voters say the upcoming election is more important to them than past midterms; just 3% say it is less important and 46% say it is about the same. Yet when looking at the partisan breakdown among female likely voters there are notable differences: 63% of Democratic women say the upcoming election is more important while 37% of Republican women say the same (sample sizes for independent female likely voters are too small for separate analysis).

In the generic ballot for the US House of Representatives, California’s female likely voters prefer the Democratic candidate over the Republican candidate (58% to 34%). Nearly all partisan female likely voters say they would vote for their own party. When asked about qualities they prefer in a candidate, six in ten Democratic women (60%) prefer those who have experience in politics to those who are new at it, while Republican women are divided (41% experience, 41% new to politics).

Recent prominent events at the national level may impact women’s preferences and turnout in the midterms. Our September survey was fielded following the initial Senate confirmation hearings for Judge Brett Kavanaugh’s appointment to the Supreme Court but prior to the additional hearing on sexual abuse allegations featuring Dr. Christine Blasey Ford. Nonetheless, nearly all female likely voters in our September survey view the choice of the next Supreme Court justice as either very (74%) or somewhat (18%) important to them personally. Across parties, Democratic women are much more likely than Republican women to say the choice is personally very important (82% to 62%).

Meanwhile, President Trump’s approval rating reflects sizable partisan differences among California’s female likely voters: 91% of Democratic women disapprove of the way Donald Trump is handling his job as president, while 80% of Republican women approve.

With women poised to play a pivotal role in the upcoming election, we may see the emergence of a “pink wave” that rivals the “Year of the Woman” associated with the 1992 election. Stay tuned to the PPIC Statewide Survey as we continue to monitor the preferences and attitudes of Californians, with a particular interest in female likely voters, leading up to the midterm.

Tectonic Shifts in Orange County

Orange County has evolved from a Republican stronghold to a credible target of opportunity for the Democrats seeking to take control of the U.S. House of Representatives in the November election.

Until the most recent presidential election, Republican candidates had won in every top-of-the-ticket statewide race in Orange County for 20 years. In fact, the last time that a Democratic presidential candidate carried Orange County was in 1936. But in 2016, Democrat Hillary Clinton defeated Republican Donald Trump by 51 to 42 percent, a margin of 102,813 votes. Moreover, Clinton received more votes than Trump in each of the four Orange County House seats now held by Republicans.

Tectonic shifts in Orange County’s demographics and voter registration set the stage for the surprising 2016 presidential outcome and the competitive 2018 House races. First, Orange County’s population is transitioning. Since 2000, the proportion of whites has declined from 51 percent to 41 percent of the population. Latinos now make up to 34 percent and Asian Americans make up 21 percent of the population. Most Latino and Asian American likely voters are registered Democrats today.

Second, Orange County’s political stripes have changed from red to purple. Since 2000, the proportion of registered Republican voters has declined from 49 percent to 36 percent. Registered Democrats have increased to 34 percent and independents have increased to 27 percent. Today, most independent likely voters lean toward the Democratic Party. In sum, Republicans’ electoral clout is diminishing in Orange County.

Since this midterm election is a referendum on the president, how is Donald Trump viewed by Orange County voters? The Public Policy Institute of California’s Statewide Survey has been tracking President Trump’s popularity by asking the following question, “Overall, do you approve or disapprove of the way that Donald Trump is handling his job as president of the United States?” In five 2018 PPIC surveys, 40 percent approve and 56 percent disapprove of President Trump when combining the results for registered voters in Orange County.

Approval of Trump’s presidency in Orange County varies widely by party: 79 percent of Republicans, 30 percent of independents, and 13 percent of Democrats. Half of whites approve of his performance, while 28 percent of nonwhites approve. Overall, Trump’s approval rating in Orange County of 40 percent in 2018 closely mirrors his 2016 vote total, which was 42 percent. This indicates his political base in Orange County has not grown during his time in office.

Voter turnout will be the political wildcard in Orange County. Since 2000, Orange County’s voter turnout in midterms has been on average 21 points lower than in presidential elections. Low turnout this year would be a throwback to the “old” Orange County electorate—more Republicans and whites. A high turnout would reflect the “new” Orange County—more Democrats, independents, and nonwhites.

We’ll know in a month whether the new or old Orange County will prevail in 2018. But given the demographic and registration trends, the Orange County of the future will be very different from the one that consistently voted for Republicans.

2020 Census: Counting Los Angeles County

The decennial census plays an essential role in American democracy. Our series of blog posts examines what’s at stake for California and the challenges facing the 2020 Census, including communities that are at risk of being undercounted.

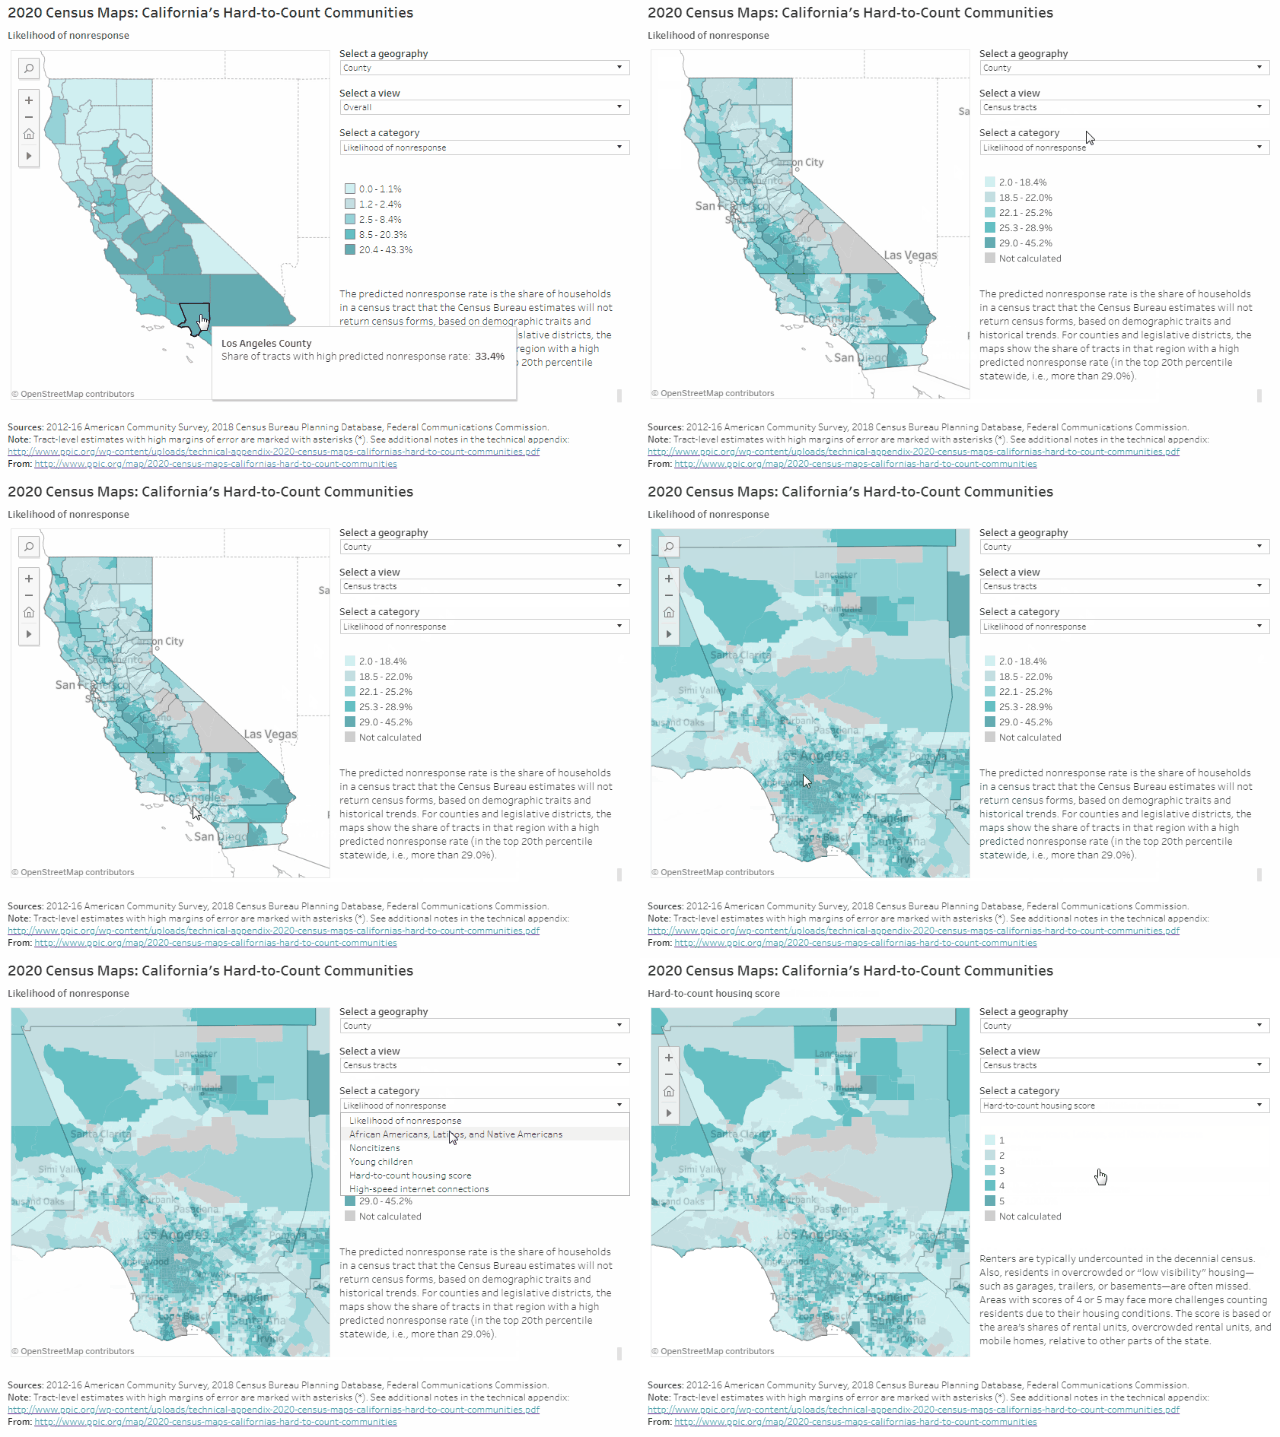
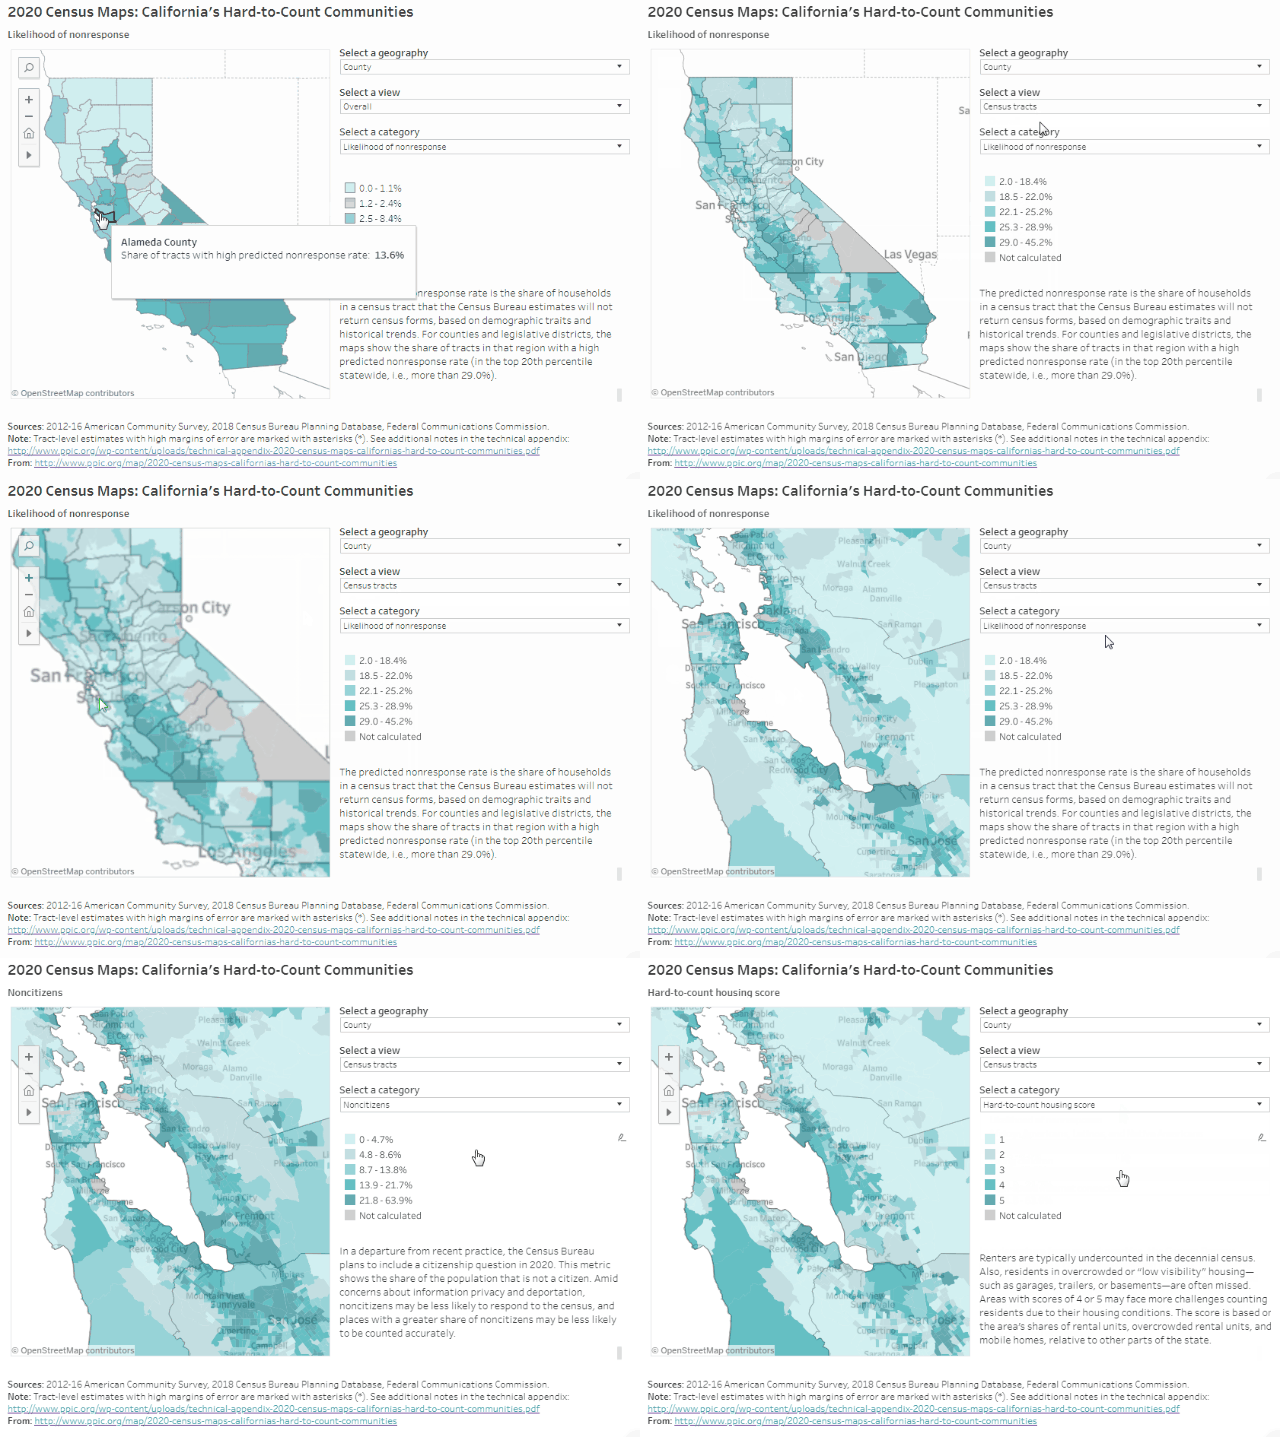
PPIC’s interactive census maps are an important tool for Californians working to ensure an accurate census count. Using estimates from the Census Bureau and the Federal Communications Commission, they highlight hard-to-count communities across the state and pinpoint reasons why certain areas may be hard to reach.

Home to about a fourth of the state’s population (10.3 million people), Los Angeles County may be one of California’s hardest-to-count regions in 2020. A third of the county’s census tracts are likely to be very hard to count, according to Census Bureau estimates that draw on local demographic characteristics (e.g., race/ethnicity, age, citizenship, and housing conditions) and historical trends. These areas tend to be concentrated in central and east LA south through Compton, as well as parts of Long Beach, the San Fernando and San Gabriel Valleys, Pomona, and Palmdale. Households in these very hard-to-count areas are less likely to respond initially to census forms and are therefore at risk of being undercounted.

Some highlights:

  • An undercount could reshape political representation in the region. Disproportionately undercounting parts of LA County could affect how district lines are redrawn after the census. Legislative districts in central and south LA have some of the highest concentrations of very hard-to-count communities in the state: In State Assembly District 59 (Jones-Sawyer), 96% of census tracts are considered very hard to count. In ten more legislative districts representing parts of central and south LA, over half of neighborhoods are considered very hard to count.
  • Undercounting people of color would dramatically misrepresent LA County’s urban core. About 57% of LA County residents are African American, Latino, or Native American—populations that have historically been undercounted in the census. In most central, south, and east LA neighborhoods, for example, African Americans and Latinos make up 80% to 100% of residents, compared with less than 15% in parts of nearby Beverly Hills and San Marino. If the 2020 Census again undercounts these groups, political representation could shift away from LA’s urban centers.
  • LA County’s hard-to-count housing is concentrated in communities of color. It can be difficult for the Census Bureau to accurately count people in rentals, overcrowded units, and mobile homes. Housing in LA County is among the hardest to count in the state. Moreover, in many neighborhoods with the hardest-to-count housing, nearly all residents are African American and/or Latino. Recognizing ways that hard-to-count communities intersect with each other will be important to conducting effective outreach to LA residents. In addition, reaching homeless Angelenos during the three-day window for counting people at shelters, tent camps, and other places will be critical to a complete and accurate count in the region.
  • Neighborhoods throughout the county have high shares of young children. In particular, east and south LA, as well as Lancaster and Palmdale, have larger concentrations of young children—who are typically undercounted in the census. In many of these neighborhoods, children under five years old make up more than 10% of residents, compared to less than 7% statewide.
  • Low responses from noncitizens would lead to a notable undercount in the region. Noncitizens may be less likely to respond to the 2020 Census due to the planned addition of a citizenship question and concerns about deportation and privacy. About 17% of LA County residents are noncitizens, compared to 14% statewide. In several neighborhoods in central and south LA, east LA, the San Fernando and San Gabriel Valleys, and Pomona, more than a quarter of residents are noncitizens.
  • The county has pockets of low internet access, including in the city of LA. The Census Bureau plans to collect the majority of responses online in 2020—a change from previous practice. Though urban areas generally have better internet access than rural areas do, a number of neighborhoods in central and south LA actually have fewer high-speed residential internet connections than the surrounding suburbs. The northeastern corner of the county also has lower levels of internet access. In these places, it may be harder to collect responses online, and participation will rely more heavily on in-person census takers or internet provided by local institutions.

We hope these maps serve as a starting point to help local, regional, and state leaders think about which activities, resources, and partnerships—including language assistance, awareness raising, and community outreach—might be most effective for accurately counting different parts of California. Stay tuned for more posts that examine hard-to-count communities in other regions of the state.

Video: Californians and Their Government

As the November election approaches, Democrat Gavin Newsom has a 12 point lead over Republican John Cox in the race for governor. In the US Senate race, Dianne Feinstein leads fellow Democrat Kevin de León by 11 points. Half of likely voters see this election as more important than past midterms; most lean toward Democratic candidates in US House races. These and other key findings in the latest PPIC Statewide Survey were outlined by PPIC researcher Dean Bonner at a Sacramento briefing last week.

A slim majority of California’s likely voters oppose Proposition 6, a ballot measure that would repeal recently enacted increases in the gas tax and vehicle registration fees. Proposition 10—which would expand the authority of local governments to enact rent control—is also trailing.

Other survey highlights:

  • Three in four likely voters view the choice of the next Supreme Court justice as very important to them personally.
  • Majorities of registered voters across parties say they do not want to see the Supreme Court’s Roe v. Wade decision completely overturned.
  • A third of likely voters approve of President Trump’s job performance and only 20% approve of Congress; by contrast, more than half approve of Governor Brown and the state legislature has a 44% approval rating.
  • Likely voters are most likely to name jobs and the economy, immigration, and housing as the most important issues facing the state.

2020 Census: Counting the Bay Area

The decennial census plays an essential role in American democracy. Our series of blog posts examines what’s at stake for California and the challenges facing the 2020 Census, including communities that are at risk of being undercounted.  

PPIC’s interactive census maps are an important tool for Californians working to ensure an accurate census count. Using estimates from the Census Bureau and the Federal Communications Commission, they highlight hard-to-count communities across the state and pinpoint reasons why certain areas may be hard to reach.

Home to about 20% of the state’s population—some 8 million people—the Bay Area has clusters of hard-to-reach places throughout the region. Of the 10 counties bordering the San Francisco, San Pablo, and Suisun Bays, including neighboring Santa Cruz County, Alameda has the highest share of very hard-to-count areas (14% of census tracts) and Napa the lowest (3%). Households in these very hard-to-count areas are less likely to respond initially to census forms and are therefore at risk of being undercounted, according to Census Bureau estimates that draw on historical trends and local demographic characteristics (e.g., race/ethnicity, age, citizenship, and housing conditions). Compared to some of California’s central and southern counties, the Bay Area has lower shares of very hard-to-count places, but there are still several areas of concern.

Some highlights:

  • East Bay legislative districts have the highest concentrations of very hard-to-count neighborhoods in the region. In three East Bay legislative districts, 20% or more of census tracts are considered very hard to count: Congressional District 13 (Lee), State Senate District 9 (Skinner), and State Assembly District 18 (Bonta). Each of these districts represents Oakland and other parts of the East Bay.
  • But there are hard-to-reach neighborhoods throughout the Bay Area. In addition to Oakland, residents in the East Bay cities of Richmond, Berkeley, and Hayward are likely to be hard to reach, with around 30% of households in many neighborhoods predicted not to respond initially to the census. In San Francisco, particularly hard-to-reach neighborhoods include SoMa, the Mission District, and Bayview/Hunters Point. Other cities with many hard-to-count census tracts include Santa Cruz, San Jose, East Palo Alto, and Redwood City on the Peninsula, and Antioch, Santa Rosa, and Vallejo in the North Bay. It is important to keep in mind that communities may be hard to count for multiple reasons.
  • Understanding local population trends can help guide effective outreach. Compared to the rest of the state, Bay Area counties tend to have lower-than-average shares of young children, African Americans, Latinos, and Native Americans—populations that are typically undercounted in the census. Nevertheless, many neighborhoods have relatively high concentrations of young children and people of color—and are still at risk of being undercounted. For example, undercounting people of color in 2020 could significantly misrepresent communities in Richmond, Oakland, East Palo Alto, and Bayview/Hunters Point.
  • Low responses from noncitizens could lead to an undercount, especially in the South Bay.
    Noncitizens may be less likely to respond to the 2020 Census due to the planned addition of a citizenship question and concerns about deportation and privacy. Nearly 18% of people in Santa Clara County are noncitizens, compared to just under 14% statewide. Noncitizens make up about 15% of residents in Alameda and San Mateo Counties as well. In many neighborhoods—including parts of Fremont, Sunnyvale, Cupertino, and Redwood City—more than 30% of residents are noncitizens.
  • Housing conditions may make some Bay Area residents particularly hard to reach. Several neighborhoods in the East Bay, San Jose, Redwood City, and Santa Cruz have relatively large shares of housing units that are rentals, overcrowded rentals, and/or mobile homes—a reflection of how residents are coping with some of the most expensive housing markets in the country. These conditions can make it harder for the Census Bureau to find and count residents. In some parts of San Jose, for example, one in four rentals is overcrowded. Reaching homeless residents during the three-day window for counting people at shelters, tent camps, and other places will also be critical to an accurate count in the region.

We hope these maps serve as a starting point to help local, regional, and state leaders think about which activities, resources, and partnerships—including language assistance, awareness raising, and community outreach—might be most effective for accurately counting different parts of California. Stay tuned for more posts that examine hard-to-count communities in other regions of the state.


Strong Support for California’s Climate Leadership

From September 12 to 14, Governor Jerry Brown will co-chair the Global Climate Action Summit in San Francisco. This gathering of world leaders will review achievements to date and discuss next steps in meeting the international goals established to reduce greenhouse gas emissions. How do Californians feel about their state playing such a prominent role in the global warming policy arena?

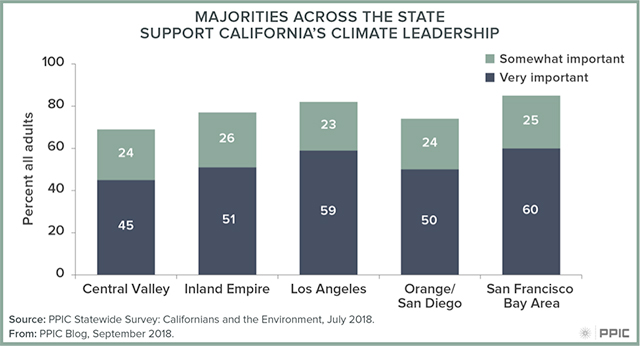
In the July PPIC Statewide Survey, a majority of California adults told us that California’s climate change leadership around the world is very (54%) or somewhat (24%) important to them; findings are similar among likely voters (51% very, 22% somewhat). Last July, after the Trump Administration’s decision to exit the Paris Agreement on climate change, a similar proportion of adults (58% very, 23% somewhat) and likely voters (52% very, 20% somewhat) said the state’s leadership was important. Today, overwhelming majorities of Democrats (95%) and independents (78%) and 41% of Republicans say it is important that California acts as a leader around the world. Majorities across age, education, gender, income, racial/ethnic groups, and regions of the state say this is important. Six in ten or more Latinos (68%) and African Americans (65%), Democrats (67%), San Francisco Bay Area residents (60%), and those with children under 18 (60%) say this is “very” important.

blog figure: Majorities across the state support California's climate leadership

These views are aligned with Californians’ willingness for the state to determine its own destiny in this policy arena. In the July survey, majorities of Californians (65% adults, 62% likely voters) favor having the state government make its own policies, separate from the federal government, to address the issue of global warming. Since we first asked this question in July 2005—throughout changes in presidents, governors, and party leadership in Washington, DC and Sacramento—more than half of Californians have favored state action on this issue.

blog figure: Majorities of Californians favor state action on global warming

Today, solid majorities of Democrats (82%) and independents (61%) and 29% of Republicans favor the state government making its own global warming policies. Majorities across age, education, gender, income, racial/ethnic groups, and regions of the state are in favor. Seven in ten or more are in favor among residents in Los Angeles (73%) and the San Francisco Bay Area (73%), Asian Americans (71%) and Latinos (70%), those under age 35 (75%), and college graduates (73%). Majority support has also been consistent for state policies (i.e., AB 32, SB 32) aimed at reducing greenhouse gas emissions.

What explains this California “exceptionalism” when it comes to climate change actions? In the July PPIC survey, two in three Californians (67% adults, 69% likely voters) say the effects of global warming have already begun. In thinking about the possible impacts of global warming in California, most residents express concerns about more severe wildfires (62% very, 23% somewhat), ocean warming (50% very, 28% somewhat), and rising sea levels (45% very, 29% somewhat). More than eight in ten Californians say that the issue of global warming is personally important to them (28% extremely, 34% very, 20% somewhat). These findings suggest that recent weather events—combined with a growing body of scientific evidence on climate change—have tapped into the long tradition of environmental stewardship in California.

This global meeting occurs at a critical moment for the state. PPIC is hosting related events and, along with many Californians, we look forward to learning more about what Governor Brown called “the existential threat of climate change” in convening this summit.

2020 Census: Counting the Inland Empire

The decennial census plays an essential role in American democracy. The stakes are huge for California, and 2020 is fast approaching. This series of blog posts takes a detailed look at California communities that may be at risk of being undercounted.

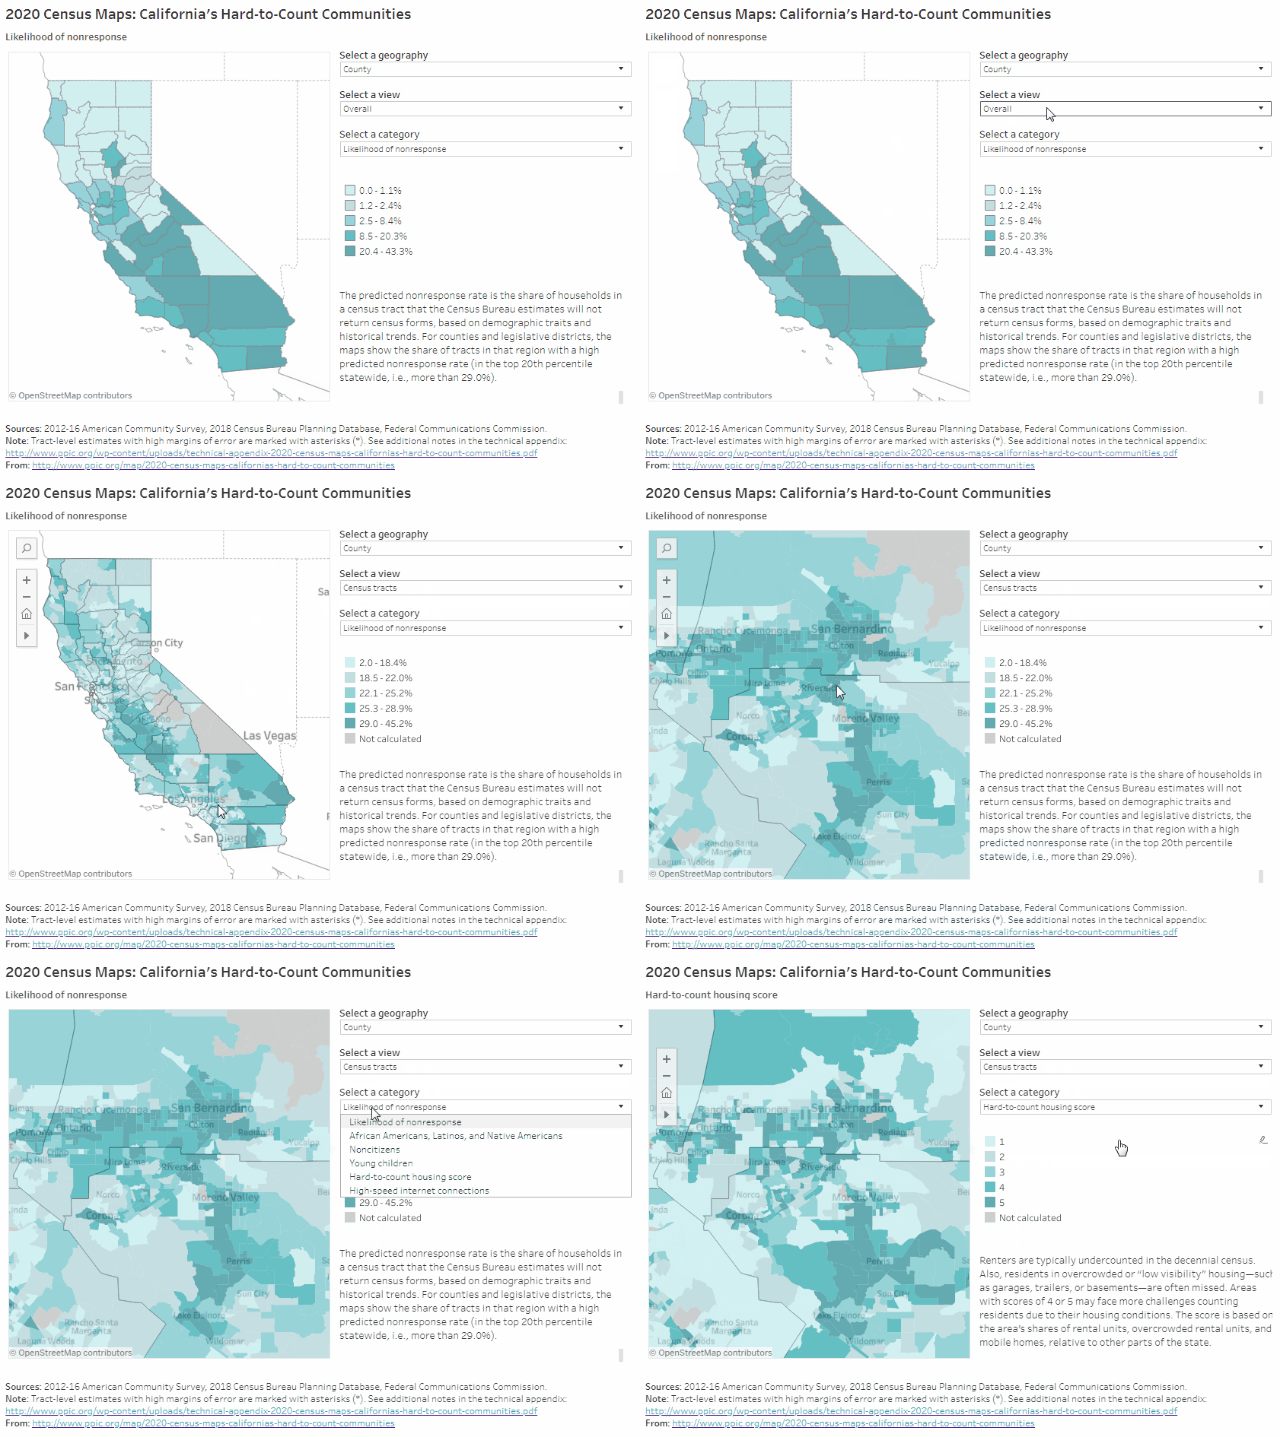
PPIC’s interactive census maps are an important tool for Californians working to ensure an accurate census count. Using estimates from the Census Bureau and the Federal Communications Commission, they highlight hard-to-count communities across the state and pinpoint reasons why certain areas may be hard to reach.

The Inland Empire is home to more than 4.5 million Californians (over 11% of the state’s population). About 29% of census tracts in San Bernardino County are likely to be very hard to count, compared to 17% in Riverside County, according to Census Bureau estimates that draw on demographic characteristics and historical trends. Households in these very hard-to-count areas are less likely to respond initially to census forms and are therefore at risk of being undercounted. Many hard-to-reach census tracts are clustered in and around the San Bernardino–Riverside metro area, including the neighboring cities of Moreno Valley and Ontario.

Some highlights:

  • Very hard-to-count communities in the Inland Empire tend to be concentrated in urban legislative districts. Since legislative district lines will be redrawn based on the census, disproportionately undercounting parts of the Inland Empire could affect the region’s political representation. For example, in Congressional Districts 31 (Aguilar) and 35 (Torres), more than 30% of census tracts are likely to be very hard to count. The same is true for State Senate District 20 (Leyva) and State Assembly Districts 40 (Steinorth), 47 (Reyes), and 52 (Rodriguez).
  • Undercounting people of color could disproportionately affect the Inland Empire. African Americans, Latinos, and Native Americans tend to be undercounted in the census. These groups make up more than half of the population in the Inland Empire—54% in Riverside County and 60% in San Bernardino County—compared to 45% statewide. In metro areas, over 80% of residents in many neighborhoods are people of color. The Inland Empire also includes several tribal reservations, such as those southeast of Coachella and northwest of Palm Springs.
  • Parts of the Inland Empire have particularly high shares of young children. Young children are historically underrepresented in the census. Riverside and San Bernardino Counties have relatively high percentages of young children (6.8% and 7.3%, respectively) compared to the state as a whole (6.5%). Certain areas have even higher concentrations of families with young children: children under five years old make up between 9% and 11% of the population around Victorville, in western San Bernardino County, and the same is true for numerous census tracts around the city of San Bernardino.
  • Communities can be hard to count for multiple reasons. Housing conditions (high shares of rentals, overcrowded rental units, and mobile homes) may make it more difficult to count residents accurately. There is hard-to-count housing throughout the Inland Empire, with pockets in metro areas, south of Moreno Valley, and in the rural eastern parts of the region. Residents may also be hard to count for other reasons. For example, in some areas with hard-to-count housing, many residents are noncitizens—who may be less likely to respond in 2020 due to the planned addition of a citizenship question. Recognizing ways that hard-to-count communities intersect with each other will be critical to conducting effective outreach to Inland Empire residents.
  • Rural areas tend to have lower internet access, as do some urban neighborhoods. The US Census Bureau plans to collect the majority of responses online in 2020—a change from previous practice. The eastern, rural parts of the Inland Empire have low levels of residential high-speed internet access and therefore may face more challenges responding to the census online. We also see lower levels of access in the city of San Bernardino and Moreno Valley relative to surrounding areas. It’s important to note that people may still have internet access through smartphones, public libraries, or other services.

We hope these maps serve as a starting point to help local, regional, and state leaders think about which activities, resources, and partnerships—including language assistance, awareness raising, and community outreach—might be most effective for accurately counting different parts of California. Stay tuned for future posts that examine hard-to-count communities in other regions of the state.

2020 Census: Counting the San Joaquin Valley

The decennial census plays an essential role in American democracy. The stakes are huge for California, and 2020 is fast approaching. This series of blog posts takes a detailed look at California communities that may be at risk of being undercounted.

PPIC’s new interactive census maps are an important tool for Californians working to ensure an accurate census count. Using estimates from the Census Bureau and the Federal Communications Commission, they highlight hard-to-count communities across the state and pinpoint reasons why certain areas may be hard to reach.

Home to 4.3 million people, the San Joaquin Valley may be one of California’s hardest-to-count regions in 2020. Encompassing about 11% of the state’s population, the valley runs south from San Joaquin County through Stanislaus, Merced, Madera, Fresno, Tulare, Kings, and Kern Counties. Most of the communities at risk of being undercounted in the region live south of Stanislaus County through Kern County. For example, 33% of census tracts in Fresno County are likely to be very hard to count, according to Census Bureau estimates that draw on demographic characteristics and historical trends. But only 7% of tracts in Stanislaus are very hard to count. Households in these very hard-to-count areas are less likely to respond initially to census forms and are therefore at risk of being undercounted.

Some highlights:

  • An undercount could reshape the legislative landscape of the San Joaquin Valley. Since legislative district lines will be redrawn based on the census, disproportionately undercounting parts of the San Joaquin Valley could reshape the region’s political representation. And while hard-to-count communities are distributed across several counties in the region, they are concentrated in fewer legislative districts. In Congressional Districts 16 (Costa) and 21 (Valadao), for example, about 42% of census tracts are likely to be very hard to count. Undercounting could also affect the northern San Joaquin Valley, which has hard-to-reach areas despite having fewer historically undercounted populations.
  • Undercounting people of color and noncitizens could disproportionately affect legislative districts in the central and southern San Joaquin Valley. This area has particularly high shares of groups that tend to be undercounted in the census—African Americans, Latinos, and Native Americans, as well as noncitizens, who may be even less likely to respond in 2020 due to the planned addition of a citizenship question. A total of six legislative districts have populations that are at least 65% African American, Latino, or Native American and at least 15% noncitizen: Congressional Districts 16 and 21; State Senate Districts 12 (Cannella) and 14 (Vidak); and State Assembly Districts 31 (Arambula) and 32 (Salas).
  • Another factor driving the San Joaquin Valley’s overall risk of being undercounted is the high share of young children. Young children are historically underrepresented in the census. There are particularly high concentrations of families with young children in the central and southern San Joaquin Valley: children under 5 years old make up 8% or more of the population in Fresno, Kern, Kings, Merced, and Tulare Counties—among the highest concentration in the state.
  • Housing conditions may make an accurate count especially challenging in the western San Joaquin Valley. In this area, relatively large shares of housing units are rentals, overcrowded rentals, and/or mobile homes—all of which can make residents harder to find and count accurately. For example, more than 20% of households live in mobile homes in some northwestern parts of San Joaquin County and some southwestern parts of Tulare County.
  • Limited internet access may be an issue in certain areas throughout the region. The Census Bureau plans to collect the majority of responses online in 2020—a change from previous practice. Each county in the San Joaquin Valley has some census tracts with minimal residential high-speed connectivity, with the lowest access outside cities. While people in these areas may have internet access through smartphones or public libraries, in general they may have more trouble accessing the census online.

We hope these maps serve as a starting point to help local, regional, and state leaders think about which activities, resources, and partnerships—including language assistance, awareness raising, and community outreach—might be most effective for accurately counting different parts of California. Stay tuned for future posts that examine hard-to-count communities in other regions of the state.

Video: A Conversation with Congresswoman Nancy Pelosi

As part of our Speaker Series on California’s Future, PPIC is inviting elected leaders across the political spectrum to participate in public conversations. The purpose is to give Californians a better understanding of how our leaders are addressing the challenges facing our state.

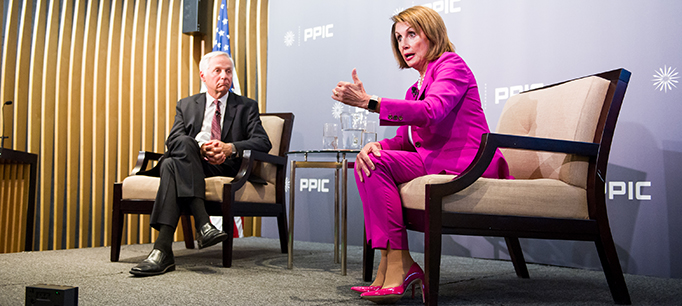
House Democratic Leader Nancy Pelosi and PPIC president Mark Baldassare had a wide-ranging conversation in San Francisco on Wednesday. They focused on the relationship between California and the federal government in a number of areas, including economic and tax policy, immigration, health care, and environmental issues.

Not surprisingly, Pelosi’s take on the state-federal relationship differs from that of her Republican counterpart, Kevin McCarthy, who fielded virtually the same questions from Baldassare in mid-August. In her view, this is an unusual time: “We haven’t had a time where the president has so targeted a state, in tax policy, environmental policy, trade policy.” Californians need to know about the statewide impact of these policies, and their elected leaders need to “try to work as much as possible in a bipartisan way to withstand that.”

She criticized the new federal tax law for significantly increasing the national debt without promoting growth. In fact, she continued, one of the best ways to promote economic growth is to enact comprehensive immigration reform. Asked what this would look like, she cited the bipartisan immigration bill that the Senate passed several years ago as one possible model. She deplored the current “uncivilized, inhumane” policy of separating families at the border. But she argued that while Trump-era ICE policies need to be changed, abolishing ICE is “not the answer.”

Pelosi, who played a major role in the passage of the Affordable Care Act, described health care reform as a “pillar of health and economic security for America’s working families.” She also characterized health care as a major issue in the November midterm elections. “The cost of health care is a very major issue in people’s lives, so we want to work in a bipartisan way, wherever possible, to reduce those costs.”

While she is concerned that Congress is not doing enough to ensure the integrity of the midterm elections, Pelosi is excited about the number of women who are running. “When I went to Congress, there were 12 Democratic and 11 Republican women.” Now, she added, “the majority of the people in our caucus are women, people of color, LGBTQ [. . .] and we want more!”

Why does she want to be Speaker? The short answer: “None of us is indispensable, but I think I’m probably the best person for the job.”