Community College Placement: Lessons from North Carolina


This post is part of an occasional series examining how California can learn from policies in other states.

Every year, California’s community colleges identify the vast majority of entering students as not ready for college-level courses in math and English. Since these courses are required to earn a degree or transfer to a four-year college, students deemed underprepared are placed in developmental (also known as remedial or basic-skills) courses to prepare for college work. Placement has a profound effect on students’ college trajectory: most developmental education students never earn a degree or transfer.

Concerns about poor outcomes have led California’s community colleges to reexamine their assessment and placement policies. How do colleges currently assess and place students? Are too many students placed into developmental courses? At PPIC, we will examine this topic in the months ahead. Reforms in other states can also help inform upcoming changes in California.

Policy: Uniform Assessment Test and Cut Scores in North Carolina

Prior to 2013, the North Carolina Community College System (NCCCS) allowed a great deal of local autonomy in assessment and placement policies—similar to California’s community colleges today. NCCCS provided a list of permitted assessments, but each of the 58 colleges decided on the specific tests (e.g., Accuplacer, Compass, or Asset tests) and cut-off scores that determined students’ math and English placement. Local policymaking lets colleges take into account their course offerings—which can differ a great deal, especially at the developmental or pre-collegiate level—and the needs of the specific populations being served. But allowing individual colleges to determine placement rules inevitably leads to varying definitions of what it means to be college ready.

In 2012, research by the Community College Research Center at Columbia University found that placement tests were only weakly predictive of success in college courses at NCCCS and that high school records were as useful or better at predicting college-level course success. Beginning in 2013, NCCCS implemented several reforms that transformed its assessment and placement system: multiple measures, a customized diagnostic math assessment, and uniform placement rules. In addition, students achieving a minimum high school GPA or SAT/ACT score could enroll in college-level courses without having to take a placement test.

Policy Impact

There are a number of arguments for uniform assessment and placement policies: they can set a common definition of college readiness, align high school and college expectations, allow states to measure performance across colleges, and facilitate transfer between colleges in the same system.

Early evidence from Central Piedmont Community College in Charlotte, North Carolina, also suggests that systemwide assessment and placement reform can significantly increase the number of students directly enrolling in college-level math and English. At Central Piedmont, 54% of students enrolled directly into these courses in fall 2015, up from 36% in fall 2012. It also appears that more students were able to complete college courses with no significant changes in pass rates. As more data is collected and analyzed, it will be important to see if these promising findings hold for colleges across the system and for different student groups.

Lessons for California

As California’s community colleges plan to implement a common assessment, the system must balance centralized decision making and local autonomy as well as rigorous standards and broader access. There is mounting evidence that more consistent and broader access to college-level courses contributes to improved student progress and more equitable outcomes. But some research does suggest that these reforms could result in lower course pass rates. For this reason, broader access to college-level courses should be complemented by increased support for faculty and academic supports for struggling students.

Learn more

Read Higher Education in California: Improving College Completion
Visit the PPIC Higher Education Center

Comparing College Readiness across States

How does California compare to other states in preparing students for college? This isn’t necessarily a straightforward question to answer, because most cross-state metrics, such as Advanced Placement or SAT performance, only capture the subset of students who are thinking seriously about college. However, California’s new 11th-grade assessments are aligned to college-readiness standards and administered in many other states—allowing us see how California compares to other states in preparing all students for college.

These new Smarter Balanced Assessment Consortium (SBAC) tests are aligned with the Common Core curriculum standards. The 2015–16 school year was the second year of statewide administration of these tests for students in grades 3–8 and grade 11 in California.

A high enough score on the 11th-grade test is an early guarantee that students can take college-level courses, rather than remedial courses, upon enrolling at any California State University (CSU) and most community colleges in the state. As part of California’s Early Assessment Program, students who score in the highest level (“standard exceeded”) in English language arts (ELA) or math are exempt from remediation at participating colleges. Students who score in the second highest level (“standard met”) are considered conditionally ready for college coursework and may become exempt from remediation upon successfully completing a specified course in the 12th grade. Ten other states also participate in the exam, and while the test scores don’t affect college remediation for all colleges in every state, over 200 colleges across most of the states accept the scores.

In California, 13% of 11th graders were ready for college courses in math and 20% were conditionally ready. In English, 26% were ready and an additional 33% were conditionally ready. California ranks about in the middle of all other states taking the exams, a surprising result considering previous standardized tests such as the National Assessment of Educational Progress have consistently placed California students as among the lowest-performing in the nation. Moreover, of the states using the exams, California has the largest share of students in the federal free or reduced-lunch program (a proxy for low-income status) and by far the largest share of English Learners. Students from both groups are about half as likely to be prepared for college compared with their peers. In other words, the California scores are perhaps more impressive in light of the barriers to college readiness that more California students face.


Does this mean that California is doing a good job preparing students for college? This 11th-grade test is meant to be an early signal to students of their college readiness. Students also have their senior year to prepare for college, and the readiness levels of 59% in English and 33% in math will likely improve by the end of 12th grade. However, for students who do go to college, remediation rates are still high at CSU (40%) and community colleges (80%), and haven’t changed much since the new assessments began. These results and cross-state comparisons show us that California has room for improvement and may face more challenges than other states moving forward.

Learn more
Visit the PPIC Higher Education Center

Race, Ethnicity, and For-Profit College Enrollment

After expanding rapidly for several years, enrollment in for-profit colleges has been declining since 2011. The decline in enrollment, which PPIC has noted, coincides with investigations of predatory for-profit marketing practices, restrictions on Cal Grant eligibility for some for-profit schools, and various closures, most recently ITT Tech.

During the period of rapid growth (between 2004 and 2011), enrollment in for-profits grew across every racial/ethnic group. While white and Latino students account for more than half of enrollment, African American enrollment saw the greatest growth―total for-profit enrollment doubled, but African American enrollment more than quadrupled.

Overall African American postsecondary enrollment increased by more than 46,000 students, and three-quarters of that growth was due to increased enrollment in for-profit schools. In 2004, the statewide share of African Americans enrolled in for-profit schools (8%) was similar to the share of African American high school graduates (7%). By 2011, African Americans made up 15% of overall for-profit enrollment, compared to about 7% of high school graduates meaning they made up disproportionately high share of for-profit enrollment relative their high school graduates numbers.

Since 2011, for-profit enrollment has steadily declined. From 2011 to 2014, for-profits saw a 20% drop across all racial/ethnic groups, while total postsecondary enrollment fell by only about 4%. In the same timeframe, total African American postsecondary enrollment fell about 13%, and much of that decline was due to falling enrollment at for-profit institutions and community colleges. Even so, one in five African American students are still enrolled in for-profit institutions, compared to fewer than one in ten white, Asian, and Latino students.

The fact that the overall African American postsecondary enrollment has dropped twice as much as this group’s high school graduation rate suggests that African American college enrollment may not be shifting from for-profits to other California institutions. If additional for-profits close, the college-going rate of African American students may continue to fall. Indeed, it may have fallen over the past year—we don’t yet have data on what has happened with enrollment since the shuttering of large for-profit institutions such as Heald, Wyotech, and ITT Tech.

What can public and nonprofit colleges do to attract students who have been or would be likely to enroll in for-profits? Some community colleges are reaching out to the ITT Tech students, and several colleges are starting to adopt some of the practices many students find enticing about for-profit institutions, including online courses and more flexible course scheduling. In addition to ensuring that more Californians, and more African Americans in particular, attend college, public and nonprofit institutions could help prevent high levels of student debt, which students in for-profit colleges are more likely to accrue and default on than students at other institutions.

Learn more

Read Higher Education in California: Making College Affordable
Visit the PPIC Higher Education Center

The Growing Gender Divide in Higher Education

In California and across the nation, women have surpassed men in educational attainment. In 2006, for the first time ever, a majority of college graduates in the state were women. By 2014, 52% of California adults ages 18 to 64 with at least a bachelor’s degree were women, up from 45% in 1990. This gender divide in educational attainment is likely to continue to grow because the disparity is especially notable among younger adults: in 2014, 718,000 (55%) of California’s college graduates under 30 were women, compared to only 588,000 men.

Why are women now more likely to earn a college degree than men? The most direct and obvious answer is that women are more likely to be prepared for college, and thus more likely to enroll in college and graduate from college once enrolled. For example, among high school graduates in California, women are more likely to have completed the courses required for admission to the University of California and California State University. In 2014–15, almost half (49%) of female high school graduates completed these college preparatory courses, compared to only 38% of their male peers. This gap has grown since 2004–05, when 39% of female and 31% of male high school graduates completed these college preparatory courses.

Better academic preparation among women leads to higher college enrollment and graduation rates. According to US Department of Education data, 55% of all undergraduates enrolled in California’s colleges and universities in 2014 were women. And once enrolled, women are more likely to graduate. Six-year bachelor’s degree completion rates in the state were 61% for women and 57% percent for men.
The strong progress that women have made in higher education is good news. Yet inequities remain. Female college graduates earn less than their male peers. Women also have lower rates of employment than men. Policies that promote pay equity, flexible work schedules, and parental leave may help address these issues.

Women are especially underrepresented in important fields such as computer science and engineering—as are African American and Latino men. For California to meet the challenges of the 21st century economy, we need even more women and men—including those from groups traditionally underrepresented in higher education—to earn a college degree.

Learn more

Visit the PPIC Higher Education Center

Free University Tuition: How Many California Students Would Benefit?

During this election cycle, several candidates have proposed making public college tuition free. While some at the state and national levels are supporting tuition-free community college, Hillary Clinton has outlined a plan that includes four-year colleges—she proposes free tuition for students whose families earn less than $85,000. By 2021 that income threshold would rise to $125,000. How many students in California might benefit from such a plan?

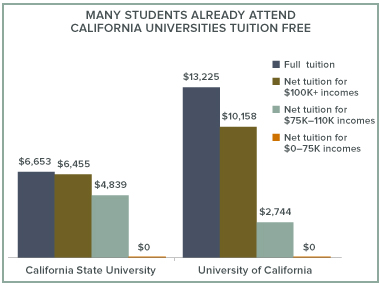
Many students already attend California universities tuition free

California’s financial aid program, Cal Grants, provides grants (funding that students do not have to pay back) for full tuition for the state’s lowest-income students, as well money toward books and living expenses for some of them. Through a combination of Cal Grants, federal aid, and institutional aid, UC’s Blue and Gold Opportunity plan guarantees free tuition for any family making $80,000 a year or less. CSU has a similar plan, the State University Grant, which bases the amount a family will pay on a number of factors. On average, students who receive financial aid pay no tuition at UC or CSU if their families make $75,000 or less.
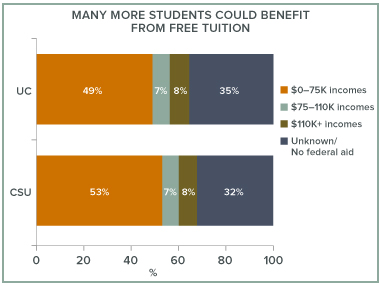
Expanding free tuition could impact thousands of California families

While the data on family income are not perfect, they can help us estimate how many students we might expect to benefit from free tuition. Right now, students from families in the $0 to $75,000 range make up about 49% of entering students at UC and 53% at CSU.

Raising the cap to $110,000—or beyond—would cover at least another 7% of students entering UC (2,300 students) and CSU (3,900 students) in 2014. The average student whose family income is between $75,000 and $110,000 would save about $4,839 at CSU or $2,744 at UC, resulting in more than $25 million in combined tuition savings for those thousands of families.

These estimates may be low, as many middle-class students who currently do not qualify for financial aid may have income levels that that would fall below the cap of an expanded program. Also, a nationwide free tuition program might encourage many low-income students who are currently scared off by the high sticker prices to apply to college or university.

The details of the plan would matter, of course. But if the federal government were to cover all of the $25 million needed to expand full-tuition guarantees at UC and CSU, it’s possible that thousands of low- and middle-income California students could benefit.

Notes: Data for both figures are from IPEDS for entering first-time California resident freshmen in fall 2014. Net tuition applies only to students who received some form of federal aid (grants or loans), which includes 68% of students at CSU and 65% of the students at UC.

Learn more

Visit the PPIC Higher Education Center

Getting Students from High-Need Schools into the UC System

The newly approved state budget contains two strategies to enroll more students from disadvantaged backgrounds in the University of California (UC) system and other postsecondary institutions. These spending commitments are designed to increase college readiness and access for the state’s most vulnerable students.

First, the state allocated $200 million to the new College Readiness Block Grant program, which funds “additional services that support access and successful transition to college” for three categories of students: English Learners, students from low-income families, and foster youth. This grant may support a variety of activities related to college readiness—including efforts to increase the number of students completing college preparation courses, such as the a–g course sequence required to attend UC. The College Readiness Block Grant is available to any school that serves students from these designated categories.

Second, the budget also includes funding for the UC system to monitor and increase application, admission, enrollment, and graduation rates among students from “high-need” schools—high schools where 75% or more of the students fall into one of the categories above. Currently, we know little about whether students from high-need schools attend UC and how to get more of them to enroll. I combined data on graduation from public schools and UC enrollment to explore these questions.

What do we know about high-need schools?

In 2015, about 38% of California’s high schools (480 total) were high need based on high rates of enrollment for English Learner, low-income, and foster care students. These schools educate about 34% of all high school students in the state. High-need schools also serve higher proportions of students traditionally underrepresented at UC: about 43% of the African American students in the state and about 51% of California’s Latino students.

High-need schools are less likely to produce graduates who have completed the a–g course sequence required to attend UC. The percentage of all graduates who complete a–g courses at the typical (50th percentile) high-need school is 39%, compared to 49% at regular schools. However, there is a lot of overlap. For example, the top quarter of high-need schools have higher percentages of a–g graduates than the bottom half of regular schools.

Do graduates from high-need schools enroll at a UC?

On average, students from high-need schools are slightly less likely to enroll in a UC. About 5.4% of all graduates enroll in a UC at a typical high-need school, compared to 6.5% for a typical regular school.

However, a–g completion rates are likely driving the difference in UC enrollment between high-need schools and regular schools, since students at regular schools are more likely to have completed a–g courses. When examining the number of UC enrollees compared to the number of a–g graduates a school produces, we see no difference between regular and high-need schools.

The College Readiness Block Grant program’s focus on helping to prepare students for college might be an effective strategy to increase UC enrollment from high-need schools that would not require many changes to admissions policy in the UC system. Evidence suggests that improving a–g completion rates at high-need schools will help boost UC enrollment of graduates from these schools.

Top figure note: Data from California Department of Education. Spring 2015 graduates. N=1,276 schools.

Bottom figure note: Data from California Department of Education, University of California, and California Postsecondary Education Commission (CPEC). Spring 2015 graduates compared to fall 2015 enrollees. “All graduates” refers to the ratio of graduates to enrollees from the school. “A–G graduates” refers to the ratio of a–g graduates to enrollees from the school. Fifteen percent of schools were not in the crosswalk provided by CPEC and are not used in the comparison of enrollees. Another 8% are not represented in the UC data set, but are present in the UC data and crosswalk, and thus are given zero enrollees for the purpose of these figures. N=1,072 schools.

Race and College Admissions in Texas


This post is part of an occasional series examining how California can learn from policies in other states.

Passed in 1996, California’s Proposition 209 prohibits colleges from considering race as a factor in admissions. Partly as a result, the University of California (UC) system does not fully reflect the diversity of the state’s high school graduates, a cause for concern among many observers. This disparity is even greater at the most elite campuses: UC Berkeley and UCLA. Other states facing bans on race-based affirmative action, including Texas, have developed alternative policies to address racial equity in college admissions.

Policy: Texas’s Top 10% Plan

In 1998, Texas instituted a two-part plan to promote diversity at its universities in response to the state’s ban on race-based affirmative action. The first part, the Texas Top 10% Plan, guarantees admission to any public Texas university to students in the top 10% of their high school’s graduating class. The plan relies on the fact that Texas high schools are highly segregated by race and income to produce a diverse set of students with guaranteed admission.

The second part of the plan fills any remaining spots at public universities with students from outside of the top 10%, and allows campuses to consider many factors, including race, during this process. This second part is being called into question in the Fisher v. University of Texas affirmative action case that was recently argued in front of the Supreme Court.

Policy Impact

Following the law’s implementation, the top school in the state, the University of Texas at Austin (UT Austin), saw more applications and enrollees from traditionally underrepresented high schools—those with high concentrations of minority students, from rural areas or small and midsize cities, and from less affluent regions throughout Texas. The policy also likely encouraged Latino students to apply and gain access to top Texas universities. Today, a majority of UT Austin students are top 10% students. The policy, however, did not produce the same diversity levels as affirmative action.

Lessons for California

UC already has a program called Eligibility in the Local Context (ELC), which guarantees admission for eligible students who are in the top 9% of their high school. Unlike the Texas plan, ELC does not guarantee students admission to the school of their choice—they are only guaranteed a spot somewhere in the UC system. Students who are eligible but do not get into their campus of choice are offered a spot at a campus with space—most often UC Merced. In 2014, over 11,000 UC-eligible students were referred to UC Merced, but very few enrolled.

UC’s guaranteed-admission plan has not led to high levels of diversity at its elite campuses. But would a guaranteed-choice plan like Texas’s work in California? A recent report by the Civil Rights Project shows that California has among the most segregated K–12 schools in the nation, so guaranteeing top students a spot at their preferred UC campus may give students in underrepresented groups across California a path to the top universities that ELC does not currently provide.

More research is needed to determine how California’s most competitive and prestigious public universities would deal with even higher demand. Texas’s results show that guaranteed admission alone can’t produce the same results as affirmative action, but it might be a part of an effective plan to remedy underrepresentation in California’s top universities.

Learn more

Does Free Community College Grow Enrollment?

This post is the first in an occasional series examining how California can learn from policies in other states.

Tuition-free community college has garnered increasing political support over the past two years. In his recent budget requests, President Obama proposed legislation entitled America’s College Promise to make community college free nationwide. Three states—Oregon, Minnesota, and Tennessee—already have free community college programs, while nine more are considering legislation to create similar programs.

Supporters say that making community college more affordable will increase enrollment and graduation. But will free community college increase overall college enrollment, or will it merely shift enrollment from four-year colleges to two-year colleges?

Policy: Tennessee’s College Promise
Tennessee’s College Promise program—the model for the federal America’s College Promise program—offered its first scholarships to students starting college in the 2015–16 academic year. This program is part of a larger effort to increase the state’s percentage of college graduates from 32% to 55% by 2025.The program provides “last-dollar” scholarships that cover the remaining cost of tuition after a student has used all other available federal, state, and local grant and scholarship aid. Funded by state lottery revenues, Tennessee’s College Promise program will cost an estimated $12 million and provide scholarships to nearly 15,000 students in its first year.

Policy Impact
Initial results suggest that free community college may shift enrollment, rather than growing enrollment. According to an article in the Tennessean, community college enrollment rose by nearly 14% following the program’s implementation, while enrollment at the state’s public four-year institutions decreased. At the University of Tennessee at Martin, enrollment declined by 13% in one year. The University of Tennessee at Chattanooga also saw declines in freshmen enrollment, while two nearby community colleges saw dramatic increases.These preliminary results run counter to national trends, which have shown a shift in enrollment away from community colleges to public four-year institutions since 2010.

Lessons for California
California’s community colleges play an essential role in our higher education pipeline. They often serve non-traditional and underserved minority students, and provide workforce training to help students ascend the economic ladder. If providing free community college increased enrollment and graduation, this could lead to higher earnings, more tax revenue, and reduced demand for social services in the state.

But there’s a chance the policy could limit degree production. According to our research, students who begin their postsecondary career at a four-year college are much more likely than those who enroll at a community college to earn a bachelor’s degree, even when controlling for student characteristics. For example, students from low-income families who begin at a four-year college are, on average, two to three times more likely to finish their bachelor’s degree, regardless of their high school GPA.

Other approaches to making college more affordable might have a bigger impact. In California, two-thirds of students already receive free tuition, and about 90% of the cost of attending community college comes from living expenses. Increasing state awards for non-tuition educational costs would be a logical step to improve student access and educational attainment. The Cal Grant B access award currently provides low-income students with up to $1,656 to help pay for items like books, housing, and food. If funding for this award, which started in 1969–70, had kept up with inflation, it would currently by worth over $6,000, nearly four times its current value.

Compared to other states, California ranks 47th in sending our high school graduates to four-year colleges. Improving access and affordability is vital, but California should make sure that policies also increase students’ likelihood of earning a bachelor’s degree, so that more individuals have the opportunity to realize the myriad benefits—economic and otherwise—that these degrees confer.

Figure source: Author’s calculations based on logit regression models using College Futures Foundation student data. Students followed for six years. Data and methods available in Technical Appendix A of the report Making College Possible for Low-Income Students.

Learn more

Visit the PPIC Higher Education Center

Video: Improving Graduation Rates at California State University

California State University (CSU), the nation’s largest university system, has steadily improved graduation rates, but there is more work to be done, PPIC researcher Jacob Jackson told a Sacramento audience last week.

The system still struggles with graduation gaps. Historically underrepresented students are much less likely than their peers to get degrees. Even though the system has higher six-year graduation rates than similar universities, it lags behind in the share of students who graduate in four years. This comes at a high cost to both the state and CSU students.

As CSU launches a new initiative to improve graduation rates, Jackson and fellow PPIC researcher Kevin Cook coauthored a report analyzing the system’s progress to date. The authors also describe promising strategies that could help CSU reach its goal of increasing graduation rates and cutting graduation gaps in half by 2025.

Learn more

Read the report, Improving College Graduation Rates: A Closer Look at California State University
Visit the PPIC Higher Education Center

Assessment and Placement at Community Colleges

The assessment and placement process often represents the first point of contact between incoming students and community colleges. This process aims to evaluate students’ readiness for college-level English and math courses, and for those deemed underprepared, to determine appropriate placement into the remedial—also known as developmental—education sequence. Estimates suggest that 75%–80% of incoming community college students across the state enroll in developmental education in at least one subject.

Despite the prevalence of this process, little is known about how the state’s community colleges assess and place students into math and English courses. The last statewide survey on this topic, conducted over five years ago by WestEd, found that community colleges used placement tests extensively, but the cut-off scores for placement varied a great deal across campuses. Additionally, the survey showed that the use of other student achievement measures for placement was sparse and unsystematic.

Greater clarity regarding assessment and placement is crucial for two reasons. First, decisions made about a student’s readiness for college have significant implications for that student’s educational trajectory. In California’s community colleges, only 40% of underprepared students ever complete a degree or transfer, compared to 70% of their college-prepared peers. Research shows that developmental education may discourage students or “divert” their academic progress, as students spend considerable time and money on developmental courses, but these credits do not count toward a college degree or transfer.

Second, the possible overreliance on placement tests may be cause for concern. The Community College Research Center has found that the placement tests commonly used at colleges across the country are not strongly predictive of student success in college-level courses. In fact, these tests tended to under-place students, meaning students were placed into developmental courses when they could have passed college-level courses. This research also demonstrated that high school grades and other pre-existing student achievement data could do a comparable or better job at predicting success in college-level courses.

More comprehensive research in these areas would allow the state’s community colleges to identify assessment and placement reforms that help improve outcomes for all students. As a step forward in this effort, the Public Policy Institute of California (PPIC) is collecting survey data on the current assessment and placement policies and practices at California Community Colleges. These survey results will help pinpoint the different measures used to assess the math and English skills of incoming students and the ways in which these measures determine appropriate placement.

This research comes at an important time, since more change is underway. As part of the Common Assessment Initiative, over the next several years, community colleges will begin to use a common placement test, set locally determined cut-off scores, and enhance their use of multiple measures. PPIC’s survey will establish a benchmark of the assessment and placement process prior to the implementation of these statewide reforms.