Video: 2020 Election Preview

Now that California’s presidential primary has been moved from June to March, how might the state’s electorate influence the 2020 election, and how are the major parties engaging with voters? At a lunchtime event in Sacramento last week, PPIC president Mark Baldassare provided an overview of voter participation in California and KQED’s Marisa Lagos moderated a lively, wide-ranging discussion of the upcoming election season.

Lagos, who covers California politics and government for KQED, noted that California has long been a “piggy bank” for presidential candidates in both parties. She asked whether the earlier primary date will increase the state’s influence. “Guess what? You’re still the piggy bank!” joked Tamara Keith, White House correspondent for National Public Radio.

More seriously, Keith noted that it isn’t clear whether “California will come into the process soon enough to make a difference or whether things will have started settling out after Iowa and New Hampshire.” She added that because it takes weeks for the state to count its absentee ballots, “there’s a chance that the race will have already advanced a lot by the time California’s results are fully in.”

Rusty Hicks, chair of the California Democratic Party, said that the earlier primary date offers opportunities for presidential candidates to engage voters across the state. “You have top-tier candidates going to the northern rural parts of the state. They’re going to the Central Valley, they’re going to the Inland Empire.” In his view, this is “a real opportunity to showcase the state . . . it’s more than the Bay Area and Los Angeles.”

From the Republican perspective, the early presidential primary doesn’t make a big difference. But Jessica Patterson, chair of the California Republican Party, sees opportunities on the state level. “We have the opportunity to change the entire makeup of the building across the street.” The party is focused on “making sure we’re engaged in communities . . . to talk about the things that are important to them, and really focus on fixing our state.”

While their perspectives differed in many ways, both Patterson and Hicks stressed the importance of working together to empower and represent all Californians. “I think we all have an interest in ensuring that we have an engaged and empowered electorate,” said Hicks. Patterson agreed, adding that “it’s better for all of us when we find ways that we can work together.”


Californians and the 2020 Election

This post is excerpted from my opening remarks at PPIC’s annual Sutton Family Speaker Series event, “2020 Election Preview earlier today, in Sacramento.

All eyes will be on California when voters make their choices in the upcoming presidential primary on March 3. Last year, California experienced a surge in voter registration and voting. On the heels of record low turnout in 2014, the 2018 election had the highest turnout for a midterm in California since 1982. Still, PPIC colleagues report that turnout is low compared to other states.

To help make sense of the state’s voting patterns, PPIC has just released a new report titled California’s Exclusive Electorate: A New Look at Who Votes and Why It Matters, which analyzes data from the last nine waves of PPIC Statewide Surveys and includes responses from nearly 15,200 California adults. These latest findings, built on a PPIC study that was first published in 2006 and then updated in 2016, help us to set the context for this 2020 election preview event. While much is changing in the electorate, many patterns stubbornly persist.

Growth in political participation has been strong in the wake of significant changes in our state’s election laws and because we live in such interesting times for national politics. However, it is noteworthy that about 5 million California adults are not eligible to vote, while about 5 million eligible adults are not registered and about 7 million registered voters did not cast a ballot in November 2018. If past trends are any indication, only about half of California’s approximately 31 million adults will vote in the November 2020 general election, and far fewer will cast ballots in the March 2020 primary.

Importantly, the demographic makeup of the electorate is not representative of the people of California. Voters in California tend to be white, affluent, college educated, and homeowners. Nonvoters are more likely to be younger, Latino, renters, lower income, less educated, and to self-identify as the “have nots” in society. While some gaps have narrowed, a wide gulf remains between voters and nonvoters.

Because of their stark differences, voters and nonvoters are not aligned in their views of the role of government. For instance, only 41 percent of likely voters prefer a bigger government that provides more services, while 73 percent of nonvoters and 54 percent of all adults do so. Preferences vary in similar ways when asked if the government should be doing more to reduce the gap between the rich and the poor, or if the government should do more to make sure that all people have an equal opportunity to get ahead.

figure - Nonvoters Tend To Prefer a Bigger Government and More Services

What would change if more nonvoters turn out for the March primary and November election? Presidential candidates who favor a more expansive government role would get a boost, and so would proponents of state bond measures and citizens’ initiatives to raise taxes on the wealthy. President Trump’s approval rating here is much lower among nonvoters than likely voters (24% to 38%) and, thus, a higher turnout would also help the Democratic candidates in competitive US House races—as it did in 2018.

Expanding the electorate might also inject some idealism into the cynicism and divisiveness of politics today. Nonvoters are more optimistic about the prospect that Americans of different political views can still come together and work out their differences. California still has a long way to go, but the movement toward a more representative electorate that we are starting to see is a step in the right direction for a state that calls on voters to make decisions that impact all of its residents.

In the meantime, PPIC Statewide Surveys will continue to poll all adults so that elected officials can take into account the needs and wants of all of the people they were elected to represent, and not only the likely voters, in a consequential 2020 election year.

Election Takeaways: Golden State of Mind

With the release of California’s official Statement of the Vote, the state’s final tally is in for the November 2018 election. This midterm election will mostly be remembered for California’s role in changing party control of Congress. But several other statewide results also stand out:

  • High turnout. A record-setting 19,696,371 Californians—78% of eligible adults—were registered to vote by the deadline for the general election. An increase of 1,892,548 registered voters since the 2014 general election represents the biggest surge in voter registration between midterm elections in the past 20 years, according to California’s Secretary of State. The 12,712,542 voters who cast ballots is an all-time high for a midterm and, at 65% of registered voters and 50% of eligible adults, this is the highest midterm turnout in the past 30 years. These increases follow record low turnout in 2014. Many factors were at work in heightening political engagement this fall, including intense media interest in California congressional races that carried over from the June primary; voter participation that was stoked by disapproval of President Trump and dislike of his immigration, environment, and tax policies; and new state laws that are being implemented to make it easier for Californians to register to vote and cast ballots.

  • Blue wave. Democratic candidates won every statewide race and gained enough state legislative seats to have well over a two-thirds majority in the state assembly (60 Democrats, 20 Republicans) and state senate (29 Democrats, 11 Republicans). Democrats also increased their grip on the California congressional delegation (46 Democrats, 7 Republicans). What accounts for this one-party dominance? Midterm elections are often described as a referendum on the president, and President Trump’s approval rating was at 39 percent in the October PPIC survey. PPIC surveys also found an “enthusiasm gap” in voting for congressional candidates, which further skewed the partisan turnout in favor of Democrats. But the difficulties facing Republican candidates go beyond this fall’s political headwinds. The November ballot did not even include Republican candidates for US senator, lieutenant governor, or insurance commissioner—no Republicans made it past the top-two June primary for these offices. The Republicans have not won a statewide race since 2006 and, in this time, their share of the electorate has declined by 10 points (34% to 24%) while their ranks have also diminished (5.4 million to 4.7 million), according to the Secretary of State.
  • Diverse officeholders. Gavin Newsom was elected governor in the only statewide race featuring two white men. California’s other statewide winners were four women, three Latinos, two Asian Americans, one African American, and one openly gay man. Notably, women candidates won all their races while all those who lost—five Republican candidates, the sole No Party Preference candidate, and a nonpartisan candidate—were white men. However, regional diversity was missing, with six successful candidates from the San Francisco Bay Area and three from the Los Angeles region. There were none representing the populous regions of the Central Valley, the Inland Empire, and the South Coast (Orange/San Diego)—or the more sparsely settled central coast and far north.
  • Words matter. Propositions 1 and 2, placed on the November ballot by the legislature, passed—consistent with the historically high pass rate for legislative ballot measures. However, just three of the eight citizens’ initiatives passed, consistent with the historically low pass rate for these types of initiatives. Among the most notable failures were the Proposition 6 gas tax repeal and the Proposition 10 rent control measure. The September PPIC Survey found that about half of likely voters favored the general idea of both the gas tax repeal (50%) and rent control (52%), but only four in ten said they would vote yes when they were read the ballot titles and labels. The defeat of Proposition 6 (56.8% no) and Proposition 10 (59.4% no) once again demonstrates that the devil is in the details when it comes to voter support for citizens’ initiatives on the ballot.

It’s no coincidence—given what PPIC studies say about the profiles of likely voters and nonvoters—that rising political participation in California means that the Democratic Party is becoming more dominant and that statewide officeholders are more likely to reflect the state’s diversity. And it is important to note that Californians continue to be highly selective about making public policy at the ballot box as more and more voters engage with the citizens’ initiative process. Still, millions of Californians are not registered to vote and don’t cast ballots. These residents tend to identify as “have nots” and are often most in need of government services. For this reason, the PPIC Statewide Survey will continue to provide a voice—for all adults in addition to likely voters—on state and national issues. Tracking policy preferences across the broadest swath of Californians is especially critical today, as newly elected state officeholders and state and federal legislators switch from campaign mode to policymaking.

Primary Takeaways: Democracy Is Alive and Well in California

With the release of the official Statement of the Vote, the final tally is in for the 2018 California primary. The election outcomes are encouraging news for California’s democracy—especially in light of criticisms of the top-two primary system by the national media. Several important statewide trends stand out:

  • Strong political participation. A record-setting 19 million Californians—75.7% of eligible adults—were registered to vote in the gubernatorial primary. This threshold has not been reached since the middle of the 20th century. Moreover, the 7.14 million voters who cast ballots is an all-time high for a gubernatorial primary and, at 37.5% of registered voters and 28.4% of eligible adults, the turnout rates are the highest reported in the five gubernatorial primaries since 2000. Since his election four years ago, California Secretary of State Alex Padilla has been on a mission to make it easier for Californians to register to vote and cast ballots, and the efforts seem to be working. The May PPIC survey found that likely voters’ attention to election news was relatively high, so credit also goes to the media for stoking interest in political participation.

  • More independent voters. Many Californians are responding to the hyper-partisanship of national politics by eschewing the major parties and registering as independents (also known as NPP for “No Party Preference”). In June’s election, for the first time in the state’s history, NPP voters outnumbered Republican voters (25.5% to 25.1%). In the past four years, the number of NPP voters increased (+1,103,602) more than the number of Democratic voters (+745,598), while Republican ranks shrunk (-267,311). The makeup of the June ballot reflected the political clout of NPP voters. Four of the statewide races included NPP candidates, giving voters some nonpartisan choices they did not have under the previous primary system. And in a first for the general election, the top two candidates for insurance commissioner are a Democrat and an NPP candidate (formerly a member of the Republican Party).
  • Diverse statewide candidates. After much consternation about the likelihood of a single-party race at the top of the ticket, five of the eight partisan races—including the governor’s—feature a Democrat running against a Republican. Except for the governor’s race, the top-two primary results offer a diverse pool of candidates to choose from in the fall, at least among Democratic options. The US Senate election and the seven down-ticket races include five Latinos, four women, two Asian Americans, and one African American. Also, eight of the nine statewide races—including the governor’s—are contests between Northern and Southern Californians. While many Republicans are likely to skip voting in a US Senate race with two Democratic candidates, as they did in November 2016, a Democratic-only race for the open lieutenant governor seat will be closely watched for signs of cross-party voting.
  • Popular state ballot measures. Four of the five state propositions placed on the June primary ballot by the legislature passed. This is consistent with the historically high pass rate for legislative ballot measures. With the legislature’s approval holding steady and at a relatively high level in the May PPIC survey, the four state propositions each passed by healthy margins—including a 58% “yes” vote for the state water and parks bond. The latter results bode well for the state housing bonds passed by the legislature and placed on the November ballot. (Citizens’ initiatives appear only on the November general ballot.)

The main takeaway from the June primary is that the vital signs of California’s democracy are healthy. In the wake of California’s many election reforms, records may be shattered in the numbers of registered voters and ballots cast this fall—and throughout the 2020s. The top-two primary system may have its quirks, but it is well suited for the burgeoning number of NPP voters. NPP candidates have found a home in the top-two primary, an NPP will be on the fall ballot, and there will likely be NPP statewide officeholders in the future. The fears about major party voters feeling left out of the fall election were overblown, and most top two candidates reflect the state’s diversity. Positive responses to the June ballot measures suggest an easy time for the state propositions from the legislature this fall; the fate of the nine citizens’ initiatives—including a repeal of the recent gas tax increase—is currently less clear.

At PPIC, the race for governor, US senator, and superintendent of public instruction stand out as uniquely worthy of public attention. We have invited the two candidates in each race to participate in conversations with me about the future of California. Stay tuned for more information about these public events. Meanwhile, throughout the fall the PPIC Statewide Survey will focus on the governor’s race, the US Senate election, and the congressional races—as well as the gas tax repeal and other state propositions that impact our future. We look forward to informing discussions and raising awareness about the importance of this consequential election for the state and nation.

Testimony: Who Votes, Who Doesn’t, and Why

Eric McGhee, PPIC research fellow, testified before the Little Hoover Commission in Sacramento today (May 25, 2017). Here are his prepared remarks.


Good morning Chairman Nava, Vice Chairman Varner, and distinguished committee members. My name is Eric McGhee, and I am a research fellow at the Public Policy Institute of California, where I study voter turnout and electoral and political reform more generally.

California’s voter turnout in 2014 hit record lows in both the primary and the general elections. Turnout recovered some in 2016, but languishing participation remains a concern moving forward. I was invited to your panel to help put California’s turnout in broader context and to give some thoughts on potential solutions. In doing so, I will address three questions:

  1. Who votes, and who doesn’t?
  2. What does California’s turnout look like over time and compared to the rest of the country?
  3. What should we expect from recent reforms, and what else should be tried to improve turnout?

Question #1: Who votes and who doesn’t?
California’s registered voters do not look like the population of all adults in the state. They are older, whiter, better educated, and a little wealthier; they are less mobile, more rooted in their communities, and more likely to own their own home; and they are more likely to identify with one of the two major parties and less likely to identify as independents.

Given California’s large immigrant population, citizenship is also an important factor for voting here. A substantial portion of the Latino and Asian-American populations are not citizens, and many are undocumented and so ineligible to ever become citizens. Historically that has meant significantly lower participation rates among these communities.

Yet the role of citizenship in California’s turnout is changing rapidly. Most of the growth in both the Latino and Asian-American communities now comes from children who are citizens because they are born in the United States. That means a growing share of these communities is eligible to vote, which in turn diversifies the state’s voting-eligible population.

These changes are happening faster here than in other states. Figure 1 shows the share of California’s Latino and Asian-American populations that are eligible to vote, compared with the same eligibility rates in other states. In the early 1990s, California Latinos were less likely to be eligible than were Latinos in other states. Since then, California Latino eligibility has steadily increased and now slightly exceeds Latino eligibility rates elsewhere. Roughly the same is true for Asian-Americans.

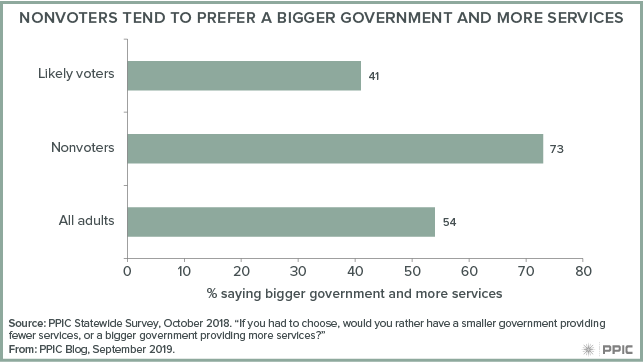
In addition to these demographic factors, PPIC research by Mark Baldassare has shown that voters differ from nonvoters in their opinions on policy issues (Baldassare 2016). Likely voters are about evenly split in their approval of a larger, more activist government that spends more money. Nonvoters, by contrast, are clearly in favor of government involvement across a number of issues. For example, 7 in 10 nonvoters want more government action on income inequality; just half of likely voters feel the same.

Question #2: What does California’s turnout look like over time and compared to the rest of the country?
California’s turnout has dropped about 20 points in the last 30 years. To understand the causes and implications of this trend, it is important to break the problem into two separate parts: 1) registration among those who are eligible; and 2) turnout among those who are registered.

Figure 2 shows that California has a registration problem compared with other states. The state’s flat registration rate—always holding steady between about 70 and 80 percent of total eligible residents—masks a relative decline that started in the late 1990s. California registered at higher rates than the rest of the country in the 1990s, but by 2016 had fallen about five percentage points behind.

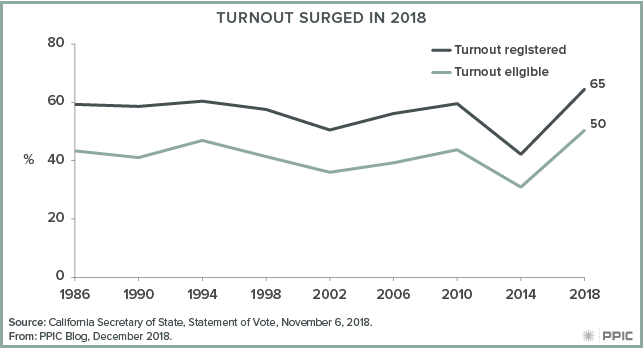
In addition to the relative registration problem, turnout in California’s midterm elections—when the state votes for governor and other statewide offices—has been falling, while turnout in presidential elections has largely remained flat (Figure 3). This has created a widening divide between the two types of elections. In contrast to registration, this problem is not unique to California. Other states have experienced similar midterm turnout declines. But that does not excuse the problem so much as tell us that it is part of a larger national pattern.

A deeper analysis of these trends suggests different explanations for each one. The first trend—the decline in the relative registration rate—can mostly be explained by the growing Latino and Asian-American populations. No other combination of demographic characteristics, nor the state’s declining competition in statewide elections, comes close to explaining as much as this single change. Latinos and Asian Americans register at the same rates in California and other states. But in any given election, they register at lower rates than non-Hispanic whites or African Americans. Thus, as they become a larger share of the eligible voter population, their lower registration patterns pull down the overall registration rate more in California than in states that are not diversifying as quickly.

In contrast to the registration trend, the decline in midterm turnout is largely a function of the changing behavior of young people. Young people continue to vote in presidential elections, but they are increasingly likely to skip midterms. California’s expanding Latino and Asian-American populations play almost no role here: once registered, these groups have been voting at consistent rates over time. And unlike registration, it is the changing turnout rate of young people that has had the largest effect, not any change in their share of the registered population.

Question #3: What should we expect from recent reforms, and what else should be tried to improve turnout?
California has recently passed a wide range of reforms meant to increase voter turnout. Most of these are meant to ease the registration process, while at least one is meant to make it easier to vote.

The registration changes consist of four main reforms. First, California has allowed 16- and 17-year-olds to “pre-register” with a placeholder record that will only become official when they turn 18. Second, California has established an entirely electronic online registration system that makes it easy to find out how to register and to fill out an application, saving even the trouble of finding a stamp. Third, the state has adopted a “conditional” registration system that permits voters to register and vote in a single trip to the county registrar after the normal registration deadline has passed. And finally, the state has committed to an automated registration system that has the potential to register voters by default when they visit the Department of Motor Vehicles.

The evidence for the efficacy of these reforms varies. Pre-registration is meant to facilitate registration, but research suggests it also helps increase turnout among those who pre-register because it engages them at an impressionable time in their lives (and often in a group setting in their high school or community) (Holbein and Hillygus 2015). Online registration offers significant administrative benefits, but it has not necessarily increased registration or turnout by much (McGhee 2014). For its part, conditional registration is likely to pick up some number of people who miss the registration deadline but decide to vote at the last minute as they get swept up in the excitement of the election. But evidence of its effect on turnout is mixed: some studies have shown a substantial effect, while others have shown something smaller (McGhee 2014).

The final registration reform, automated voter registration, carries perhaps the largest potential to increase registration rates. If implemented properly, the law could increase registration rates by as much as 14 percent in the first year (McGhee and Romero 2016). This may go a long way toward undoing the underrepresentation of Latinos and Asian Americans in the registration rolls. It may also help alleviate some of the need for conditional registration, as more people will be registered throughout the year and do not need to sign up at the eleventh hour. But as I will discuss below, these new registrants need to be mobilized to vote or they may stay home anyway.

In addition to these registration reforms, California is moving toward broad vote-by-mail implementation by enacting a reform first adopted by Colorado in 2012. All voters will get vote-by-mail ballots by default. They can either mail in those ballots or drop them off at any of several drop boxes or “vote centers” that replace neighborhood precincts. If voters lose their vote-by-mail ballot they can have a new one printed at a vote center, and the vote centers will be open for early voting several weeks before Election Day. In short, the new law gives all voters the chance to vote by mail if they want to.

Studies of the effect of this system suggest it saves a great deal of money by limiting the staff and equipment required to operate lightly trafficked polling places (Gronke and Miller 2012; Hall et al. 2012; Folz 2014). The reform may also increase turnout somewhat, though the findings there are mixed (Stein and Vonnahme 2008; Hall et al. 2012; Folz 2014). That said, there is some suggestive evidence that vote-by-mail registrants are more likely to be repeat voters, returning to vote in future elections after showing up in the first one. This pattern is especially notable for young people, meaning it might help alleviate the midterm turnout decline discussed earlier.

Taken together, these reforms place California at the national vanguard for voting access. But we should be wary of complacency. There remain significant issues of implementation and follow-through if these reforms are to increase turnout to the maximum extent.

For example, the ultimate impact of California’s automated voter registration system is dependent on the number of DMV customers who agree to be registered. The new system will certainly be an improvement because it will register any eligible customer who does not actively decline. But it will also require customers to affirm their eligibility to vote before they can be defaulted into registration. While a sensible failsafe measure, this extra step also risks reverting the process back to something like the current system, where DMV customers who skip the section on registration remain unregistered. True default registration would require everyone to answer the eligibility question. In the absence of such a requirement, the success of the new system will hinge in part on how aggressively the eligibility question is pressed upon potential registrants (McGhee and Romero 2016).

There are also a number of implementation challenges for the new Colorado model of voting. One complicated issue concerns how many vote centers to make available for a given population. Since the goal is generally to open fewer vote centers than precincts, it is possible that too few will be opened and voters will have trouble finding a convenient one. Research on the effect of distance on voting has found turnout declines up to 5 percent for distances up to 10 miles from the precinct (Dyck and Gimpel 2005). But since vote centers are more flexible than precincts—they will accept all potential voters no matter where in the county they reside and will be open for weeks rather than just one day—voters may more often find themselves in close proximity to a voting location at a moment when they have some free time to cast a vote.

There are important reasons to be careful about a wholesale switch to the Colorado model of voting. Young people currently choose vote-by-mail less often than older voters because of confusion about what address to use and other issues. If they do choose to vote by mail, they are less likely to send in their ballots on time (Romero 2014). And many people of color are wary of the vote center model because they do not trust the reasons behind it (Romero 2016a, 2016b). That raises the potential for problems with some of the very communities the reform is trying to reach.

Caution is therefore in order. Fortunately, the law is structured to provide it. Under California’s version of the Colorado voting model, each county decides whether to switch to the new system, and even the counties allowed to make the change will be phased in over time. This offers numerous opportunities to assess the rollout and make any necessary adjustments. Given both the promise and potential risks of the Colorado model, it is important to manage the phase-in to ensure the reform is going as expected.

Even if the reforms work as intended, they must still be coupled with aggressive mobilization. While it always makes sense to mobilize as many people as possible in every election, Latinos, Asian Americans, and young people clearly need special attention. Simply placing eligible residents on the voter rolls, or making voting easier, will not solve the whole problem. Outreach will be an important ongoing part of any solution. Research suggests such outreach will be more successful if it is embedded in the communities it is trying to mobilize, with communication by members of the community in ways others in the community understand and relate to (García Bedolla and Michelson 2012). This is especially important because Latino and Asian-American immigrants and their children are least likely to register and may be more culturally and linguistically distinct.

In any case, such mobilization work is hard and must be sustained over many election cycles. Yet it is the effort in many ways best suited to the source of the problem. Many of the biggest legal obstacles to voting in California are now gone or are in the process of being removed. This offers a fresh opportunity to get Californians to engage with the process and make their voices heard.

REFERENCES
Baldassare, Mark. 2016. “California’s Exclusive Electorate: Who Votes and Why It Matters.” San Francisco: Public Policy Institute of California.
Dyck, Joshua J., and James G. Gimpel. 2005. “Distance, Turnout, and the Convenience of Voting.” Social Science Quarterly 86 (3):531-48.
Folz, David H. 2014. “Vote Centers as a Strategy to Control Election Administration Costs.” SAGE Open 4 (1):1-10.
García Bedolla, Lisa, and Melissa R. Michelson. 2012. Mobilizing Inclusion: Transforming the Electorate through Get-Out-the-Vote Campaigns. New Haven: Yale University Press.
Gronke, Paul, and Peter Miller. 2012. “Voting by Mail and Turnout in Oregon: Revisiting Southwell and Burchett.” American Politics Research 40 (6):976-97.
Hall, Steven R., Joseph Losco, and Raymond Scheele. 2012. “Convenient Turnout: A Case Study of the Indiana Vote Center Pilot Program.” International Journal of Business and Social Science 3 (8):304-12.
Holbein, John B., and D. Sunshine Hillygus. 2015. “Making Young Voters: The Impact of Preregistration on Youth Turnout.” American Journal of Political Science 60 (2):364-82.
McGhee, Eric. 2014. “Expanding California’s Electorate: Will Recent Reforms Increase Voter Turnout? Technical Appendix.” San Francisco: Public Policy Institute of California.
McGhee, Eric, and Mindy Romero. 2016. “What to Expect from California’s New Motor Voter Law.” San Francisco: Public Policy Institute of California. Romero, Mindy. 2014. “Disparities in California’s Uncounted Vote-by-Mail Ballots: Youth, Language Preference, and Military Status.” UC Davis: The California Civic Engagement Project.
———. 2016a. “The California Voter Experience: Vote-by-Mail vs. the Polls.” Davis: UC Davis California Civic Engagement Project.
———. 2016b. “The California Voter Experience: Why African-American Voters Choose to Vote at the Polls or Vote-by-Mail, and How They Perceive Proposed Changes to California’s Voting System.” Davis: UC Davis California Civic Engagement Project.
Stein, Robert M., and Greg Vonnahme. 2008. “Engaging the Unengaged Voter: Vote Centers and Voter Turnout.” The Journal of Politics 70 (02):487-97.

The Turnout Turnaround

Voter turnout in California was dismal in 2014—record lows in the primary and general elections prompted serious concern about how to turn the problem around. The state has been aggressive in adopting reforms to promote turnout—including a system for registering online, “conditional” registration, which allows people to vote after registering as late as election day, and a system to register voters mostly by default via the DMV.

The Secretary of State recently certified the vote count for the November election, and the results suggest the state is heading in the right direction. Turnout was 58.7% among those eligible to vote, easily higher than the 30.9% showing in the midterm election two years ago, but also higher than the presidential election four years ago (55.5%) and almost as high as the notably high-turnout election in 2008 (59.2%).

In fact, while low turnout in the 2014 general election put California farther behind other states, this year’s turnout almost brought the state up to the national average. As the graph shows, turnout in presidential elections has been climbing in all states since about 2000. But this is the first time that the upward trend has been stronger in California than elsewhere.

Some of this upward surge may reflect higher registration rates: the share of eligible residents who are registered rose this election year to a 20-year high. The state’s recent reforms can’t explain this increase because most of them have not been implemented yet. The exception is online registration, which went live during the 2012 presidential election cycle and has proved popular. Early evidence suggested that the new system’s overall impact on registration was small, but this could have changed over time. In any case, the higher registration rate this year might lead to higher levels of participation in the future.

There are reasons to think that the higher turnout and registration were driven by a more mobilized Latino population. Certainly, Latino registration increased this year, perhaps in response to the tone and content of the presidential campaign. And Californians voted at even higher rates for Hillary Clinton than they did for Barack Obama, something many have also attributed to increased Latino engagement. However, there is little support for this story in the county-level results. The size of each county’s eligible Latino population explains almost none of the variation in turnout this year. In fact, the higher turnout this year was evenly distributed across the state.

Despite the signs of increased engagement, it is too early to say the state has come out of its turnout slump. As the figure makes clear, turnout in presidential elections is not the state’s biggest problem. The challenge is and has been midterm turnout. A growing share of the voters who participate in presidential elections do not vote in the gubernatorial election two years later. The last two election cycles—which have seen exceptionally high presidential turnout and exceptionally low midterm turnout—have not departed from this pattern but exemplified it.

The state should be proud of the progress made this election, and there are grounds for optimism as the state rolls out its election reforms over the next few years. But the positive signs from this election cycle should not make policymakers complacent about the challenges that lie ahead.

California Is Different

Mark Baldassare, PPIC president and CEO and director of the PPIC Statewide Survey, spoke to the Sacramento Press Club today (November 16, 2016). Here are his prepared remarks before a post-election discussion with Mark DiCamillo, senior vice president of Field Research Corporation and director of the Field Poll.

With the stunning victory of Donald Trump in the presidential election, it is easy to overlook the significance of the California vote. The political experience here was starkly different from the US in ways that went beyond our normal “blue state” election performance. I’m going to focus on election and polling trends that caught my attention—including citizen engagement, presidential preference, the state ballot measures, the role of government, and voter turnout. My colleague Eric McGhee has an excellent analysis of the top-two legislative races in another PPIC blog post. I’ll close with a look toward next year and the 2018 California election in light of the changing political landscape in California and the US.

Citizen engagement. The California voter rolls grew by 2.15 million in 2016 to reach a historic high of 19.4 million before the November 8 election. According to the California Secretary of State, the voter registration surge was largely a Democratic Party phenomenon, resulting in a 19-point gap between the Democrats and Republicans (45% to 26%)—the largest since 1976. Clearly, online registration and social media brought in new voters. But Hillary Clinton, Bernie Sanders, and Donald Trump shaped those voters’ party choices. One of the Republican candidate’s main messages—on immigration—simply did not resonate here. The 2016 PPIC Statewide Surveys consistently found that most Californians viewed immigrants as a benefit, favored a path to citizenship for undocumented immigrants, and opposed building a wall on the US–Mexico border.

Presidential preference. Democrat Hillary Clinton is currently defeating Republican Donald Trump by a 29-point margin in California. Clinton’s margin is higher than President Barack Obama’s in 2008 (+24) and 2012 (+23), while Trump’s support (33%) is lower than every Republican presidential candidate since 1992. Clinton is running up big margins in Los Angeles and the San Francisco Bay Area, while Trump is running behind even in Republican-leaning Orange County and “purple” areas of the state such as Fresno, Riverside, San Bernardino, and San Diego Counties. This was occurring in California even as blue areas turned red in the nation’s swing states. The margin for the presidential race in the October PPIC survey was 26 points, indicating that polls were accurate in accounting for Trump and Clinton supporters here.

State ballot measures. California also distinguished itself from the rest of the nation by asking voters to be the deciders on 17 state propositions. The September PPIC survey found satisfaction with the initiative process but unhappiness with the scale and complexity of state measures, and the oversized role of special interests in the process. Would voters just say no to all measures or skip this portion of the ballot? They did neither. They are currently approving 12 of the 17 state propositions and, in saying yes to at least 9 of the 14 citizens’ initiatives, exceeding the historical pass rate. Apparently, and in line with PPIC reports, California voters are up to the challenge of making policy at the ballot box.

Role of government. The big surprise in the 2016 California election is a sea change in voter preferences for the role of government. Californians reversed course in terms of their own previous decisions and stood apart from a number of national trends.

  • Californians passed both a cigarette tax increase (64%, Proposition 56) and marijuana legalization (56%, Proposition 64), both of which failed at the ballot earlier.
  • Years after they instituted a tough-on-crime three strikes law and mandated that schools teach only in English, the state’s voters passed criminal sentencing reform (64%, Proposition 57) and bilingual education (73%, Proposition 58).
  • While second-amendment rights were a litmus test for presidential candidates in other states, Californians expanded firearms restrictions (63%, Proposition 63).
  • Voters may be known for their distrust in state government, but they endorsed the plastic bag ban that was passed earlier by the legislature, at the same time reinforcing their “green” credentials (53%, Proposition 67).
  • Californians showed a generous streak by passing state school bonds (54%, Proposition 51), Medi-Cal funding (70%, Proposition 52), and a tax extension (62%, Proposition 55).

Notably, voter support for tax and spending propositions that we tracked in the September and October surveys were both stable and close to the election results, indicating that opinions were unmoved by the “no” campaigns. “Calexit” has become shorthand for the idea of California leaving the US. Instead, it may end up referring to Californians leaving behind the tax revolt that started here.

Voter turnout. The California Secretary of State is reporting a record-setting 15.18 million counted and unprocessed ballots in the November election. This vote count also reflects gains in the turnout among registered voters and eligible adults compared to the 2012 presidential election. Turnout rates were somewhat higher in the 2008 election. The October PPIC survey showed a high level of interest in the presidential election, and California seems to have bucked the national trend of depressed turnout. Still, only about half of the approximately 30 million California adults voted in this election. As noted in a recent PPIC report, nonvoters are mostly Latino, immigrants, lower-income, and young adults. In other words, those who don’t vote are among the most affected by changes in the role of government.

The voters have spoken and the awkward result is a conflicting policy agenda for the state government and the federal government. How will Governor Brown and the state legislature respond when the Republican president and US Congress shift gears on immigration, the Affordable Care Act, climate change, and abortion rights policies favored by California residents?

As the priorities, plans, and programs of the new president and Congress take shape, the mission of the PPIC Statewide Survey—­­to provide a voice for both adults and likely voters—takes on even greater importance.

And as we look further ahead, the next California governor will play a challenging role in managing the federal and state relationship. PPIC will invite the 2018 gubernatorial candidates to public forums next year to learn what we can about their leadership style and their vision for the state’s future in the changing political landscape in California and the US.

Primary Takeaways

With the release of the official Statement of the Vote on Friday, the 2016 California primary is now in the history books. The final tally by the Secretary of State offers many new insights for those of us who closely follow elections and polling in California. This year’s results deserve a particularly close look because of the extraordinary presidential primaries and the first-ever top-two primary for an open US Senate seat.

My colleague Eric McGhee has provided an excellent analysis of primary turnout and the outcomes of top-two legislative district races in two earlier PPIC blog posts. I’m going to focus on some trends that caught my attention in the final numbers regarding the presidential primaries, the top-two US Senate primary, the state ballot measure, voter engagement, and turnout in key regions. 

  • Presidential primaries. Secretary Hillary Clinton (2.75 million) and US Senator Bernie Sanders (2.38 million) were the top-two vote-getters in the state’s presidential primaries. These two Democrats had much more support in their party’s open primary than businessman Donald Trump (1.67 million) had in a closed Republican primary with no active opposition. In addition to facing a sizeable disadvantage in voter registration (45% Democrat, 27% Republican), the presumptive Republican nominee starts the fall election season with one million fewer voters in the state’s primary than the presumptive Democratic nominee. For Republicans, this raises questions about their presidential selection process and whether to have an open primary in the future that invites independent voters to participate. For Democrats, the immediate issue is how many of those devoted, young Sanders supporters will show up to vote this fall.
  • US Senate top-two primary. Attorney General Kamala Harris won more votes (3.00 million) in the primary for the open US Senate seat than Clinton did at the top of the ballot. US Representative Loretta Sanchez finished a distant second (1.42 million) to Harris, setting up the first single-party race for US Senate in the top-two era. As a group, the 12 Republican candidates received more votes (2.15 million) than the second-place Democratic finisher. For Republicans, this raises questions about future strategies to ensure that their party’s voters have a candidate who can qualify for a top-two spot in November. And the question of how many Republicans will opt out of voting for a US Senator this fall will ultimately affect both parties.
  • State ballot measure. Proposition 50 was the biggest vote-getter (5.60 million votes, 76% yes) on the June ballot. A byproduct of recent political scandals, it allows the legislature, with a two-thirds vote, to suspend members without salary and benefits. The legislature placed it on the June ballot with bipartisan support. Proposition 50 received scant media mention and little organized opposition. Its success is consistent with the historically high pass rate for legislative ballot measures found in a recent PPIC report. This trend bodes well for state bonds to fund parks and housing that the legislature may place on the ballot in the fall. Citizens’ initiatives and referenda have been moved to the November general election, and these types of state propositions have a much lower pass rate. That means voters face a cluttered ballot this fall that includes 14 citizens’ initiatives, two legislative initiatives, and one referendum, in addition to local measures. How many will voters decide are worthy of their interest and support? 

In Los Angeles and two of the state’s fastest-growing areas, turnout among registered voters was lower than the state average.

  • Voter engagement. There was a surge in online voter registration as Californians waited for their say in the presidential primaries. Voter engagement was a welcome development after primary turnout reached a new low in June 2014 (4.46 million, 25% registered voters, 18% eligible adults). Turnout this June (8.55 million, 47.7% registered voters, 34.5% eligible adults) reflected a turnaround, although it was well short of the record-setting February 2008 presidential primary (9.07 million, 58% registered voters, 40% eligible adults). Turnout was probably depressed by two events: the elimination of Trump’s competition weeks earlier and the declaration on the day before the primary that Clinton was the presumptive Democratic nominee. Once again, there will be questions about whether it’s in California’s best interests to vote at the end of the primary season in the presidential sweepstakes.
  • Turnout in key regions. Five major counties had lower registered voter turnout than the state average: Los Angeles (41%), Fresno (41%), Kern (41%), Riverside (44%), and San Bernardino (43%). Five less populous counties in the Central Valley also had below-average turnout (41% Kings, 42% Merced, 42% San Joaquin, 44% Stanislaus, 45% Tulare). Moreover, fewer than one in three eligible adults voted in the primary in all 10 of these counties. In sum, these are troubling trends in the state’s most populous county (Los Angeles) and its two fastest-growing areas (the Central Valley and Inland Empire). Are there practical impediments to voting in these regions or is this a symptom of a deeper civic malaise? Until they are fully addressed, these regional disconnects will seriously limit the size and diversity of the state’s electorate.

The 2016 primary results point to several trends to watch in the November general election and beyond. Furthermore, the issues that surfaced this June will likely have longer-term reverberations on the primary process and civic engagement going forward.

At PPIC, the race for US Senate stands out as uniquely worthy of public attention. We invited the two candidates to participate in a conversation with me about the future of California on September 16. Stay tuned for more information about whether the candidates accept our invitation and how you can attend or watch this PPIC event.

Video: Rolling Out the New Motor Voter Law

California’s New Motor Voter Act has the potential to change the composition of the electorate, making it younger, less educated, more mobile, and poorer—in other words, more representative of the state’s population as a whole.

These are among the key findings of a new PPIC report by research fellow Eric McGhee and Mindy Romero, founder and director of the California Civic Engagement Project at the UC Davis Center for Regional Change. McGhee presented the report, What to Expect from California’s New Motor Voter Law, in Sacramento last week. Passed to address the state’s lagging voter participation rates, the new law simplifies the registration process.

When it takes effect next year, all Department of Motor Vehicles (DMV) customers who attest to being eligible to vote and do not opt out—that is, do not actively decline to register—will be added to the voter rolls. Because of the sheer volume of DMV customers, the law has the potential to increase registration very quickly—by more than 2 million people in the first year, McGhee said.

Its success depends on how many DMV customers agree to be registered, and that hinges on the way the system is designed, he said. The report recommends that customers be required to say whether they are eligible to vote before they are allowed to complete their DMV transactions—rather than having the option of not answering the eligibility question at all.

“For the maximum impact, the solution is pretty straightforward: make the eligibility question required,” McGhee said.

He cautioned that even if implementation is highly successful, the New Motor Voter Act alone will not solve the state’s problem of low voter turnout. To significantly boost turnout—and ensure that voters are more representative of the state’s population—targeted and ongoing efforts to reach out to newly registered voters will be needed.

Learn more

Read What to Expect from California’s New Motor Voter Law

A Turnaround for Voter Turnout?

The recent primary offered signs of improvement for California’s abysmally low voter turnout. Recent elections have seen some of the worst turnout in the state’s history. The 2014 election cycle was particularly dismal, but 2012 also set a new low for a presidential primary election. Moreover, California has been lagging behind other states in both registration and turnout.

However, there has been a large surge in new registrants over the last few months, and the California Secretary of State currently estimates that almost 9 million Californians participated in the 2016 presidential primary election, compared to only 4.5 million in 2014 and 5.3 million in 2012.

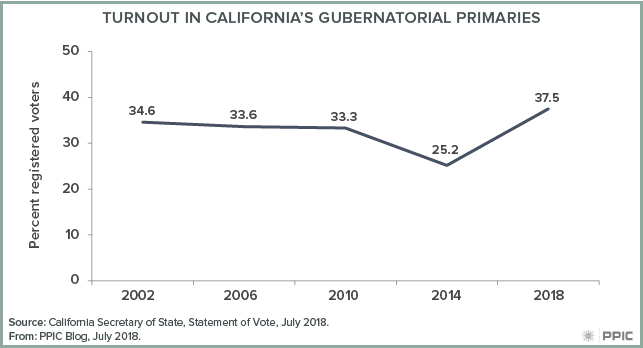
If we look at the share of voting-eligible residents who have registered in time for each of the last 18 primary elections, California’s registration rate has always fallen within a fairly narrow band—from a low of 66% in 1988 to a high of 75% in 1996. In this context, the 2016 registration rate might be seen as a disappointment. Compared to the same point in the 2012 primary election cycle, the registration rate has remained largely unchanged, though it is still comparatively high when viewed in the context of the past several decades.

How can we square this result with the reported surge in new registrants? The registration rate typically drops some between elections as county registrars purge voters who have moved or died from the registration rolls, and relatively few new voters sign up to take their place. This decline was especially large between fall 2014 and the beginning of the primary season this year. Given that baseline, a flat registration rate is consistent with a surge of new registrants, and must be considered something of a success.

More to the point, these registrants turned out to vote at a higher rate than we have seen in any primary since 2008. The estimated 8.9 million ballots translates to a turnout rate of about 50% among registered voters. That sits comfortably in the broad average of California’s presidential primary turnout, and marks a considerable improvement over 2012.

In fact, California’s presidential primary turnout now shows no clear sign of decline since 1984; it may even be holding its own relative to other states. But midterm turnout is a different story. There is a much longer downward trend for such elections, both viewed on their own and relative to trends in other states.

On balance, there are signs of recovery from the low turnout levels of 2012 and 2014, despite concerns that California’s late presidential primary would discourage participation. Whether this improvement will be sustained into the fall—and whether things will turn around for midterm elections in 2018—of course remains to be seen.