Video: Higher Education as a Driver of Economic Mobility

Higher education plays a key role in helping Californians move up the income ladder—but equity gaps are a big challenge. Among young adults born in California, 60% of Asian Americans and 40% of whites have at least a bachelor’s degree, compared to 21% of African Americans and 18% of Latinos. At a Sacramento briefing yesterday, PPIC researcher Sarah Bohn outlined these and other key findings of a new report.

Bohn noted that “higher education is correlated with a host of benefits in today’s society.” Workers with at least a bachelor’s degree earn 73% more than high school graduates. While earnings levels are affected by many factors—including the subject area of a college major, geographic location, and the field of employment—Bohn stressed that “the higher the level of education you have, the greater the economic return that you experience.”

California has historically enjoyed strong economic and education gains. However, while the economy is currently booming, recent trends in educational attainment are not as encouraging. Young adults in California today are only slightly more likely to have graduated from college than older adults. Moreover, graduation rates are lower for low-income residents and underrepresented race/ethnic groups.

These equity gaps are especially troubling because low-income, Latino, and African American students—as well as students who would be the first generation in their families to attend college—make up the vast majority of California’s high school population. The community colleges, UC, and CSU have undertaken serious efforts to narrow these gaps—but, as Bohn noted, all educational sectors, including K–12 schools and private institutions, play an important role.

California’s higher education systems have been implementing policies and programs that are likely to increase college graduation rates among the state’s diverse population. Bohn concluded by highlighting the progress that has been made and outlining additional actions that can help more Californians—particularly underrepresented students—benefit from higher education.

Video: New Insights into California Arrests

Crime, policing, and community relations are subject to heated debate, but little is known about the first step in the criminal justice process: arrests. Who is arrested in California and what are they arrested for? How have arrest patterns changed over time and how do they differ across the state? Last week in Sacramento, PPIC researcher Magnus Lofstrom outlined findings from a new report and Brandon Martin—a PPIC research associate—moderated a panel discussion that put these trends in the context of state legislation and local police-community relations.

The PPIC report finds that overall arrest rates have dropped dramatically over the past few decades, largely due to declines in misdemeanor arrests. While there have been significant declines in arrests among juveniles and young adults, men, and African Americans, arrestees still tend to be younger, male, and nonwhite. After presenting these and other key findings, Lofstrom stressed that “this report raises more questions than it answers.” Future research, he said, will explore the factors that contribute to trends and differences in arrest rates across demographic groups and jurisdictions across the state. It will also look at the impact of recent criminal justice reforms.

The panelists focused on the importance of addressing the larger issue of long-term trust between law enforcement and the communities it serves. Gabriel Caswell, counsel to the California Senate Public Safety Committee, said that recent reforms such as the Racial and Identity Profiling Act have tried to strike a balance between officer safety and community transparency: “If the community has at least somewhat more access than they’ve been given historically, I think that will go a long way toward rebuilding trust.”

Marisa Arrona, local safety solutions project director for Californians for Safety and Justice, highlighted efforts to shift from reactive policing to the Blueprint for Shared Safety: “Shared safety is more than the absence of crime; it’s got to be the presence of well-being.” Instead of assessing safety only through crime rates, communities can also use other measures, such as harm reduction among vulnerable populations, access to victim services, or the number of former offenders who have access to jobs.

Daniel Hahn, Sacramento police chief, also cautioned against relying exclusively on crime numbers: “You’ve got to be very careful of what’s behind the numbers and make sure it’s actually meaningful to the community.” He stressed the need to look beyond simple solutions. In order to build trust between police and the communities, he added, “We gotta change the way we hire, change the way we train, include the community in the police department and the police department in the community.”

2020 Census: Counting California’s Northern and Sierra Regions

The decennial census plays an essential role in American democracy. Our series of blog posts examines what’s at stake for California and the challenges facing the 2020 Census, including communities that are at risk of being undercounted.  

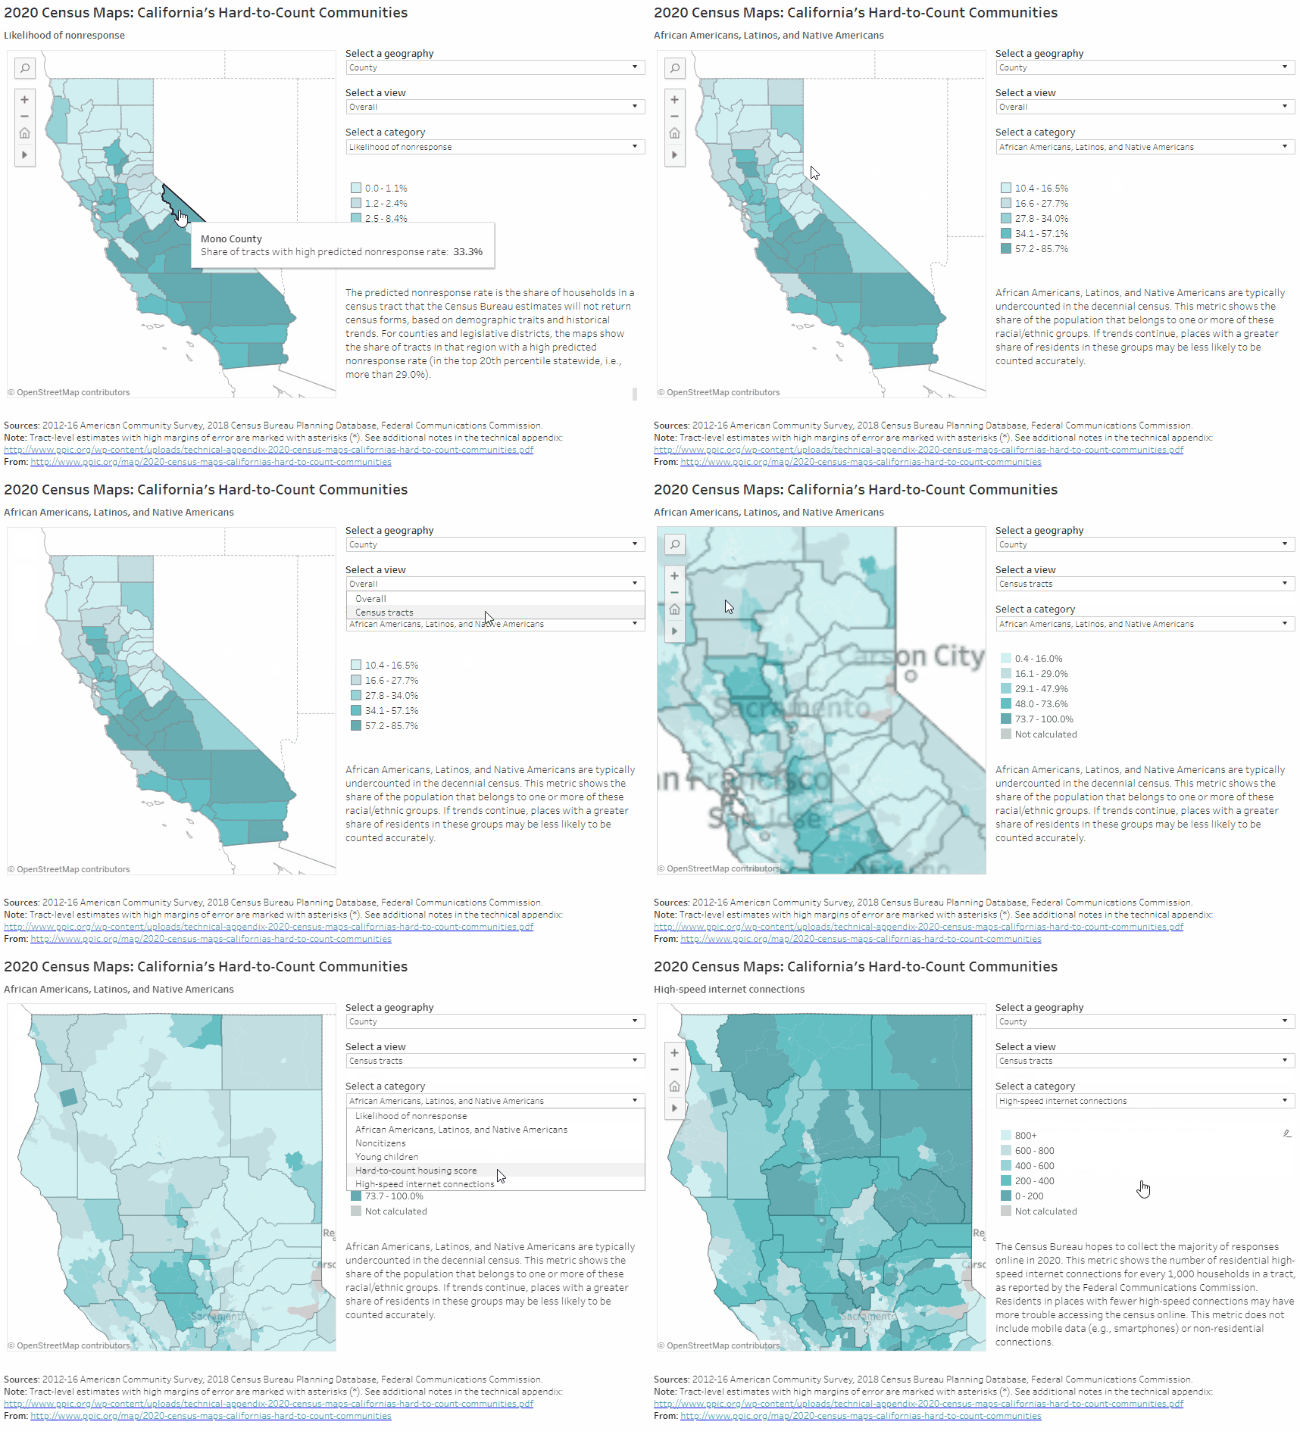
PPIC’s interactive census maps are an important tool for Californians working to ensure an accurate census count. Using estimates from the Census Bureau and the Federal Communications Commission, they highlight hard-to-count communities across the state and pinpoint reasons why certain areas may be hard to reach.

Home to 1.4 million people, California’s northern and Sierra regions cover around 40% of the state, spanning 23 counties: Alpine, Amador, Butte, Calaveras, Colusa, Del Norte, Glenn, Humboldt, Inyo, Kings, Lake, Lassen, Mariposa, Mendocino, Modoc, Mono, Plumas, Shasta, Sierra, Siskiyou, Tehama, Trinity, and Tuolumne. The hardest-to-count areas in these regions are found in Arcata, Chico, and Mammoth Lakes in Humboldt, Butte, and Mono Counties, respectively. Households in these very hard-to-count areas are the least likely to respond initially to census forms, according to Census Bureau estimates that draw on local demographic characteristics (e.g., race/ethnicity, age, citizenship, and housing conditions) and historical trends.

Some highlights:

  • Follow-up from census workers will likely be needed across the north and Sierras. In most census tracts in California’s northernmost and rural Sierra counties, estimates suggest 19% to 29% of households would need in-person follow-up from census workers to be counted. Further, these estimates from the Census Bureau predate the Camp, Carr, and Mendocino Complex fires, which have likely made it more difficult to count residents.
  • Housing conditions could be an obstacle to counting residents in coastal areas as well as around the northern Sacramento Valley. In these areas, large shares of housing units are rentals, overcrowded rentals, and/or mobile homes—all of which can make residents harder to count accurately. For example, more than 20% of households live in mobile homes in much of Trinity and Tehama Counties, and one out of five rentals in northeastern Siskiyou County is overcrowd Recent wildfires have likely increased the share of households in hard-to-count housing, as displaced families seek shelter elsewhere.
  • Low internet access may pose a challenge throughout the regions. The Census Bureau plans to collect the majority of responses online in 2020—a change from previous practice. Northeastern and central Sierra counties have some of the lowest rates of internet access in the state: in Plumas County, for instance, fewer than 200 out of every 1,000 households have high-speed internet access, on average. In places with limited residential internet access, participation may rely more heavily on paper forms, in-person census takers, or internet provided by local institutions.
  • Undercounting Native Americans would disproportionately affect northern and Sierra counties. African Americans, Latinos, and Native Americans have historically been undercounted in the census. There are tribal lands throughout these regions, which have a higher share of Native American residents than other parts of the state. Working with tribal governments to reach Native Americans will be an important part of accurately counting residents in the northern and Sierra regions.
  • Local knowledge is necessary for effective outreach. Colusa County has the regions’ highest share of residents from historically undercounted racial/ethnic groups (60%) and the highest share of noncitizens (15%). Noncitizens may be less likely to respond to the 2020 Census due to the planned addition of a citizenship question and concerns about deportation and privacy. Ensuring that these communities are counted in 2020 will require an understanding of the local landscape. For example, one area east of Susanville in Lassen County that includes two correctional facilities has a high share of people of color. However, incarcerated people, who are counted where they are held, are unlikely to be undercounted in the census.
  • Some northern counties have high shares of young children. Young children are historically underrepresented in the census. Along the I-5 corridor in the Sacramento Valley, and in parts of Lake, Mendocino, Humboldt, Del Norte, Siskiyou, and Lassen Counties, more than 8.5% of residents are children under five years old, compared to 6.5% statewide.

We hope these maps serve as a starting point to help local, regional, and state leaders think about which activities, resources, and partnerships—including language assistance, awareness raising, and community outreach—might be most effective for accurately counting different parts of California. Stay tuned for future posts that examine hard-to-count communities in other regions of the state.

Federal Immigration Proposal Could Have Widespread Impact

The Department of Homeland Security (DHS) has recently proposed changing how it decides whether a person is or will likely become dependent on government assistance. If implemented, this change would make it harder for immigrants to meet the government’s standard of self-sufficiency—and may deter them and others from using government services for which they are eligible. Through December 10, DHS is requesting public comments on the proposal, which could potentially have wide-ranging impacts on California and its large immigrant population.

The federal government can typically deny applications for green cards or entry into the United States to people who are or will likely become “public charges,” i.e., dependent on government assistance. Under current guidance, DHS considers an immigrant a public charge if they receive more than half of their income from cash assistance—which includes TANF (known as CalWORKs in California), General Assistance (GA), and Supplemental Security Income (SSI)—or are in government-funded, long-term institutional care (like a nursing home).

The proposed rule is much broader: it defines dependence as receiving more than about $1,800 (for 2018) in assistance from not only the current programs but also the food assistance program SNAP (CalFresh) and/or Section 8 housing vouchers and rental assistance. DHS also proposes that an income of less than 125% of the federal poverty level ($25,100 in 2018 for a family of four) would be a strong predictor of becoming a public charge and recommends length of enrollment in certain health programs as another factor to consider.

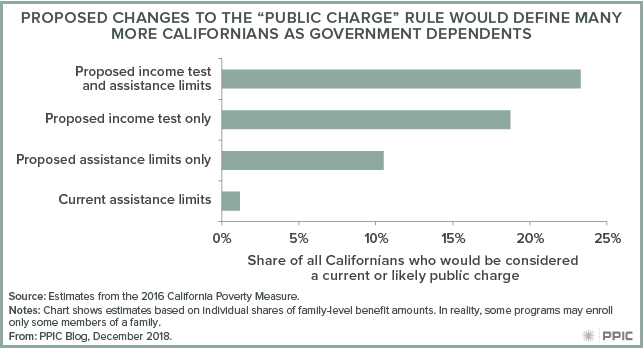
How big of a change is this? While data aren’t available to examine safety net participation among the noncitizens whose immigration cases would be affected by the rule, we estimate that even before including health programs, as many as 23% of all Californians would be considered public charges, or likely to become so—which gives a sense of how broad the proposed rule is. Some 18.7% of Californians would be considered likely to become public charges based on their income level alone. By contrast, at most 1.2% of all Californians receive more than half their income from CalWORKs, GA, and SSI, and would be considered public charges under the current rule. These calculations are based on the California Poverty Measure (CPM), a joint effort of PPIC and the Stanford Center on Poverty and Inequality.

California has more immigrants than any other state—and hence much at stake. For those on visas, the proposed rule would make it harder to qualify for a green card or extend their stay. But in practice, the largest impact would likely be on immigrants and their families who, purely out of caution, forego safety net benefits for which they are eligible. DHS cites this sort of disenrollment as a source of long-term savings—but notes that these savings are liable to be offset by worse public health outcomes and increased poverty rates. Based on studies of welfare reform in the 1990s, the UCLA Center for Health Policy Research estimates that if the rule change takes place, 15% to 35% of families with noncitizens might disenroll from safety net programs. At the high end, as many as 765,000 people could disenroll from CalFresh and Medi-Cal, leading to around $1 billion less in federal aid to California each year.

California’s attorney general and some local governments have already voiced their opposition to the proposed changes, which come at a time when the state has been expanding access to health and social safety net programs. Reduced participation in these programs, whether from reasonable or unnecessary caution, would directly counteract the state’s efforts to reduce poverty. Public comment for the proposal closes on December 10.

Toward Understanding Racial Disparities in Arrests

With tensions between law enforcement and minority communities continuing to make headlines, media outlets and academic researchers both report stark racial and ethnic differences in criminal justice experiences, including sentencing and incarceration. The disparity between African Americans and whites is especially striking. For example, the prison incarceration rate in California is 4,180 per 100,000 residents for African American men, compared with 420 for white men. It is likely that this inequality is significantly affected by the first step in the criminal justice process—arrests.

California’s various law enforcement agencies make a substantial number of arrests each year—1.35 million in 2016. While this is a staggering number, it’s also the lowest number of arrests since 1980 and marks a dramatic decline of more than one million arrests (64%) since a peak in 1990.

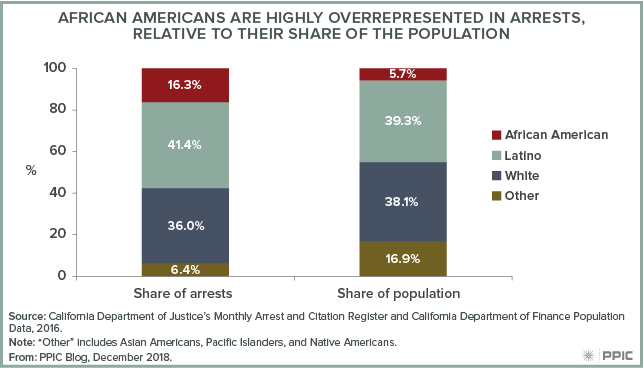
Looking at racial disparities, we find that African Americans are significantly overrepresented among those arrested in California. In 2016, African Americans made up less than 6% of the population but more than 16% of arrests. Latinos were slightly overrepresented in arrests as well, representing 39% of the population but 41% of arrests.

Though much of the penal code is determined by the state legislature, the state does not closely monitor how arrest decisions change over time or vary across jurisdictions, nor how these decisions may affect demographic groups differently. Two efforts—one implemented by the state legislature and one by PPIC—seek to fill this knowledge gap and will bring data-driven information into the broader discussion about policing and community relations.

In 2015, California’s legislature passed the Racial and Identity Profiling Act (AB 953). This legislation requires law enforcement agencies to begin collecting data in 2018 on all initial police interactions with the public, including reason, location, race/ethnicity, gender, and age. While this will provide an opportunity to learn more about law enforcement interactions, the data will not be available for statewide analysis until 2023 or later.

In the meantime, PPIC has launched a project to begin identifying areas in need of attention in California arrests and to frame the conversation for sustainable solutions at the state and local level. In our first report, we examine trends over time and provide a descriptive profile of arrestees, including patterns in race/ethnicity, gender, age, offense type, and the county where the arrest took place. Our interactive tool allows for deeper exploration of arrest rates across California counties.

Over the next two years, we will further examine whether arrestees were booked into jail or cited and released in the field. We will also seek to understand possible contributing factors to these arrest patterns—such as crime rates, law enforcement and correctional resources, economic conditions and expenditures, and demographics. This project uses unique data from the California Department of Justice’s Monthly Arrest and Citation Register (MACR).

As the state and local jurisdictions continue their data collection efforts on police interactions, PPIC’s research will provide a better understanding of long-term trends in arrests and differences throughout the state. Stay tuned for more insights on this critical but understudied aspect of California’s criminal justice system.

2020 Census: Counting the Sacramento Area

The decennial census plays an essential role in American democracy. Our series of blog posts examines what’s at stake for California and the challenges facing the 2020 Census, including communities that are at risk of being undercounted.  

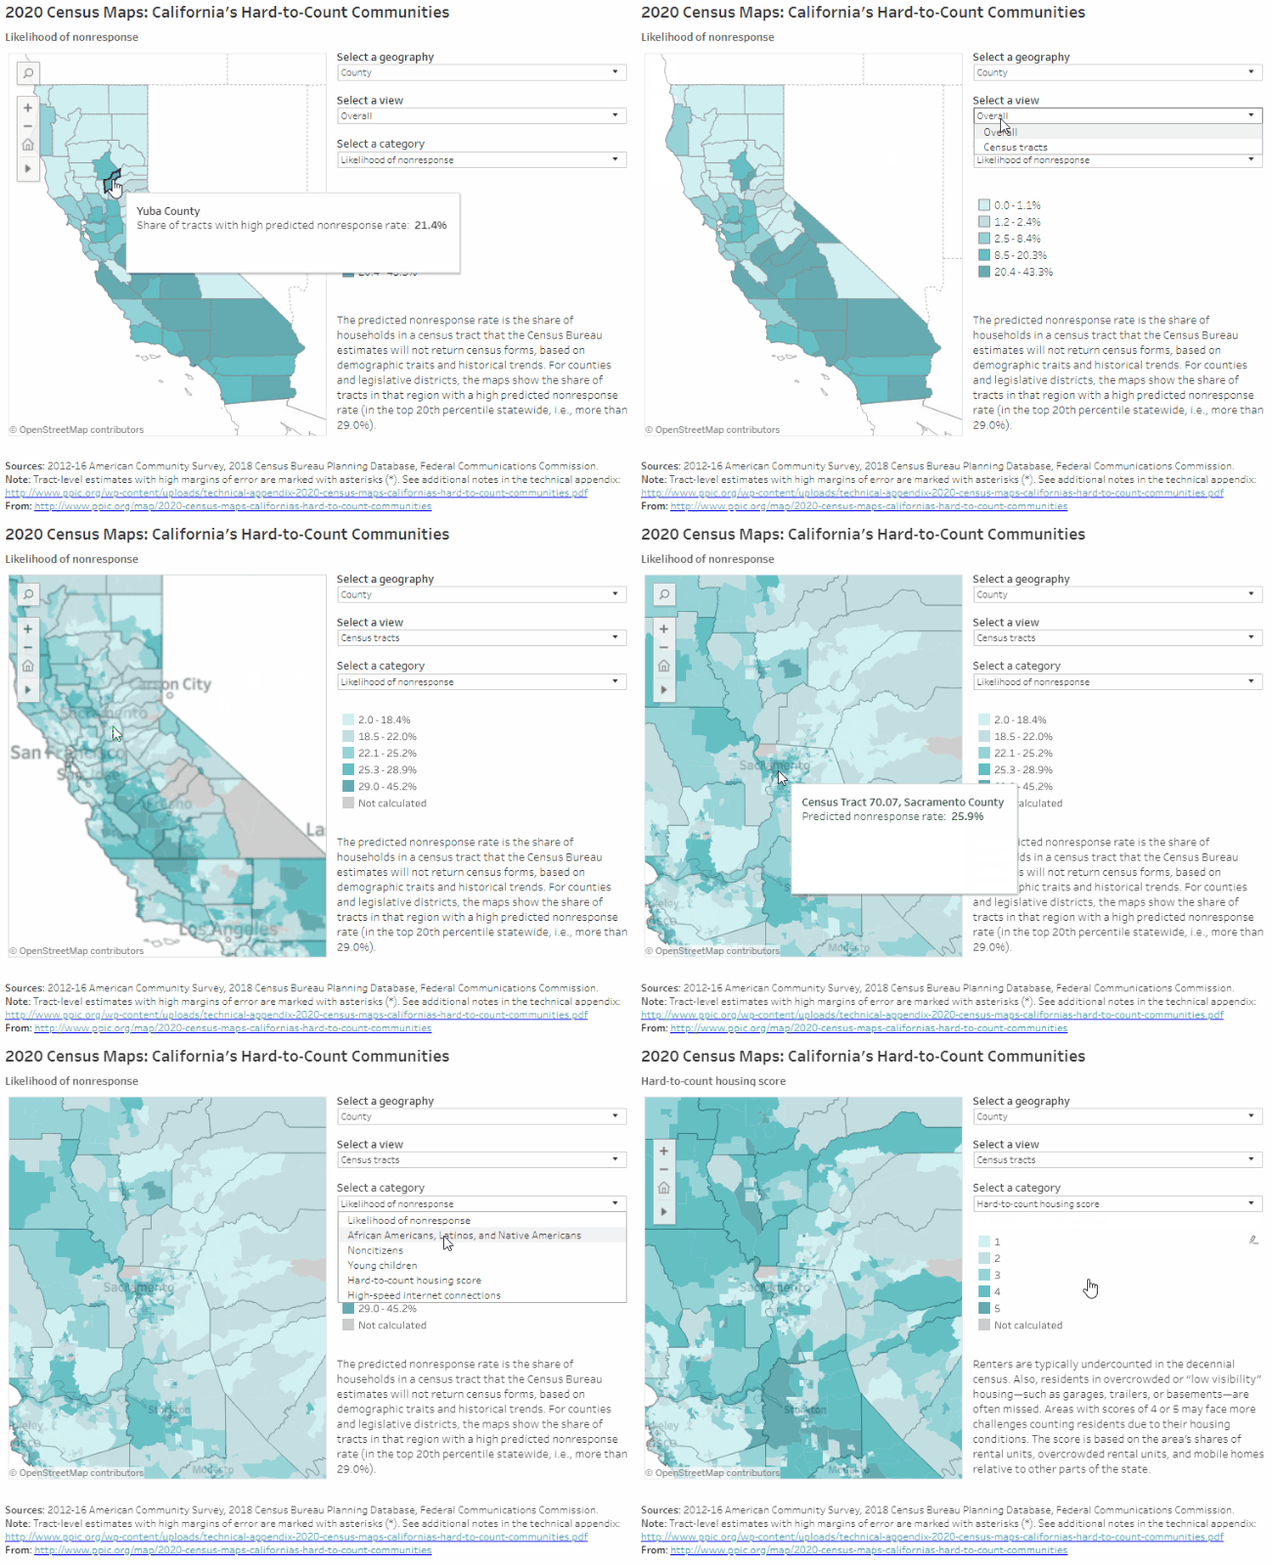
PPIC’s interactive census maps are an important tool for Californians working to ensure an accurate census count. Using estimates from the Census Bureau and the Federal Communications Commission, they highlight hard-to-count communities across the state and pinpoint reasons why certain areas may be hard to reach.

Home to about 2.5 million people, the Sacramento area includes the counties of El Dorado, Placer, Sutter, Yolo, and Yuba, in addition to Sacramento. Within this region, Yuba has the highest share of very hard-to-count areas (21%)—in the top fifth of hardest-to-count counties across the state—and Sacramento has the second highest (10%). Households in these very hard-to-count areas are less likely to respond initially to census forms and are therefore at risk of being undercounted, according to Census Bureau estimates that draw on local demographic characteristics (e.g., race/ethnicity, age, citizenship, and housing conditions) and historical trends.

Some highlights:

  • Legislative districts that include the fast-growing city of Sacramento will likely be the hardest to count. In Congressional District 6 (Matsui), Senate District 6 (Pan), and Assembly District 7 (McCarty), between 14% and 19% of neighborhoods are considered very hard to count. Other legislative districts in the region tend to cover more suburban or rural areas and have much smaller shares of very hard-to-count communities.
  • There are small pockets of hard-to-reach areas across the region. Within Sacramento County, hard-to-reach areas are concentrated in the city of Sacramento, as well as around Rancho Cordova and Folsom. In some neighborhoods, 30% or more of households are predicted to not respond initially to the census. Other relatively hard-to-reach areas include Yuba City and Marysville at the border of Sutter and Yuba Counties, Davis and Woodland in Yolo County, and the eastern border of Placer and El Dorado Counties, directly north and south of Lake Tahoe.
  • Local population trends can help guide effective outreach. African Americans, Latinos, and Native Americans have historically been undercounted in the census. Overall, these groups make up a lower share of the population in the Sacramento area compared to the rest of the state. However, in much of the city of Sacramento, around Woodland and northwest Yolo County, and in South Yuba City and northeastern Sutter County, more than half of residents are from historically undercounted communities—primarily African American and Latino. Some of these areas have relatively high shares of noncitizens as well. Noncitizens may be less likely to respond to the 2020 Census because of the planned addition of a citizenship question and concerns about deportation and privacy.
  • Parts of the Sacramento area have high shares of young children. Young children are historically underrepresented in the census. In census tracts in the eastern parts of Sutter County and southern Yuba County, in the city of Sacramento and surrounding suburbs, and the southwestern tip of Placer County, 9% or more of residents are children under five years old, compared to 6.5% statewide.
  • Housing conditions may make an accurate count challenging. High shares of rentals, overcrowded rental units, and mobile homes can make it more difficult to count residents accurately. Around Yuba City and Marysville, all of these factors are prevalent: in some neighborhoods, more than 65% of housing units are rented, about a quarter of those are overcrowded, and 15% of households live in mobile homes. In the city of Sacramento, housing conditions vary, with some neighborhoods seeing high rates of overcrowding but low rates of mobile homes, while others see the reverse. Reaching residents in nontraditional housing will be critical to an accurate count—and will depend on local knowledge of how families make ends meet.
  • Limited internet access may be an issue in rural areas throughout the region. The Census Bureau plans to collect the majority of responses online in 2020—a change from previous practice. Each county in the region has some census tracts with minimal residential high-speed connectivity, with the lowest access outside of the city of Sacramento, Lake Tahoe, Yuba City, and Marysville. Outside of these areas, it may be harder to collect responses online, and participation will rely more heavily on in-person census takers or internet provided by local institutions.

We hope these maps serve as a starting point to help local, regional, and state leaders think about which activities, resources, and partnerships—including language assistance, awareness raising, and community outreach—might be most effective for accurately counting different parts of California. Stay tuned for future posts that examine hard-to-count communities in other regions of the state.


Election Day Matters

It’s Election Day, and voters across the nation are choosing their leaders at a divided and contentious time. Although Californians are divided on many issues today, majorities of voters across party lines say they are more enthusiastic about voting than usual this year (October PPIC survey: 72% Democrats, 64% Republicans, 53% independents). This is welcome news after a 2014 statewide election that set a new record for the lowest voter turnout. It will be interesting to see how many Californians will actually follow through and cast their ballots for governor, state constitutional officers, and state legislators.

Who will vote in the California election will be closely watched on election night since a handful of House races may well determine the party in control of the next US Congress. Democrats seem more energized than Republicans in voting for Congress this year (October PPIC survey: extremely/very enthusiastic: 57% Democrats, 40% Republicans, 35% independents). However, we also find an “enthusiasm gap” that favors white, older, and more affluent Californians who tend to be conservative voters. This raises questions about whether there will be a “blue wave” or merely a ripple this year.

In addition to electing their leaders, California voters play an outsize role in policymaking in our state. In another striking area of agreement across party lines, most Californians say that they like the initiative process and feel they make good decisions at the ballot box—despite reservations about the number and complexity of ballot measures. Because of the central role the initiative process plays in California policymaking, voters have a special obligation to weigh in on important choices facing the state. This election, Californians will vote on 11 state propositions, in addition to numerous local measures.

Still, many Californians who are eligible do not vote. We’ve found significant gaps between voters and non-voters in the state. Voters are much more likely to be older, white, and own their homes. They have higher education and income levels. And they are more likely to identify as one of the “haves” than the “have nots.” This means that important policy choices that affect the entire population are determined by voters who do not necessarily reflect the state’s social, political, or economic diversity.

The state has implemented several reforms to ease access to registration and voting, many of them quite recently. The jury is still out on the long-term effects of these efforts, but one thing is sure: voting matters. Elections have the power to change the direction of history.

So on this Election Day, it is critical for all eligible Californians to exercise their right to vote. For anyone in need of last-minute help on ballot choices, solid nonpartisan information is available in the state’s voter guide.

PPIC is keeping a close eye not only on the immediate outcome of the vote, but also on long-term trends and implications. Stay tuned to the PPIC blog for post-election thoughts and analysis of this year’s important midterms.

2020 Census: Counting the Central Coast

The decennial census plays an essential role in American democracy. Our series of blog posts examines what’s at stake for California and the challenges facing the 2020 Census, including communities that are at risk of being undercounted.  

PPIC’s interactive census maps are an important tool for Californians working to ensure an accurate census count. Using estimates from the Census Bureau and the Federal Communications Commission, they highlight hard-to-count communities across the state and pinpoint reasons why certain areas may be hard to reach.

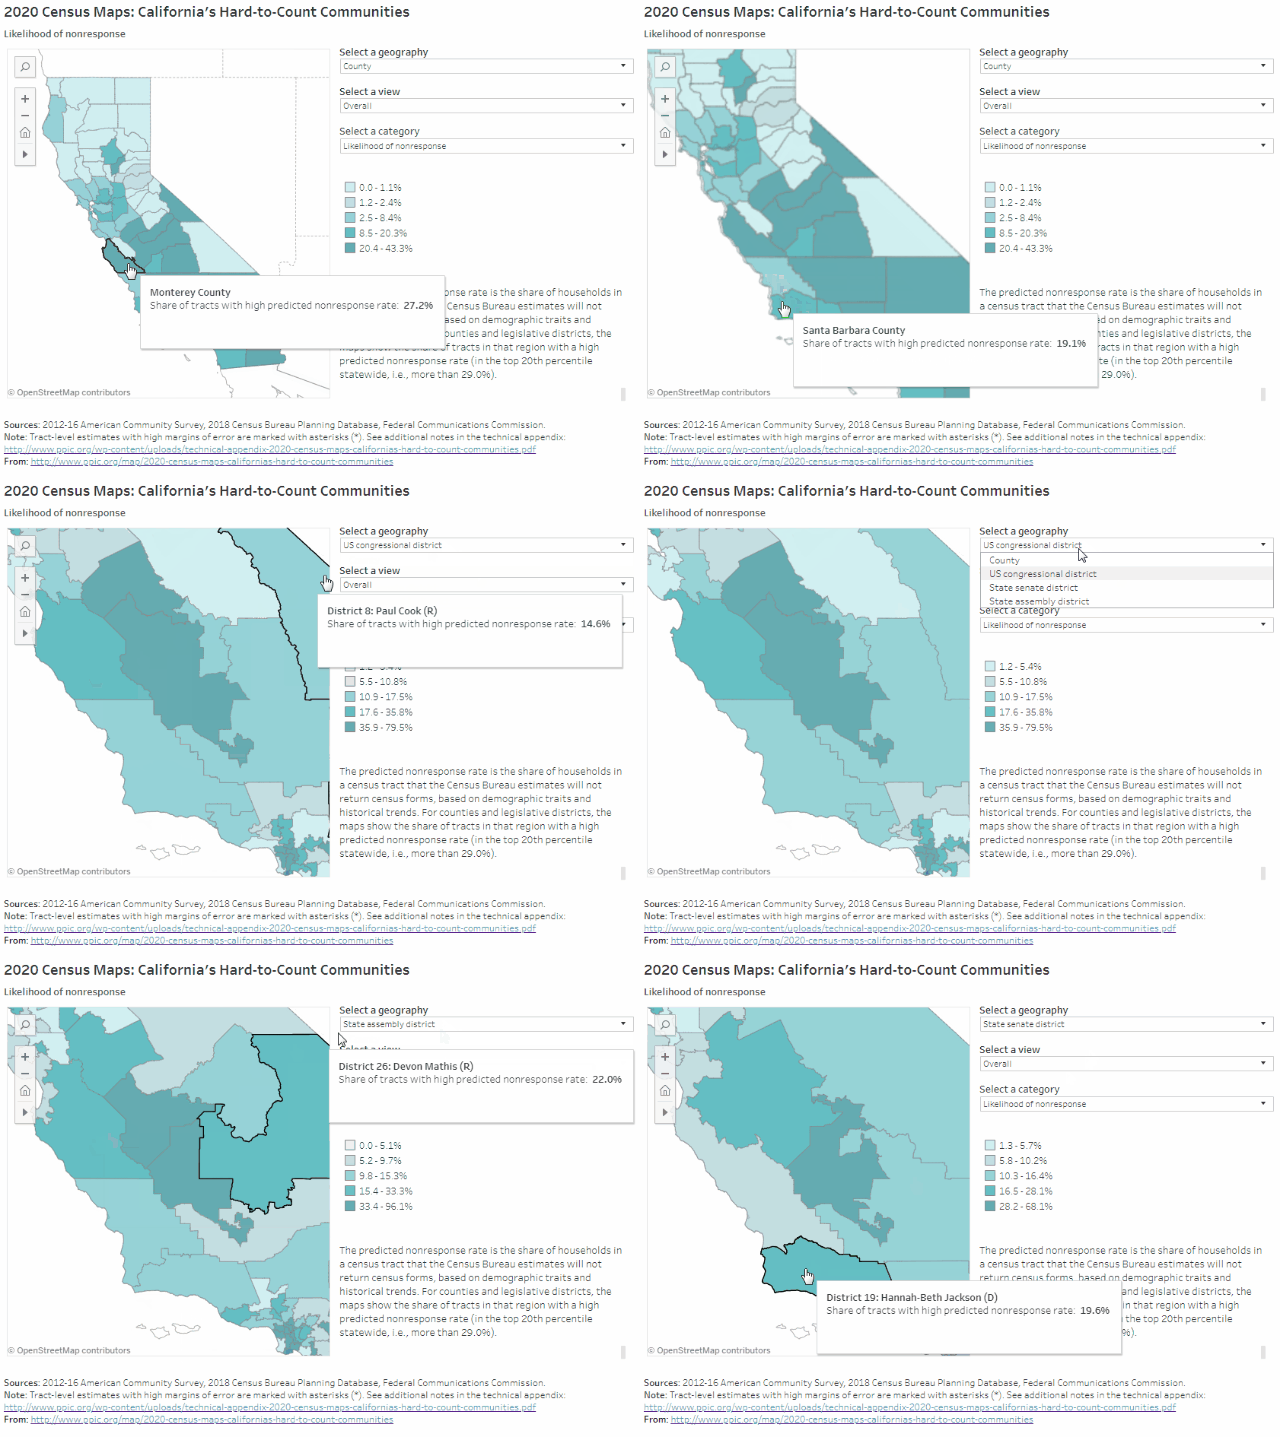
More than 2 million Californians live in the Central Coast counties of Monterey, San Benito, San Luis Obispo, Santa Barbara, and Ventura. Monterey County has by far the region’s highest share of very hard-to-count census tracts (27%), followed by Santa Barbara (19%) and Ventura (12%). Households in these very hard-to-count areas are at risk of being undercounted because they are less likely to respond initially to census forms, according to Census Bureau estimates that draw on historical trends and local demographic characteristics (e.g., race/ethnicity, age, citizenship, and housing conditions).

Census Central Coast

Some highlights:

  • The implications of undercounting very hard-to-reach places differ widely for Central Coast legislators. In two districts representing much of Monterey County—Assembly District 30 (Caballero) and Congressional District 20 (Panetta)—about a fifth or more of census tracts are likely to be very hard to count. The same is true for Senate District 19 (Jackson), covering Santa Barbara and most of Ventura County. Other Central Coast districts have relatively low shares of hard-to-count areas. Given this wide variation, understanding the overlapping factors that can make populations hard to reach will be key to ensuring an accurate count of the Central Coast.
  • There are hard-to-reach areas scattered throughout the region. In Monterey County, areas around Salinas and the Salinas Valley are likely to be the most difficult to count, with 30% or more of households predicted not to respond initially to the census. Other hard-to-reach areas can be found in the city of San Luis Obispo; Santa Maria, Santa Barbara, and Isla Vista in Santa Barbara County; and around Oxnard and Port Hueneme in Ventura County.
  • Monterey and San Benito Counties have relatively high shares of historically undercounted racial/ethnic groups. The census has typically undercounted African Americans, Latinos, and Native Americans. These groups make up about 60% of residents in Monterey and San Benito Counties—but just 24% of San Luis Obispo residents. In Santa Barbara and Ventura Counties, these racial/ethnic groups comprise about 45% of the population, similar to the state overall.
  • Undercounting young children and noncitizens would dramatically misrepresent Monterey County. Young children have been historically undercounted in the census. In addition, noncitizens may be less likely to respond in 2020 due to the planned addition of a citizenship question and fears about privacy and deportation. Almost 22% of Monterey County residents are noncitizens, and about 8% are under five years old—some of the highest concentrations in the state.
  • Outreach to residents in hard-to-count housing will be key to accurately representing the Central Coast. Monterey and Santa Barbara Counties have especially high shares of rental units, overcrowded rentals, and mobile homes. These conditions make it difficult for the Census Bureau to find and count residents. In both counties, nearly 1 in 10 housing units is an overcrowded rental. Northern San Benito County, coastal San Luis Obispo County, Santa Maria, Oxnard, and the Santa Clara River Valley also have hard-to-count housing and will require targeted outreach to fully count residents.
  • Limited internet access may be an issue in rural areas throughout the region. The Census Bureau plans to collect the majority of responses online in 2020—a change from previous practice. Each county along the Central Coast has some census tracts with minimal residential high-speed connectivity, with the lowest access outside cities. In Monterey County, for example, fewer than 400 out of every 1,000 households around Prunedale have high-speed internet connections, compared with 600–800 in neighboring Salinas. While people in these areas may have internet through smartphones or public libraries, in general they may have more trouble responding to the census online.

We hope these maps serve as a starting point to help local, regional, and state leaders think about which activities, resources, and partnerships—including language assistance, awareness raising, and community outreach—might be most effective for accurately counting different parts of California. Stay tuned for future posts that examine hard-to-count communities in other regions of the state.


Video: Californians and Their Government

In the last weeks of the fall campaign, Democrat Gavin Newsom remains ahead of Republican John Cox in the race for governor. In the US Senate race, Dianne Feinstein continues to lead fellow Democrat Kevin de León. Two closely watched ballot measures—Proposition 6, which would repeal the recent gas tax increase, and Proposition 10, which would expand local authority to enact rent control—are still trailing. These and other key findings of the latest PPIC Statewide Survey were outlined by PPIC researcher Alyssa Dykman at a Sacramento briefing last week.

Democrats are more likely than Republicans to be very or extremely enthusiastic about voting in congressional races, and a majority of likely voters favor the Democratic candidate in their US House district. However, most likely voters have negative views of both major parties.

Other survey highlights:

  • Approval ratings for Governor Jerry Brown and the state legislature continue to be much higher than those for President Trump and the US Congress.
  • A majority of likely voters disapprove of the Senate vote to confirm Brett Kavanaugh’s appointment to the Supreme Court.
  • A majority of likely voters favor the Affordable Care Act, and a solid majority say the federal government is responsible for making sure all Americans have health care coverage.
  • Two-thirds of likely voters oppose building a wall along the entire border with Mexico; a slim majority favor the state making its own policies to protect the rights of undocumented immigrants.

Video: 2020 Census: ¿Por qué es tan importante el censo?

El censo decenal juega un papel muy clave en la democracia estadounidense. Es bastante lo que está en juego para California—y el año 2020 se acerca rápidamente.

En este video grabado en español, Joe Hayes, investigador de PPIC, explica la importancia del censo del año 2020, y comenta sobre la propuesta de incluir una pregunta sobre la ciudadanía.

Vea más videos en esta serie.


The decennial census plays an essential role in American democracy. The stakes are huge for California—and 2020 is fast approaching.

In this Spanish-language video, PPIC researcher Joe Hayes explains the importance of the 2020 Census and discusses the proposed citizenship question.

View more videos in this series.


An English transcript of the video is available here.