Video: A Conversation with Candidates for State Superintendent of Public Instruction

As part of our Speaker Series on California’s Future, PPIC is inviting all major candidates in selected statewide races to participate in public conversations. The purpose is to give Californians a better understanding of how candidates would approach the challenges facing our state.

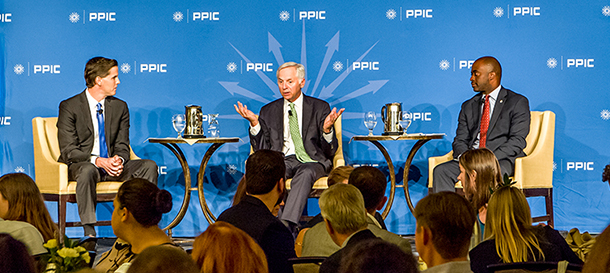
In November, Californians will elect a new superintendent of public education. Education is by far the largest state spending area, and California’s public K–12 system—which educates more than 6 million children—is critical to the state’s future. What are the top priorities of the two candidates and what are their visions for California’s schools? PPIC president Mark Baldassare talked to Tony Thurmond, a member of the state assembly, and Marshall Tuck, a school improvement director, about how they would approach the job.

The candidates largely agreed on the need to increase state education funding and the importance of improving outcomes for low-income students, English Learners, and foster youth. Both are strong advocates for universal preschool. And both stressed the need to prepare all students not just for college and careers but also for civic engagement.

After noting that California currently ranks near the bottom among all states in per pupil funding, Tony Thurmond promised to prioritize moving the state into the top ten within his first four years—and to “take us to number one within eight years.” To help close achievement gaps, he would expand successful local approaches. He cited the Freedom School, an Afro-centric literacy program, and Footsteps to Brilliance, which focuses on immigrant families, as models.

Marshall Tuck emphasized the need to “start with equity.” His first priority would be to change the current funding policies to make sure state funding gets to kids with the greatest need. He would also work to streamline the state education code in order to “unlock the creativity of teachers and principals.”

While they agreed on many issues, Thurmond and Tuck emphasized differences in their backgrounds, each arguing that his experience makes him the better candidate.

Tuck argued that, while money is important, “implementation is key,” and cited his experience implementing successful policies in Los Angeles. After noting that the system has not been working, he argued that the next superintendent should be an education professional who can “fundamentally change the way we are approaching public education.”

Thurmond noted that the superintendent needs to be able to work with the county superintendents, the legislature, and the governor. He outlined his experience as an elected official and educator, as well as his “lived experience” as a student in California public schools—an experience, he said, that demonstrates how “education can save lives.”

Year-Round Support for Low-Income Students

This summer marked the first time in eight years that summer Pell Grants were available. A need-based award to low-income, first-time undergraduates, the federal Pell Grant promotes access to postsecondary education. A summer component means that eligible students can use their Pell Grants year-round and receive up to one and a half awards in one academic year. For example, a student with the maximum school-year award of $6,095 can now receive a summertime award of $3,047—the total Pell Grant for the year would be $9,412. Unlike a student loan, Pell Grants do not need to be repaid. Previous PPIC work suggests that the availability of summer Pell Grants not only expands summer course enrollment but may also increase retention rates and accelerate time to degree.

Who is likely to benefit from summer Pell Grants? Of all California students who received Pell Grants in 2016–17, more than 80% attended a public institution. Further, the California Community Colleges (CCC) enrolled the most Pell recipients of all California’s public institutions: about 60%. The California State University (CSU) and University of California (UC) systems enrolled 29% and 11% of recipients, respectively.

Many students at CCC who receive a Pell Grant also receive state aid, most commonly in the form of a California College Promise Grant tuition waiver. This year, the CCC tuition waiver covers summer enrollment fees as well. Applying the summer Pell Grant on top of the tuition waiver at CCC may enable students to cover significant non-tuition costs like housing, which is often a larger expense than tuition itself. The return of the summer Pell Grant makes year-round college attendance more affordable and enables students to make timely progress to their education goals.

A Long-term View of Higher Education Funding

Along with tuition, state General Fund allocations are the largest source of revenue for California’s public colleges and universities. Overall, the state’s largest General Fund expenditures are in two areas: K–12 education, which has increased in relative size over time, and health and human services, which has experienced slight long-term declines. Corrections, which used to receive a very low share of General Fund allocations, has seen strong growth and now rivals higher education.

For decades the share of the state’s General Fund budget allocated to higher education declined substantially, from 18.0% in 1976–1977 to 10.4% in 2012–13. However, this pattern has reversed in the past few years. Indeed, California’s recently enacted 2018–19 budget continues the gains seen in recent years, with the state’s public colleges and universities receiving 11.7% of General Fund allocations.

These recent increases (and previous declines) were not experienced equally across the state’s three public systems of higher education. Because the community colleges are a part of the Proposition 98 funding guarantee (enacted in 1988), they were protected from the severe funding cuts that were experienced by the University of California (UC) and the California State University (CSU) during the Great Recession and enjoyed sharp gains in revenue as the state’s economy recovered. In comparison, even with increases in recent years, UC and CSU General Fund allocations remain below levels seen in the early 2000s (even as they serve more students), and their share of state General Fund allocations remains at historic lows.

This current funding situation is attributable less to long-term policy choices than to structural components of the state budget. The relatively slow growth of state funding for UC and CSU stems partly from the fact that the systems can raise tuition when state funding is cut during economic downturns. This is clearly not an option for other functions of government, including health and human services, K–12 education, and the corrections system. Budget decisions encompass many competing goals, with difficult trade-offs and long-term impacts. Moving forward, California’s budget planning needs to incorporate long-term goals that lead to a safer, healthier, and more prosperous state.

More Students Are Earning STEM Degrees

The number of students graduating with a bachelor’s degree in science, technology, engineering, or math (STEM) has risen dramatically in California. Both students and colleges are responding to changes in our economy, which increasingly rewards highly educated workers, especially those with STEM degrees.

Between 2010–11 and 2016–17, the number of STEM bachelor’s degrees awarded by colleges and universities in California increased 55%, more than triple the rate of growth in other degrees (17%). By 2016–17, 20% of all bachelor’s degrees awarded were in a STEM field, up from 16% in 2010–11.

These increases occurred across the board for all STEM fields and for all higher education sectors in the state. Increases were especially sharp in engineering, which surpassed biology as the most common STEM degree. Computer and information sciences also saw big gains, with almost three times as many bachelor’s degrees awarded in 2016–17 as in 2010–11. The increase in computer science is particularly notable, as its popularity had declined after the “dot com” bust of the early 2000s.

STEM fields are especially popular at the University of California (UC), which awards almost half of the state’s STEM degrees (compared to only 21% of other bachelor’s degrees). In contrast, California State University (CSU) awards 37% of the state’s bachelor’s degrees in STEM, compared to more than half (52%) in other majors. STEM is also less common at private colleges, especially for-profit institutions.

But there is wide variation across colleges. At UC San Diego (56%) and UC Merced (48%), about half of bachelor’s degrees awarded in 2016–17 were in a STEM field, compared to only 27% at UC Santa Barbara. In the CSU system, 37% of bachelor’s degrees at Cal Poly San Luis Obispo were in STEM, compared to only 8% at Cal State Dominguez Hills. And among the state’s larger private nonprofit colleges (those with at least 1,500 bachelor’s degrees awarded), half of Stanford University’s bachelor’s degrees were in STEM, compared to only 8% at Azusa Pacific.

The rapid growth in STEM majors is a testament to changing interests among students. Those interests are academic, but also economic. Strong labor market outcomes for STEM graduates—especially for those with degrees in engineering and computer science—almost certainly contribute to the increasing demand for those majors.

Colleges have responded, at least in part, by building more capacity for STEM majors. Moreover, public colleges have led the way, with UC and CSU experiencing the largest shifts toward STEM degrees. Between 2010–11 and 2016–17, the share of bachelor’s degrees awarded in STEM fields increased 6.8 percentage points at UC (from 30.0% to 36.8%) and 4.4 percentage points at CSU (from 10.7% to 15.1%), compared to only 2.7 percentage points at private nonprofit colleges (from 12.4% to 15.1%).

While more could be done to fully meet student demand—at many campuses, engineering and computer science majors have more applicants than can be accommodated—the evidence to date shows that California’s higher education system has been able to substantially increase capacity in STEM fields.

Higher Education Finance: How Does California Stack Up?

California’s public higher education spending per student has increased significantly since the end of the Great Recession—it is now higher than at any time since 2002. According to a recent report by the State Higher Education Executive Officers Association (SHEEO), spending increased 41% per student (based on full-time equivalents and adjusted for inflation) between 2012 and 2017 in California, compared to 17% across the rest of the nation. California’s percentage change was third highest in the nation, after Oregon and New Hampshire (both with an increase of 47%). However, both of those states provide much less support per student: in 2017, New Hampshire appropriated $2,959 per student and Oregon allocated $6,514, compared to California’s $10,157. California also ranked third in terms of absolute increases ($2,960 in California, compared to $3,781 in Hawaii and $3,608 in Illinois).

California’s funding increases have not been evenly distributed across the three public systems. Since 1988, the community colleges have benefited from the Proposition 98 funding guarantee for K–14 education. As a result, per student funding for the community colleges is now at an all-time high, but is still below peak UC and CSU funding levels.

Governor Brown recently signed the state budget for 2018–19, which includes $19.2 billion General Fund and local property tax funds for all public higher education systems—about 8% more than the 2017–18 allocation. This continues the recession recovery trajectory and prevents tuition increases at UC and CSU. Moreover, the governor and legislature have made investments in the Rainy Day Fund—increasing reserves to $13.8 billion—that will help protect higher education from recession-related cuts during the next economic downturn.

Good Budget News for Higher Education

The California State Legislature and Governor Brown recently reached a $200 billion budget deal that includes just over a billion dollars in new funding for the state’s public higher education systems. This funding forestalls proposed tuition increases at UC and CSU and allows each system to support increasing student access and success. Moreover, the governor and legislature’s work to maximize the state’s rainy day fund should help to reduce the likelihood of drastic tuition increases in the future, should an economic downturn threaten higher education funding.

The new funding will allow UC and CSU to enroll an additional 1,500 and 3,641 undergraduates, respectively, next fall.  These enrollment increases—coupled with more dollars allocated to improve time-to-degree, boost graduation rates, and close achievement gaps—will help each system to do their part to provide much-needed growth in the number of college graduates in the state.

The budget deal also includes the governor’s top two higher education priorities: the creation of an online-only community college and the introduction of a new community college funding formula. This year, community college funding per full-time student will exceed $8,000—the highest level in the systems’ hundred-year history. (Mainly this is because community college funding falls under Proposition 98, the K–12 funding guarantee passed by voters in 1988.)

The online community college will be launched with $100 million and receive $20 million per year going forward. The goal? To provide opportunities to earn short-term credentials to California’s “stranded workforce” (workers stuck in low paying jobs or jobs that are likely to be automated soon), to help such workers to better compete in today’s labor market. The online college will offer credential programs that have demonstrated labor market value and are not already offered at brick-and-mortar community colleges.

The establishment of a community college funding formula will be phased in over three years. It will provide funding for low-income and underrepresented minority students, reward colleges for improved student outcomes, and reduce reliance on increased enrollment to secure state funding. This approach represents the ongoing emphasis on improving student outcomes at the community colleges.

This is Jerry Brown’s final budget deal—it will be up to the next governor to work with the legislature to ensure the ongoing health of the public higher education system. California’s future economy depends on it.

Trends in Math Reforms at Community Colleges

The landscape of developmental (also known as remedial) math at California’s community colleges has changed dramatically in recent years. With the passage of Assembly Bill 705, community colleges will be required to maximize entering students’ likelihood of completing college-level math and English within a year. This is a critical goal. Our research has shown that developmental course sequences are lengthy, delaying students’ academic careers and sometimes affecting their ability to advance to college-level coursework.

The new law goes into effect in fall 2019, but many colleges have already started implementing reforms to improve the accuracy of placement into developmental education and to shorten developmental sequences while making them more relevant to students. In the 2017–18 school year, 83% of community colleges offered new developmental math courses in addition to or in place of traditional courses. Example course reforms include:

  • Offering statistics pathways for students in majors that only require statistics (e.g., liberal arts and humanities fields)
  • Compressing the traditional multi-course developmental sequence into a single course
  • Providing lab time or supplemental instruction in a co-requisite course while allowing students to enroll directly into college-level math
  • Designing curricula aligned with students’ programs of study
  • Dividing courses into modules that represent discrete math competencies

However, the availability of these new courses varies greatly within colleges and across the state. As illustrated in the map below, for every 100 traditional math courses offered in each region of California, less than 50 reform courses are offered, indicating that on the whole reform courses are still not as available as traditional courses. Moreover, reform courses tend to have fewer sections, which further limits enrollment.

Colleges that are adopting course reforms are mostly concentrated in highly populated regions such as the Bay Area and South Coast, which collectively serve about 56% of full-time community college students in the state. In contrast, the San Joaquin Valley stands out as having the smallest ratio of reform to traditional developmental math courses, while serving roughly 10% of full-time community college students in the state. Only six out of the thirteen colleges located in the San Joaquin Valley offer at least one course-level reform.

Although some California community colleges have already implemented developmental math reforms, overall, these efforts have reached only a small fraction of the students that could potentially benefit. Math guidelines for AB 705 are still pending, but the legislation may offer the leverage needed to implement effective reforms at scale and dramatically improve student completion of college-level math courses.

Gender Imbalances in STEM Majors

In California and the United States as a whole, women have made strong educational progress over many decades. In 2006, for the first time ever in California, women became more likely to hold a bachelor’s degree than men. Women’s educational advantage over men has continued to grow in the past decade. In 2017, women received 57% of the bachelor’s degrees, 58% of the master’s degrees, and 54% of the doctorates awarded by California colleges. Much of this advantage stems from better preparation: women are more likely to graduate from high school than men and are also more likely to complete the college preparatory courses required for admission to the state’s public universities. Even so, women remain underrepresented in key science, technology, engineering, and mathematics (STEM) majors—in California and across the nation.

Statewide, only a few majors are gender balanced—meaning that half the bachelor’s degrees are awarded to women and half to men. In 2016, according to federal data, among the 22 most popular majors in California’s public and private nonprofit colleges, more than 60% of the bachelor’s degrees in 10 majors and fewer than 45% of degrees in 5 majors were awarded to women. At one extreme, women make up more than 80% of the graduates in consumer sciences, education, liberal arts, social services, and health professions. At the other extreme, only about 20% of bachelor’s degrees in engineering and computer science were awarded to women in 2016.

Because engineering and computer science are associated with strong labor market outcomes, low shares of women in those fields is cause for concern. The proportion of women majoring in these fields has not risen much in recent years: from 2010 to 2016, the share of bachelor’s degrees awarded to women in California increased from 19% to 21% in engineering and from 16% to 18% in computer science.

Efforts to address STEM gender imbalances are under way. For example, an NSF study by UCLA researchers is using longitudinal data across a set of colleges to identify actions that can increase the share of women in computer science. Given California’s high tech economy, the state’s colleges and universities should play a leading role in meeting this challenge.

How Changes in Immigration Affect California’s Workforce

[vc_row][vc_column][vc_column_text]Immigrants are essential to California’s workforce. In the past two decades, as labor market needs have shifted, the composition of recent immigrants (those arriving in the last five years) has changed dramatically. Today, recent immigrants to California are much more likely to hold a bachelor’s or more advanced degree than in the past—and in fact are now more likely than US-born Californians to do so.

While the number of recent immigrants to California fell by 24% between 2000 and 2016, the number of highly educated immigrants rose by 41%. In 2016, about half of recent immigrants held at least a bachelor’s degree. Highly educated immigrants work in every major industry in the state and comprise about 30% of the highly educated workforce.

These changes in educational attainment coincide with other shifts in immigration patterns. A large portion of the decline in immigration to California can be attributed to the falling numbers of immigrants arriving from Mexico. In 2000, over half a million recent immigrants came from Mexico. By 2016, that number fell by more than 70% to less than 150,000 people.

Now, China has slightly edged out Mexico as the leading country of origin, and these top two countries are followed by India, the Philippines, and Vietnam. Immigrants from China and India tend to be highly educated: in 2016, 47% of recent immigrants from China—and around 80% of recent immigrants from India—had at least a bachelor’s degree. The interactive below allows you to further explore changes in education levels over time among recent immigrants overall and from these five countries.

The sharp increase in highly educated immigrants and the decline in less-educated immigrants reflect the changing labor market in California. Unemployment rates for workers with at least a bachelor’s degree (3.3%) are about half those of less-educated workers (6.5%). With California expected to face a shortfall of 1.1 million college graduates by 2030, highly educated immigrants are a key component to helping the state address the workforce skills gap.[/vc_column_text][/vc_column][/vc_row][vc_row][vc_column][vc_raw_html]JTNDZGl2JTIwY2xhc3MlM0QlMjd0YWJsZWF1UGxhY2Vob2xkZXIlMjclMjBpZCUzRCUyN3ZpejE1Mjc4Nzg3ODgxNDYlMjclMjBzdHlsZSUzRCUyN3Bvc2l0aW9uJTNBJTIwcmVsYXRpdmUlMjclM0UlMEElMDklM0Nub3NjcmlwdCUzRSUwQSUwOSUzQ2ElMjBocmVmJTNEJTI3JTIzJTI3JTNFJTNDaW1nJTIwYWx0JTNEJTI3RURVQ0FUSU9OJTIwTEVWRUxTJTIwVkFSWSUyMEFDUk9TUyUyMElNTUlHUkFOVCUyMEdST1VQUyUyMCUyNyUyMHNyYyUzRCUyN2h0dHBzJTNBJTI2JTIzNDclM0IlMjYlMjM0NyUzQnB1YmxpYy50YWJsZWF1LmNvbSUyNiUyMzQ3JTNCc3RhdGljJTI2JTIzNDclM0JpbWFnZXMlMjYlMjM0NyUzQkNhJTI2JTIzNDclM0JDYWxpZm9ybmlhc2ltbWlncmFudHNhbmRlZHVjYXRpb25sZXZlbHNfMCUyNiUyMzQ3JTNCSW1taWdyYW50c2luQ2FsaWZvcm5pYWJ5ZWR1Y2F0aW9uYW5kY291bnRyeW9mb3JpZ2luJTI2JTIzNDclM0IxX3Jzcy5wbmclMjclMjBzdHlsZSUzRCUyN2JvcmRlciUzQSUyMG5vbmUlMjclMjAlMkYlM0UlM0MlMkZhJTNFJTBBJTA5JTNDJTJGbm9zY3JpcHQlM0UlMEElMDklM0NvYmplY3QlMjBjbGFzcyUzRCUyN3RhYmxlYXVWaXolMjclMjAlMjBzdHlsZSUzRCUyN2Rpc3BsYXklM0Fub25lJTNCJTI3JTNFJTBBJTA5JTA5JTNDcGFyYW0lMjBuYW1lJTNEJTI3aG9zdF91cmwlMjclMjB2YWx1ZSUzRCUyN2h0dHBzJTI1M0ElMjUyRiUyNTJGcHVibGljLnRhYmxlYXUuY29tJTI1MkYlMjclMjAlMkYlM0UlMEElMDklMDklM0NwYXJhbSUyMG5hbWUlM0QlMjdlbWJlZF9jb2RlX3ZlcnNpb24lMjclMjB2YWx1ZSUzRCUyNzMlMjclMjAlMkYlM0UlMEElMDklMDklM0NwYXJhbSUyMG5hbWUlM0QlMjdzaXRlX3Jvb3QlMjclMjB2YWx1ZSUzRCUyNyUyNyUyMCUyRiUzRSUwQSUwOSUwOSUzQ3BhcmFtJTIwbmFtZSUzRCUyN25hbWUlMjclMjB2YWx1ZSUzRCUyN0NhbGlmb3JuaWFzaW1taWdyYW50c2FuZGVkdWNhdGlvbmxldmVsc18wJTI2JTIzNDclM0JJbW1pZ3JhbnRzaW5DYWxpZm9ybmlhYnllZHVjYXRpb25hbmRjb3VudHJ5b2ZvcmlnaW4lMjclMjAlMkYlM0UlMEElMDklMDklM0NwYXJhbSUyMG5hbWUlM0QlMjd0YWJzJTI3JTIwdmFsdWUlM0QlMjdubyUyNyUyMCUyRiUzRSUwQSUwOSUwOSUzQ3BhcmFtJTIwbmFtZSUzRCUyN3Rvb2xiYXIlMjclMjB2YWx1ZSUzRCUyN25vJTI3JTIwJTJGJTNFJTBBJTA5JTA5JTNDcGFyYW0lMjBuYW1lJTNEJTI3c3RhdGljX2ltYWdlJTI3JTIwdmFsdWUlM0QlMjdodHRwcyUzQSUyNiUyMzQ3JTNCJTI2JTIzNDclM0JwdWJsaWMudGFibGVhdS5jb20lMjYlMjM0NyUzQnN0YXRpYyUyNiUyMzQ3JTNCaW1hZ2VzJTI2JTIzNDclM0JDYSUyNiUyMzQ3JTNCQ2FsaWZvcm5pYXNpbW1pZ3JhbnRzYW5kZWR1Y2F0aW9ubGV2ZWxzXzAlMjYlMjM0NyUzQkltbWlncmFudHNpbkNhbGlmb3JuaWFieWVkdWNhdGlvbmFuZGNvdW50cnlvZm9yaWdpbiUyNiUyMzQ3JTNCMS5wbmclMjclMjAlMkYlM0UlMEElMDklMDklM0NwYXJhbSUyMG5hbWUlM0QlMjdhbmltYXRlX3RyYW5zaXRpb24lMjclMjB2YWx1ZSUzRCUyN3llcyUyNyUyMCUyRiUzRSUwQSUwOSUwOSUzQ3BhcmFtJTIwbmFtZSUzRCUyN2Rpc3BsYXlfc3RhdGljX2ltYWdlJTI3JTIwdmFsdWUlM0QlMjd5ZXMlMjclMjAlMkYlM0UlMEElMDklMDklM0NwYXJhbSUyMG5hbWUlM0QlMjdkaXNwbGF5X3NwaW5uZXIlMjclMjB2YWx1ZSUzRCUyN3llcyUyNyUyMCUyRiUzRSUwQSUwOSUwOSUzQ3BhcmFtJTIwbmFtZSUzRCUyN2Rpc3BsYXlfb3ZlcmxheSUyNyUyMHZhbHVlJTNEJTI3eWVzJTI3JTIwJTJGJTNFJTBBJTA5JTA5JTNDcGFyYW0lMjBuYW1lJTNEJTI3ZGlzcGxheV9jb3VudCUyNyUyMHZhbHVlJTNEJTI3eWVzJTI3JTIwJTJGJTNFJTBBJTA5JTNDJTJGb2JqZWN0JTNFJTBBJTNDJTJGZGl2JTNFJTBBJTNDc2NyaXB0JTIwdHlwZSUzRCUyN3RleHQlMkZqYXZhc2NyaXB0JTI3JTNFJTBBJTIwJTIwJTIwJTIwJTIwJTIwJTIwJTIwJTIwJTIwJTIwJTIwJTIwJTIwJTIwJTIwJTIwJTIwJTIwJTIwdmFyJTIwZGl2RWxlbWVudCUyMCUzRCUyMGRvY3VtZW50LmdldEVsZW1lbnRCeUlkJTI4JTI3dml6MTUyNzg3ODc4ODE0NiUyNyUyOSUzQiUwQSUyMCUyMCUyMCUyMCUyMCUyMCUyMCUyMCUyMCUyMCUyMCUyMCUyMCUyMCUyMCUyMCUyMCUyMCUyMCUyMHZhciUyMHZpekVsZW1lbnQlMjAlM0QlMjBkaXZFbGVtZW50LmdldEVsZW1lbnRzQnlUYWdOYW1lJTI4JTI3b2JqZWN0JTI3JTI5JTVCMCU1RCUzQiUwQSUyMCUyMCUyMCUyMCUyMCUyMCUyMCUyMCUyMCUyMCUyMCUyMCUyMCUyMCUyMCUyMCUyMCUyMCUyMCUyMGlmJTIwJTI4JTIwZGl2RWxlbWVudC5vZmZzZXRXaWR0aCUyMCUzRSUyMDcwMCUyMCUyOSUyMCU3QiUyMCUwQSUwOSUwOSUwOSUwOSUwOSUwOXZpekVsZW1lbnQuc3R5bGUud2lkdGglM0QlMjc2NTBweCUyNyUzQnZpekVsZW1lbnQuc3R5bGUuaGVpZ2h0JTNEJTI3NjAwcHglMjclM0IlMEElMDklMDklMDklMDklMDklN0QlMjBlbHNlJTIwaWYlMjAlMjglMjBkaXZFbGVtZW50Lm9mZnNldFdpZHRoJTIwJTNFJTIwNTAwJTIwJTI5JTIwJTdCJTBBJTA5JTA5JTA5JTA5JTA5JTA5dml6RWxlbWVudC5zdHlsZS53aWR0aCUzRCUyNzUwMHB4JTI3JTNCdml6RWxlbWVudC5zdHlsZS5oZWlnaHQlM0QlMjc3MzBweCUyNyUzQiUwQSUwOSUwOSUwOSUwOSUwOSU3RCUyMGVsc2UlMjAlN0IlMEElMDklMDklMDklMDklMDklMDl2aXpFbGVtZW50LnN0eWxlLndpZHRoJTNEJTI3MTAwJTI1JTI3JTNCdml6RWxlbWVudC5zdHlsZS5oZWlnaHQlM0QlMjc3MzBweCUyNyUzQiUwQSUwOSUwOSUwOSUwOSUwOSU3RCUwQSUwOSUwOSUwOSUwOSUwOXZhciUyMHNjcmlwdEVsZW1lbnQlMjAlM0QlMjBkb2N1bWVudC5jcmVhdGVFbGVtZW50JTI4JTI3c2NyaXB0JTI3JTI5JTNCJTBBJTA5JTA5JTA5JTA5JTA5c2NyaXB0RWxlbWVudC5zcmMlMjAlM0QlMjAlMjdodHRwcyUzQSUyRiUyRnB1YmxpYy50YWJsZWF1LmNvbSUyRmphdmFzY3JpcHRzJTJGYXBpJTJGdml6X3YxLmpzJTI3JTNCJTBBJTA5JTA5JTA5JTA5JTA5dml6RWxlbWVudC5wYXJlbnROb2RlLmluc2VydEJlZm9yZSUyOHNjcmlwdEVsZW1lbnQlMkMlMjB2aXpFbGVtZW50JTI5JTNCJTBBJTNDJTJGc2NyaXB0JTNF[/vc_raw_html][/vc_column][/vc_row]

Encouraging Full-Time Enrollment to Boost College Graduation Rates

As colleges seek to improve graduation rates, many have focused on increasing the number of students enrolled full time. New data from the US Department of Education show that students at California’s public colleges and universities who first enroll on a full-time basis are much more likely to graduate within six years than students who first enroll part time. These higher graduation rates are observed both for first-time freshmen and for transfer students.

Full-time enrollment varies widely across California’s public systems of higher education. Students at California State University (CSU) and the University of California (UC) are overwhelmingly full time, whereas most students at the community colleges enroll part time. UC requires students to enroll full time (at least 12 units per semester) unless they receive approval for part-time status. Some CSU campuses recently started encouraging students to agree to take 15 units per semester (a full-time course load), as have some community colleges.

Full-time enrollment campaigns (frequently known as “15 to finish”) have been gaining traction across the country. In some states, such as Hawaii and Indiana, more students are completing 15 credits per semester and four-year graduation rates are rising. But messaging and financial incentives aren’t enough to help all part-time students make the transition to full-time enrollment. Community colleges enroll large numbers of nontraditional students who have significant work, family, and other outside obligations. Some of these students may not be able to enroll full time and/or may need holistic supports such as child care services and transportation subsidies in order to succeed. To the extent possible, the state and its higher education institutions should look for ways to help more students enroll full time so that they can progress toward graduation.